Breeze-viz offers a
scatter function that adds a significant degree of customization to scatter plots. In particular, we can use the size and color of the marker points to add additional dimensions of information to the plot.
The scatter function takes, as its first two arguments, collections of x and y points. The third argument is a function mapping an integer i to a Double indicating the size of the ith point. The size of the point is measured in units of the x axis. If you have the sizes as a Scala collection or a Breeze vector, you can use that collection's apply method as the function. Let's see how this works in practice.
As with the previous examples, we will use the REPL, but you can find a sample program in BreezeDemo.scala:
scala> val fig = new Figure("Advanced scatter example")
fig: breeze.plot.Figure = breeze.plot.Figure@220821bc

scala> val plt = fig.subplot(0)
plt: breeze.plot.Plot = breeze.plot.Plot@668f8ae0

scala> val xs = linspace(0.0, 1.0, 100)
xs: breeze.linalg.DenseVector[Double] = DenseVector(0.0, 0.010101010101010102, 0.0202 ...

scala> val sizes = 0.025 * DenseVector.rand(100) // random sizes
sizes: breeze.linalg.DenseVector[Double] = DenseVector(0.014879265631723166, 0.00219551...

scala> plt += scatter(xs, xs :^ 2.0, sizes.apply)
breeze.plot.Plot = breeze.plot.Plot@668f8ae0
Selecting custom colors works in a similar manner: we pass in a colors argument that maps an integer index to a java.awt.Paint object. Using these directly can be cumbersome, so Breeze provides some default palettes. For instance, the GradientPaintScale maps doubles in a given domain to a uniform color gradient. Let's map doubles in the range 0.0 to 1.0 to the colors between red and green:
scala> val palette = new GradientPaintScale(
  0.0, 1.0, PaintScale.RedToGreen)
palette: breeze.plot.GradientPaintScale[Double] = <function1>

scala> palette(0.5) // half-way between red and green
java.awt.Paint = java.awt.Color[r=127,g=127,b=0]

scala> palette(1.0) // green
java.awt.Paint = java.awt.Color[r=0,g=254,b=0]
Besides the GradientPaintScale, breeze-viz provides a CategoricalPaintScale class for categorical palettes. For an overview of the different palettes, consult the source file PaintScale.scala at scala: https://github.com/scalanlp/breeze/blob/master/viz/src/main/scala/breeze/plot/PaintScale.scala.
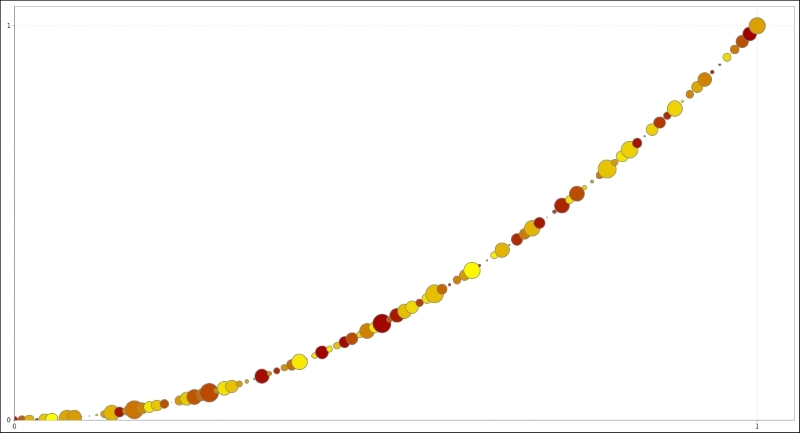
Let's use our newfound knowledge to draw a multicolor scatter plot. We will assume the same initialization as the previous example. We will assign a random color to each point:
scala> val palette = new GradientPaintScale(0.0, 1.0, PaintScale.MaroonToGold)
palette: breeze.plot.GradientPaintScale[Double] = <function1>

scala> val colors = DenseVector.rand(100).mapValues(palette)
colors: breeze.linalg.DenseVector[java.awt.Paint] = DenseVector(java.awt.Color[r=162,g=5,b=0], ...

scala> plt += scatter(xs, xs :^ 2.0, sizes.apply, colors.apply)
breeze.plot.Plot = breeze.plot.Plot@8ff7e27