The aim of this chapter is to present in more detail how the cycle indicator can become an important addition to technical analysis.
A goal of this book has been to advance the ability of traders to detect price patterns and discern when they change. The conventional method has been to use charts that filter out time in looking at price movement, and to detect changes in the trend condition of a price. We certainly know now that price break, Kagi, Renko, and point and figure charting help clarify detection of changes in price patterns from different vantage points. These charts create boundaries or landmarks that verify changes in the price direction or pattern. But are they enough? How can the trader uncover even more about the price behavior that is being evaluated?
Luckily, the quest for knowledge that can give the trader an edge doesn't stop with candlestick, price break, Kagi, Renko, or point and figure. There is a new generation of advanced technical indicators that can also enable the trader to detect hidden patterns in price data. Some of these indicators come from physics, and others come from the field of manufacturing control. Few traders have heard of them because they are used as research tools, and only now are coming into the hands of the trader through retail software products. Traders should seriously consider them, because when used alone or with alternative charts, these indicators provide new insights for the trader. The overall function of these new forms of indicators is to filter out the noise and pinpoint the regularity of a pattern. These indicators apply known advances in statistical analysis and science. They are known collectively as cycle indicators. Let's look at some examples and their applications to trading analysis.
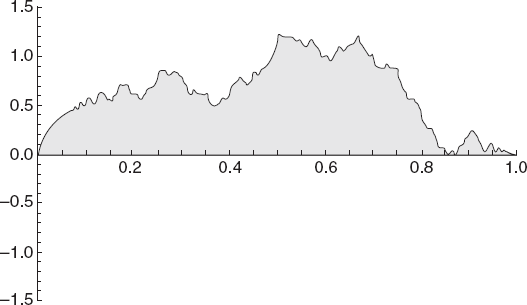
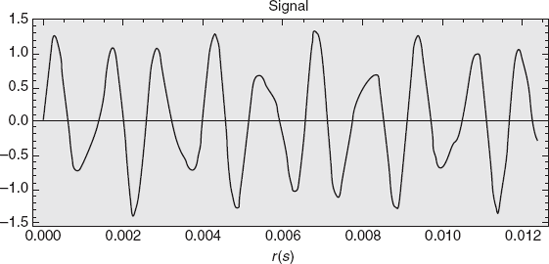
Beyond recognizing the obvious fact that price patterns very often seem to reoccur, the enormous challenge is to find out what the underlying pattern is. Even if a price is visually recognized to be in a trend or in a sideways pattern, the data that generated the chart is unprocessed raw data. The scientific fact is that it may also have within it a wave. We have already introduced the idea that a channel pattern is really a form of a wave. However, especially when one uses high-frequency data and small time intervals, the presence of waves is not easy to detect. The average trader does not have the tools, beyond simple visual analysis, to decipher the cycles in the patterns, and as a result, he ignores them. The consequence is that he misses important alerts about price direction and possible turning points. None of the alternative charting tools we have discussed can detect waves in the prices. They all work on visuali-zing the raw price data. The important question that a trader should try to answer is whether the observed changes in the prices coincide with wave-like embedded turning points. For example, in Figure 13.1a, we see a pattern that looks very much like a price chart. Any trader would identify areas in this chart as trend lines. A closer look reveals that this chart is just a pattern generated by the following equation using Mathematica software (Figure 13.1b).
The point is that a trader needs to unmask the hidden patterns that generate the chart.
Next time you look at a chart, remember that it is likely that a hidden pattern generated the price patterns. While it is human nature to think of price movements as linear, they do not have to be. In fact, a great many of the patterns behind the prices are cyclical waveforms. Ignoring this real possibility leads to misinterpreting the path that prices are likely to take.
Let's first review exactly what a wave is. Most readers have forgotten basic geometry and trigonometry, but the world has known about waves for thousands of years. Mathematical historians cite the discovery of the geometry of waves as dating back to 200 BC, during the time of Hipparchus.
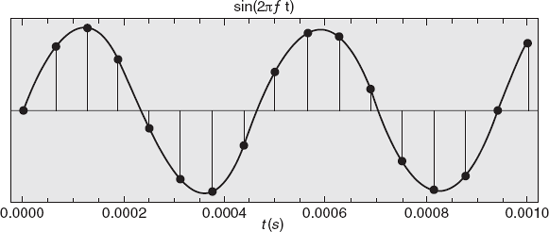
A wave is a function that is mathematically composed of a sine wave. The wavy form in Figure 13.2 should be very familiar.
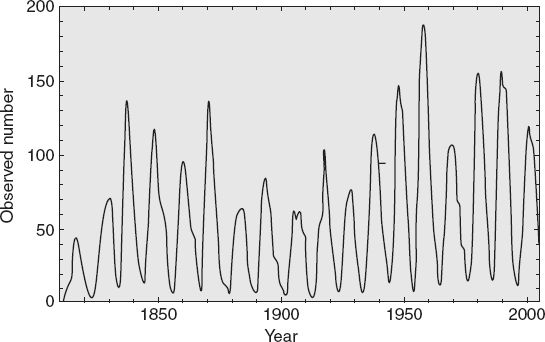
One of the most confirmed cycles in nature is the eleven-year sunspot cycle. Its peaks and troughs (Figure 13.3) are highly predictable.
Another example of a wave, this time formed by a combination of two tones, is shown in Figure 13.4.
Both the sunspot cycle and the two-tone cycle are natural, real cycles and are indisputably part of the physics of their phenomena.
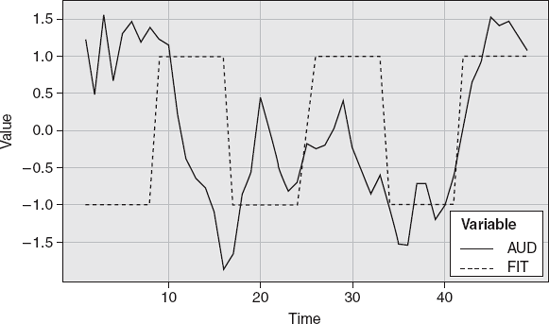
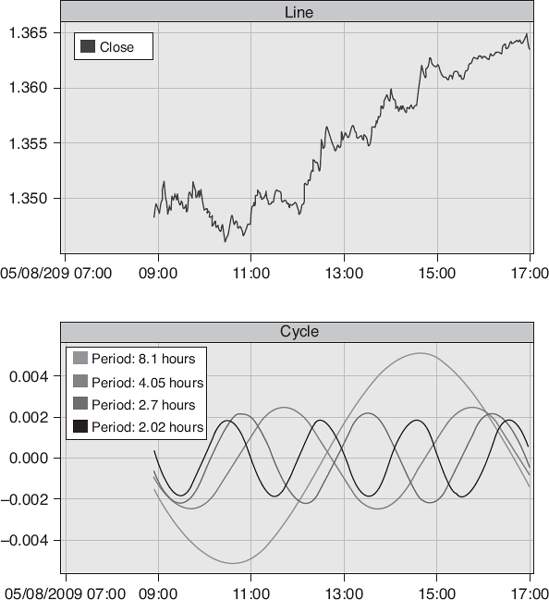
So what about price data? Is it cyclical? Let's look at some real data. We used one-minute data of the AUDUSD. Statistical analysis of this data indicated that there was a significant wave at a sixteen-minute interval. We were able to transform the one-minute data into five different types of waves: rectified sine, sawtooth, regular sine, square, and triangle (Figures 13.5-13.9).
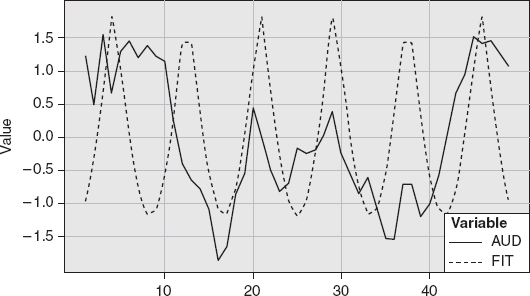
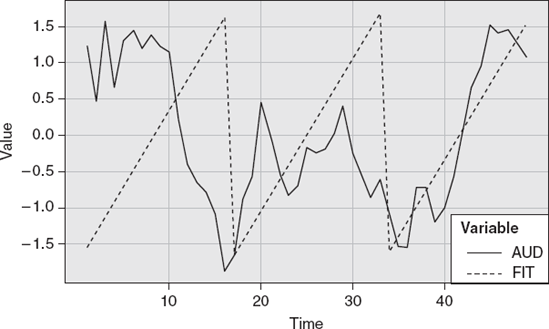
The next task is to decide which one is the best fit. Notice that in all the different wave types, there are instances where the turning points of the waves coincide with the data peaks and troughs.
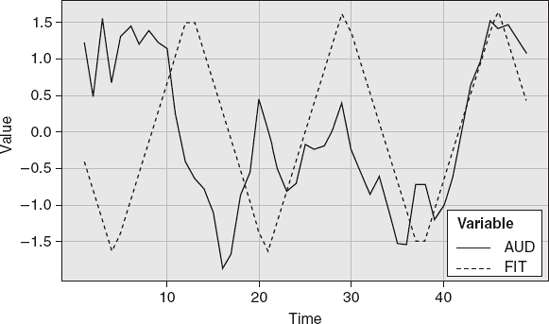
The trader needs to be sensitive to exactly what is being presented when cycles are displayed. A sine wave appears more frequently. Additionally, a composite of waves is commonly presented. Figure 13.10 shows an integration of the four waves of the one-minute AUD.

The challenge, when using cycle indicators, is to make sure that the wave form that is represented clearly indicates it is a composite wave form representing an attempt to generate the best fit.
The main idea behind cycle indicators is to flush out what kinds of waves are embedded in the price data. Why waves appear is not answerable. They are part of the fabric of nature. Whenever energy is used, waveforms are part of it. It is similar to the question of why Fibonacci ratios work. A wave initiation can be the result of an exogenous event, such as news, that ignites an expansion of price over time, resulting in a peak, and then a contraction, and then a trough. A wave may also be a hidden pattern in the price behavior itself. No one can predict what will cause a wave. Let's just agree that waves are part of the fabric of how nature and energy work, and that they do appear in price action.
While we did not intend this chapter to be a course in wave physics, a few key features of waves are important to understand. These include amplitude, period, and frequency.
Amplitude = Height of wave
Period = Time it takes to complete one wave
Frequency = Number of oscillations per period (1/Period)
If we detect a wave cycle in the price data, it will have all of these features. If the indicator is valid, it will detect the origin and project the cycle into the future. Such a projection also forecasts the peaks and troughs. In effect, it becomes a timing device and a confirming indicator of other tools of technical analysis. Notice that the emphasis is on confirmation and not on isolated use of wave cycle indicators.
The task for technical analysis is therefore to enable traders to generate the best-fitting waves for any series of data. This is not a trivial task, and it is critical to understanding how to view price action. The trader views the actual price, but can't detect hidden patterns. Cycle-based indicators break down the price or "time series" into different components. When the price data is de-trended and unmasked, the trader will see a familiar trend component represented by a straight line. Cycle programs that do not de-trend the data are not following accepted practice of statistics.
There is also a seasonal component of periodic swings that can be the result of outside but predictable conditions. After going through some advanced statistical processing (which with today's computers is very easy to program), we arrive at the cyclical components of the price data. If the data has a periodic peak and trough, and goes through contractions and expansions, a cycle has been discovered.
The last component of any series of data is a random component: the noise. Noise cannot be explained and is nonrepeating and irregular.
Put all these components back together and you get the traditional chart. This has astounding implications: To understand the patterns behind the chart will require deconstructing the chart into the various elements we have discussed. Let's review how this kind of deconstruction occurs in current practice.
The current generation of cycle indicators uses Fourier analysis, which is a standard method of filtering noise out of price data. The term harmonic analysis, which has appeared in technical analysis literature, actually relates to the Fourier technique. What Fourier analysis does is take data and construct wave patterns around the data. There are several ways for a trader to generate a Fourier-type analysis. A well-informed trader with Excel can generate Fourier waves using available standard equations.
Using one-minute AUDUSD data (Figure 13.11), we can see where the prices peaked in coincidence with peaks in the cycle, and where bottoms occurred in coincidence with troughs.
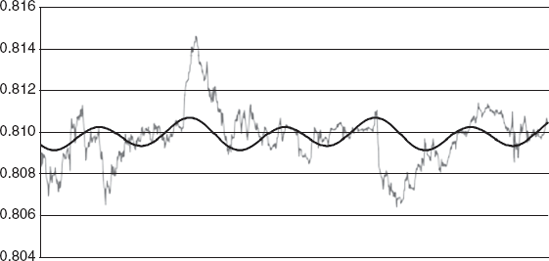
Figure 13.11. Fourier Analysis of AUD One-Minute Price Data.: Source: Abe Cofnas and Joseph Egbulefu
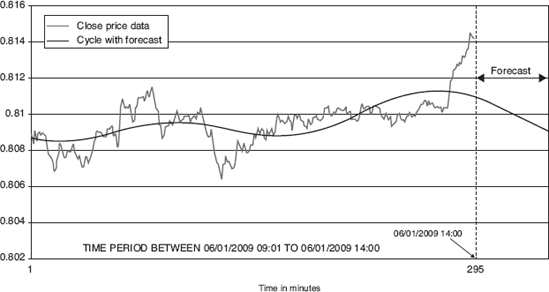
A key next step is to project or forecast the cycle wave into the near future. Cycle users need to keep in mind that the longer the forecast period the greater the potential for an error in the forecast. Figure 13.12 shows how it looks.
There is no doubt that cycles exist in price action and can be detected and visualized. Advances have made cycle analysis and tools available at a retail level to the trader. Here are some key questions to ask before you purchase a cycle indicator package:
What is the methodology generating the cycle? Essentially, cycle methodology is based on Fourier analysis and its variations. These include standard Fourier and fast Fourier.
How many data points are needed to generate the cycle wave? Some vendors require more data points than do others. Beware of the vendors that require a relatively small set of data points. Cycle detection, to be reliable, requires more data points, not fewer.
Does the software project a cycle wave into the future? How far? Depending on the time series, projections could extend over many periods into the future. This would allow verification of the forecasting power of the cycle tool.
Can you upload your own data series into the software and generate your own wave? This is an important capability, as it allows the serious trader to evaluate his own data.
Does the software indicate measures of the accuracy of the wave fit? Look to see if there is any data plotting a profit-and-loss scenario using the projected wave. The ability to provide a high-probable fit for a projected turning point is the goal of any software and a criterion for its evaluation.
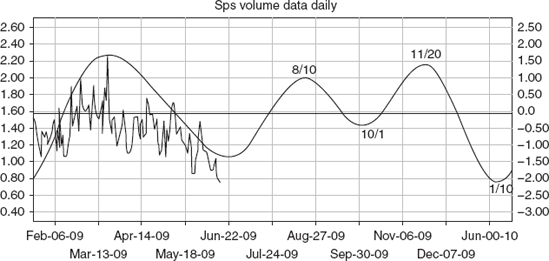
The applications of cycle analysis go beyond price data. Applying cycle analysis to volume data can be very productive for the trader. The conventional wisdom shows that volume is a barometer of sentiment. When you apply a cycle analysis to volume data, you can then use projected peaks or bottoms in volume to help shape trading strategy. In Figure 13.13, we see a sine wave generated by volume data.
A new type of cycle detection and projection indicator that goes beyond Fourier analysis is now underway. It promises to be a very significant addition to the trader's toolbox. It is known as wavelets. Wavelets go further than Fourier analysis and the programs that slice the price data into small sections, decompose the data into the key parts of a trend or cycle, and identify turning points. The wavelet then projects out into the near future identifying a probable next path for the prices. It promises to be much more useful than current Fourier analysis. The trader who is serious about using cycle indicators as part of the total toolbox of trading should keep a watch for wavelet applications. Table 13.1 compares Fourier analysis and wavelets.
Table 13.1. Fourier Analysis and Wavelets Compared
Comparison Metric | Fourier Transform Method | Wavelets |
|---|---|---|
Source: Abe Cofnas and Sridhar Iyer | ||
Basis | Sines and cosines. | Basis constructed by shifting and by vertical and horizontal scaling of certain prototype general functions called wavelets. |
Price data assumption—Signal content | Method assumes that the input price data series is the representation of an infinite sum of sinusoids with a various phase, amplitude, and frequency. | Method is flexible and hence does not place any restrictive assumptions on the data series. |
Price data assumption—Frequency content | Method assumes signal stationarity, meaning that the frequency content remains unchanged over time and all frequency components in the price data series exist at all times. | Method handles nonstationary signals. This means that the frequency of signal components in the time-series data may change over time. Wavelets can also capture frequency components that appear, disappear, and then reappear over time. |
Price data feature capture—trends, abrupt changes, discontinuities | Cannot capture these features due to the sine/cosine basis assumption in the Fourier transformation (FT) process. | Can capture trends, abrupt changes, and discontinuities in the time-series price data because the wavelet transformation basis is flexible. |
Process flexibility | Fourier transformation process is inflexible due to its basis and input data stationarity assumptions. Short-Time Fourier Transform (STFT) improves on FT. The time-series data is divided into small segments and the signal on each of these segments is assumed as stationary. Drawbacks of STFT: No inverse process, i.e., original signal cannot be reconstructed; window size chosen is the same for all frequencies—impractical since window sizing needs scaling up for low frequencies and vice versa for high-frequency signals. | Flexible process. Wavelet transform employs windowing techniques with variable-sized regions. This allows handling of high-frequency components for a short duration (bursts) and low-frequency components for long durations (trends). Ability to project prices in the presence of trends, abrupt changes, and discontinuities is essential, and wavelet transforms does not overlook these in the input time series. |
Multiscale time-frame analysis | Does poorly on multiscale time-frame analysis. | Allows multiscale analysis of prices on various time frames by separating traders into various groups: scalpers, day traders, swing traders, and position traders. |
Applicability as a price forecasting tool | Because of the suppositions placed on the input data, it is a restrictive forecasting tool for time-series price data. | Wavelets can be used effectively with neural networks, genetic algorithms, and other methods to forecast prices. |
Performance | Operations, although efficient, are not so efficient when handling massive amount of time-series data. | Operations (is faster). Computationally efficient. Can be used in real time with large masses of tick data. |
Finally, grey wave curve prediction and projections have emerged as the latest variation of projecting cycle waves with financial and price data. Chen Keja and Zhang Qishen at Fuzhou University in Fuzhou, China are pioneering work with economic cycle prediction using the new method of grey wave analysis. These researchers developed a methodology for curve prediction that worked very accurately with Chinese economic survey data.[21]
We can conclude that the next generation of cycle indicators will generate exciting tools for use with all data and chart forms.
[21] Chen Keja and Zhang Qishen, Grey Systems and Intelligent Services. IEEE International Conference on Grey Systems and Intelligent Services. Nanjing, China, November 2007, 693–695.