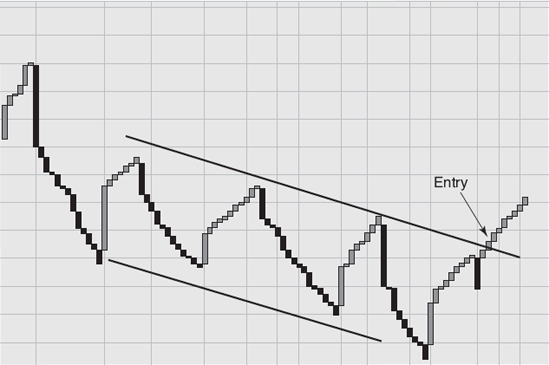
When a channel pattern appears in price data, it merits serious attention. Channel patterns show a persistence of sentiment in a unique way. Traders will notice that prices change within a channel. We can see in Figure 5.1 that the price repeats a regular pattern of swings from high to low and low to high. We can therefore understand that channel patterns are really a form of cycles. This means that traders, when observing a channel pattern, should try to confirm whether there is a cycle embedded in the pattern. Let's explore some further concepts underlying cycles. We will explore cycles with more depth in Chapter 13.
Note
As we know, the economy does not develop steadily and directly. In fact, it rises in cycles, that is, with expansion and contraction, or prosperity and slack, by turns. ... In order to effectively monitor and early-warn the macro economy, the economic cycle should be carefully examined.[6]
Cycles exist and express themselves everywhere. The lunar cycle is the most famous cycle, and is an almost perfect example of a pattern that we can accurately project into the future. We cannot project financial and market data with the same accuracy as a lunar cycle. It is still valid to investigate whether a cycle exists in the data, even if that cycle is not apparent. There should be no doubt that cycles are present in financial data. Some market data is very strongly cyclical and robust, while other market data can have intermittent cycles.
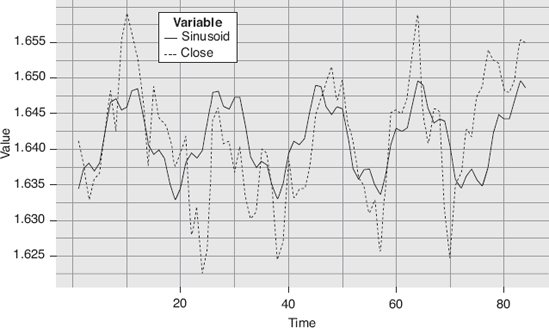
The persistence of embedded cycles in financial time series can be seen in Figure 5.2, which is a following chart of the currency pair GBPUSD showing four-hour candles. We see a cycle duration period of seventy-two hours between peaks or troughs. The cycle is a fitted curve represented by the equation: Y = 1.641 – 0.006*sin(2*pi*0.055*t) – 0.002*cos(2*pi*0.055*t) – 0.002*cos(2*pi*0.21*t).
If a trader or investor observes a cycle pattern, it is a strong leading indicator for projecting future tops and bottoms. It is a leading indicator because the cycle component of the channel pattern or trend can be separated from the data and projected out. The first challenge the trader faces is not to ignore the possibility that the pattern he observes, whether it is a sideways, uptrend, or downtrend pattern, may very well have a cycle component. This is where price break charts become important. Price break charts, by representing a reversal of consecutive highs or lows, can be used to help confirm whether a cycle has reached a turning point. A trader who combines cycle understanding and price break reversals has a powerful new tool for timing the market.
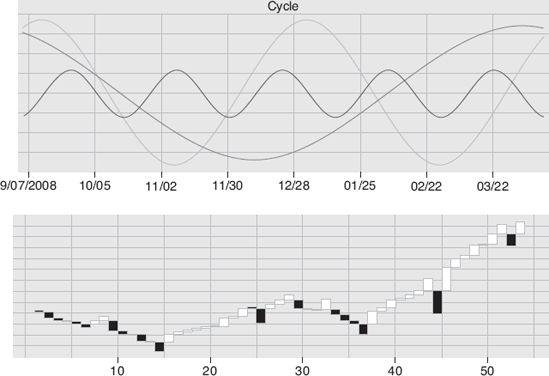
The combination of price break charts and cycles enables powerful new levels of confirmation. For example, the trader would look for cycle turning points coinciding with price break reversals or channel tops or bottoms. Notice how on November 2 and February 22, the cycle bottom coincided with a reversal up in the price break chart of the four-hour GBPUSD in Figure 5.3.
Where there is a coincidence of price breaks with cyclical turning points, the trade has very strong confirmation for a top or a bottom. The best approach is to start with raw price data and generate a chart. It can be a line or candlestick type, depending on the use of the chart. Survey data and economic data would be line data, because they have no open, high, low, or close. Price data would be candlestick data because it reflects trading behavior.
We can then generate a price break chart that transforms the data into points of consecutive new highs or consecutive new lows and reversals. We want to know if the reversals are co-aligned with a projected cycle turning point. This combination of price breaks and cycle or channel patterns takes price break charting to a new level of use. If the price break charts coincide with the data, we have unprecedented confirmation that a break in the trend or a projected price break reversal coincides with a peak or valley in a cycle that the price is in.
The question is, how can the average trader use this approach?
Several types of software for detecting if a data series exhibits cycle behavior are now available. In the coming years, many cycle indicators will be forthcoming as cycle science improves with new techniques of detection. A more detailed analysis of the cycle indicator is the subject of Chapter 13.
[6] Proceedings of 2007 IEEE International Conference on Grey Systems and Intelligent Services, November 18–20, 2007, Nanjing, China.