
Chapter 16
Pricing with Discounts
 In-a-Rush Tip
Discounts: A Double-Edged Sword
Psychologically, we all love discounts—poor and wealthy alike. We like to think we’re getting a deal. That we’re lucky. Or that we’re a smart shopper.
Discounts almost always increase unit sales. The “almost” reflects big questions about when you have a premium-quality product or when consumers have little method other than price by which to judge your quality—and quality is extremely important to them.
So should you offer them? It depends. Remember when I said what people hate about marketers is our answer to everything is to test it? Well, that’s the correct answer here.
If you don’t test the effect of discounts, you may be throwing away a lot of money. You’ll see in some of the research that follows that:
- Discounts can worry consumers enough that they’ll reject your product/service.
- You may get no more sales from a 40 percent discount than a 30 percent discount. Or you may get no more sales from a 30 percent discount than a 20 percent discount. (Or you might!)
- The discounts your consumers will respond to most will be different depending on:
- Your industry
- Your competitors
- Whether you are a known brand or not
- The age of your target customers
- The income levels of your target customers
When Discounts Worry Consumers
We all want the biggest discounts we can get. Correct? Not really!
Dr. Ron Drozdenko and I did a research study where we asked consumers to tell us the maximum discount they would accept(!) for eight different products. Their choices were 10 percent up to 80 percent.
We were stunned to find just 13 percent of respondents accepted the highest discount (80 percent) for every product category. Further, in none of the eight different product categories did more than 42 percent of respondents select the highest discount.
This is especially eye-opening since these were not discounts from some hypothetical list price; our research showed buyers the exact dollar price reductions they would get at each level for each product.
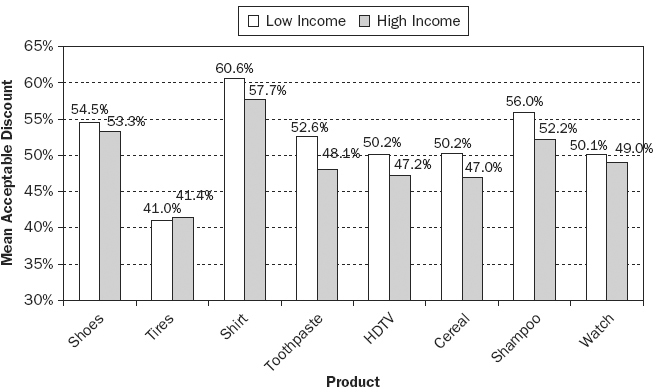
Exhibit 16.1 shows the average results by product. Notice how surprisingly close to 50 percent the average preferred discount is. Tires had the lowest acceptable maximum discount (40 percent average). Buyers were probably worried about poor quality tires, since their personal safety is at risk.
EXHIBIT 16.1 Overall Product Differences
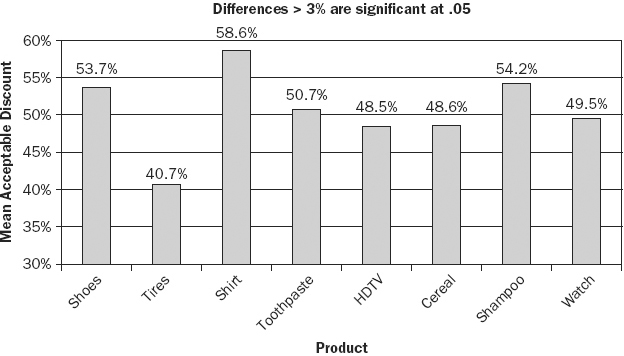
An HDTV (48.5 percent average) and cereal (48.6 percent average) were the products with the next lowest acceptable maximum discounts. With so much to save in a high priced (list $3,833 in the study) product, we expected buyers to go for much bigger discounts. But if the HDTV were to be poor quality, it would be a very poor, upsetting purchase they’d be stuck with for a long time.
When considering the buyer caution with cereal, we theorized a discount of greater than 49 percent might signal a potential risk of spoiled, old, or non-palatable food.
The shirt (59 percent average) had the highest acceptable maximum discount. Buyers are accustomed to the easy return of unsatisfactory clothing, so they may have perceived little risk if the quality was unsatisfactory.
Shampoo (54 percent average) received the second highest maximum acceptable discount. It appears buyers see a relatively low risk in purchasing and using shampoo. The price is relatively low, and if they don’t like it they can trash it and purchase something else. See Exhibit 16.1.
Exhibits 16.2 and 16.3 show the percentage of people preferring each different level for each product. The first is for an online sale and the second is for a local retailer.
EXHIBIT 16.2 Percentage Indicating Specific Maximum Discount Levels for Online Products
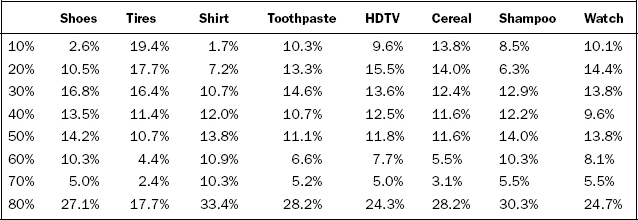
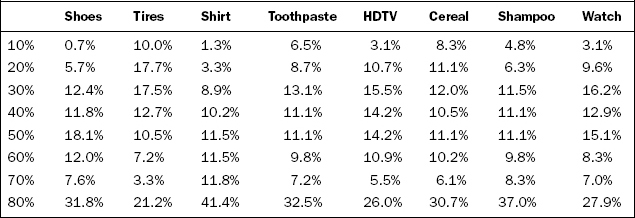
EXHIBIT 16.3 Percentage Indicating Specific Maximum Discount Levels for Products from a Local Retailer
For online shopping, it’s interesting to note the following:
- A 10-percent discount doesn’t excite much—except for tires.
- A surprisingly uniform number of people prefer 20 percent, 30 percent, 40 percent, and 50 percent as a discount.
- After 50 percent, you’re reaching bargain shoppers who want the maximum.
If the products were being sold in a local store, people wanted a slightly higher discount level. This tells us the local store is offsetting some of the risk customers see with higher discounts and with online shopping.
Comparing these two situations, it’s obvious that online retailers carry more risk in people’s minds as to the quality of products being sold.
We also wondered if there were gender, age, or income differences. We found some differences between males and females, but not enough to be statistically significant. Age, however, was significant. Younger consumers reacted more positively to higher discounts, as did those with lower incomes. See Exhibits 16.4 and 16.5.
EXHIBIT 16.4 Age Differences
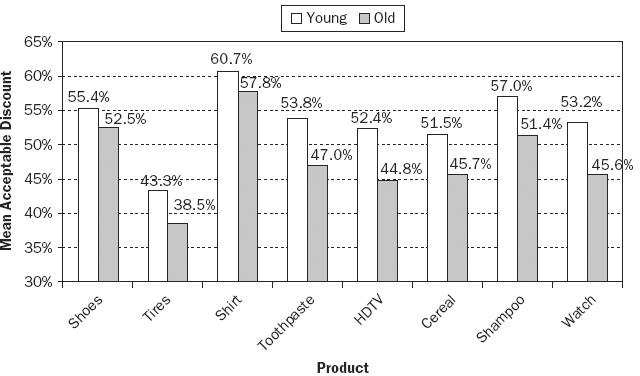
EXHIBIT 16.5 Income Differences
What Worries Consumers about Discounts
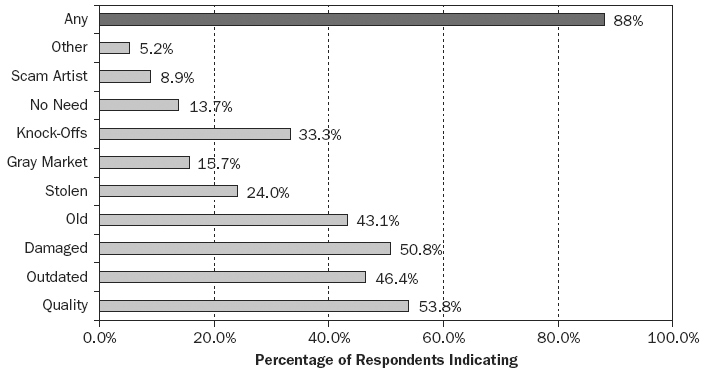
So why would only 13 percent of consumers accept the highest discounts? We asked them that question. Exhibit 16.6 shows the answers they gave. You can see from several of the reasons that consumers expect a product at an 80 percent discount to be inferior (knockoffs, old, damaged, outdated, and bad quality):
EXHIBIT 16.6 Reasons for Not Taking the Maximum Discount
What Other Studies Say
A number of studies have looked at consumer responses to discounts, with, unfortunately, contradictory results. Here is a summary of several of their findings, in the hopes at least one or two may give you some ideas more specific to your industry and situation.
- Mobley, Bearden, and Teel (1988) found a positive response to 25 percent discounts, and a more positive response to 50 percent discounts.
- Marshall and Leng (2002) found the same for product sales. For products, consumers showed a greater intent to buy at each discount step (from 10 percent to 50 percent in 10-point increments). At higher levels (moving to a 60 percent or 70 percent discount), they found no significant increase in intent to buy.
- For the sales of services, however, Marshall and Leng found that 40–70 percent discounts were perceived no more positively than 20 percent discounts, while 30 percent garnered the most intent to buy.
- Madan and Suri (2001) found 61 percent of consumers preferred a price presented as a 30 percent discount from list—over the same price without any perceived discount. However, when the authors presented a discount of 2 percent or 45 percent, they found consumers preferred the non-discounted price (at 61 percent and 75 percent, respectively).
- Moore and Olshavsky (1989) found discounts positive at all levels for name brands, but negative at the highest levels (75 percent) for unknown brands.
- Gupta and Cooper (1992) looked at intent to buy at different discount levels for name brands and for store brands, and found intent to buy was uniformly lower for store brands, even when those stores were name department stores.
- They also found consumer intent to buy rose at each discount level from 10 percent to 70 percent for name brands, but dipped in the 40 percent and 50 percent levels for store brands.
- They also found that 10 percent and 20 percent discount levels for store brands had little positive effect.
Determining Best Discount Levels
Discounts signal to buyers at least two things: They can save money but there may be some problem with the product/service (especially if the discount is larger).
Buyers often will accept an older model, factory second, last year’s style, an unknown retailer, etc. for a lower price. However, while this tradeoff may be acceptable for some products like clothing, is it acceptable for other products that may have safety or other types of risks?
Almost all research shows consumers are more likely to buy if there is at least some discount. This leaves marketers with several questions:
The best way to determine your optimal discount levels is to systematically test alternatives. This is a normal, inexpensive, and ongoing process for direct marketers, who routinely test pricing and discount levels.
For on-ground establishments, marketers may use matched geographic test markets or simulated test markets to set prices. Or they may hire outside pricing consultants.
Department stores (usually for fashion) and a few “off-price” retailers use progressive discounts dependent on the time the product is on the shelf. Discounts increase as the time on the shelf increases. Thus a product that hasn’t sold in 15 days may see a 5 percent discount; 30 days a 10 percent discount; 45 days a 20 percent discount; etc. This discount method can minimize losses by using the market response to specific products to determine their real value to consumers.
However, with time pressures to increase sales, marketers often use less-systematic methods to determine discounts. Discounts may be set based on industry convention, competitive response, or historical precedence. Using these unscientific methods of setting discounts may cause least two problems:
Discounts’ Effect on Quality Ratings and Purchase
Because of concerns about how different discount levels affect not just quality perceptions—but actual purchase decisions—Dr. Ron Drozdenko and I conducted a different study. We looked at 15 percent, 30 percent, and 45 percent discount levels.
The top line of the graph in Exhibit 16.7 shows consumer perceptions of the quality of the product, based solely on the discount level. As you can see, there is no significant difference until you have a 45 percent discount, at which time the quality perception dropped.
EXHIBIT 16.7 PURCHASE INTENT AND QUALITY PERCEPTIONS AT DIFFERENT DISCOUNTS
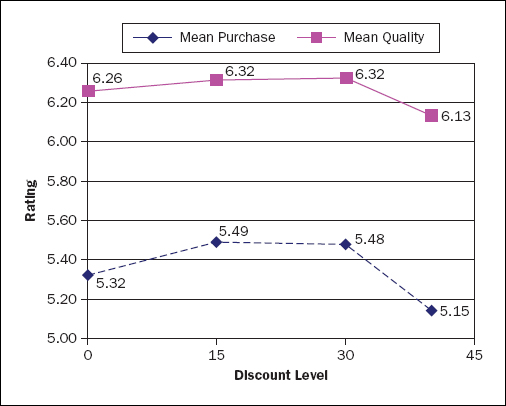
The average intent to purchase the product went up when there was a 15 percent or 30 percent discount (although no difference in intent between those two), then dropped significantly at a 45 percent discount level.
While the research is contradictory on this, I’d recommend anyone offering mid-level discounts (20–35 percent) see if a lower level (e.g., changing a 35 percent discount to 25 percent, or changing 25 percent to 20 percent) wouldn’t pull in just as many buyers. See Exhibit 16.7.
We offered consumers these discounts on five product categories, and used a brand name and an unknown brand for each product category (10 products total). As you can see from Exhibit 16.8, the known brand peaked at a 30 percent discount for both quality perception and purchase intention of consumers. The unknown brand peaked at a 15 percent discount level.
EXHIBIT 16.8 KNOWN VS. UNKNOWN BRANDS
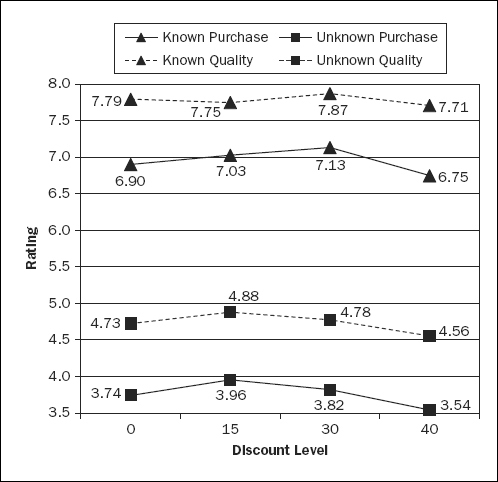
Note that the two upper (triangle) lines show a known brand—the top is the quality rating and just under it the purchase intention rating. The two lower (box) lines show the unknown brand.
There were also differences by product category. For example, purchase probability decreased from the 30 percent to the 40 percent discount for seven of the ten products:
- Both the known and unknown toothpaste
- Both the known and unknown yogurt
- Both the known and unknown tire
- The unknown brand only of vodka
For ABSOLUT vodka (the known brand), the discount level did not have a significant effect on purchase probability.
Concluding Thoughts on Pricing, and Especially on Testing Prices
You may believe because you hear little in the business press about price testing that not too many companies do it. But the lack of articles on the topic reflects how closed mouthed companies are about the topic—not how much of it is or isn’t happening.
I found that out firsthand when I tried to launch a pricing forum on my PricingStrategyResources.com web site. It got twice as much traffic as the entire site had before, but I couldn’t get anyone other than me to post pricing strategy, results, or ideas. Companies that understand pricing see that as a competitive advantage, and they seldom talk about it.
Non-marketers get very annoyed with us marketers, when our answer to most promotional ideas is: “I don’t know. Let’s test it!” But testing is truly the only way to know for sure which price will prove most profitable.
In this book, I’ve given you my insights and recommendations, based on more than two decades of pricing products and services, and testing prices. But whether they will work in your specific situation, neither you nor I can know for sure without you doing your own testing.