
Chapter 14
Pricing New Products/Services, Part 1
When Your Brand Is Unknown
 In-a-Rush Tip
The Problems in Pricing Something New
Pricing a completely new product or service adds many layers of complexity onto an already difficult pricing decision. For example:
- You’re competing against known brands (for more on how, see Chapter 15!).
- Buyers don’t know your quality.
- Buyers don’t have any “feelings” toward your brand.
- Buyers are (most likely) reasonably happy with the brand they’ve already bought.
- You’ll be tempted to undercut your lowest-priced competitor as a reason for buyers to try your brand.
When buyers don’t know anything about your brand, they use your price as a strong indication of quality.
Price Equals Quality Buyer Perception
A large number of research studies show that buyers see a relationship between the price of something and its quality.
It is especially true in studies where price is the only difference that can be easily perceived by the consumer.
Attribution theory, originally developed by Heider (1958), states that people infer causation for behaviors. Applying this to a new-product pricing, buyers are likely to attribute causes for a company putting a lower or higher price on its product than is on competitive products.
According to Lichtenstein, Burton, and O’Hara (1989), who tested 34 different attributions as to why a discount was given, consumer attributions fall into three categories, one of which is attributions due to the product.
In other words, they may assume the reason you priced your product so low is because you know the quality is poor. Or they may assume the reason you priced your product so high is because you know it is higher quality than competitive products.
In 2005, Dr. Ron Drozdenko (marketing chair at Western Connecticut State University) and I allowed consumers to select the maximum discount level they preferred for their favorite brands in each of eight different product categories. Just 13 percent of consumers took the deepest discount on all products.
We then asked consumers to indicate reasons why they didn’t select the largest discount. Here are their reasons, with the frequency of their being cited by consumers:
- Poor quality (54 percent)
- Damaged goods (51 percent)
- Outdated goods (46 percent)
- Old goods (43 percent)
- Knock-offs (33 percent)
- Stolen goods (24 percent)
- Gray market (16 percent)
Does Quality Equal Likelihood-to-Buy?
A higher quality perception doesn’t necessarily mean more people are likely to buy it. Petroshius and Monroe (1987) researched products in a product-line offering.
For example, assume buyers see four different inkjet printers from a company:
- $169
- $149
- $129
- $99
This research found that buyers perceive the quality of each of the models to directly correspond to the price (i.e., the $169 printer is the best quality and the $99 is the worst).
But when they asked which was the best value, buyers said it was the $99 model. And when they asked which of the four a buyer would be most likely to buy, they found it to be the lower two price positions.
You need to ask yourself how important quality is to consumers of your product or service—and whether they find current brands lacking. Remember the soap example: While people may agree your soap is 10 percent better quality, almost nobody cares enough to pay a price premium. What they have is good enough, in their perception.
And their perception equals your reality.
Understanding “Bargain Hunters”
There is a group of consumers in the United States (and probably in other countries) who are full-time bargain hunters. They have no loyalty to a brand and will switch instantly to whoever offers the lowest price. These bargain hunters were identified as early as 1966, when a research study on quality (Gabor and Granger) found a sub-group of bargain shoppers who did not conform to their study’s findings. While most consumers in their study were more likely to buy at moderate or low-moderate prices, the researchers found a subset who were not deterred by low prices and who would accept even a ridiculously cheap offer.
These brand switchers seem motivated more by the thrill of the deal than by trying to avoid paying more than necessary. They seem to care more about bragging rights for how little they spent than worrying about the quality of what they buy. Various researchers have pegged this group as comprising anywhere from 15 to 25 percent of shoppers.
This means that if you have the lowest price, you will instantly appeal to those in this group who plan to buy your type of product. But the second another company offers even a few cents less, they will jump to that product.
If you have lower costs than your competitors, this group will love you. And you’ll love them.
If you don’t have lower costs than your competitors, then it will hurt your profits to try to sell to this group.
Price Preferences by Product Type
Beyond the bargain-hunter personality, other consumers usually restrict bargain shopping to products that aren’t important to them. For example Lambert (1972) did an interesting study using only fictitious brands—those that don’t exist. The reason for this was to remove any influence from name brands. He offered buyers three choices of products where the only difference was the price, and he tested seven different product categories. Here’s what he found:
- Products where consumers selected the cheapest option included toothpaste, coffee, and suntan lotion.
- Products where consumers selected the middle price included tape recorders and molded luggage.
- Products where consumers selected the highest price included portable stereos and tennis racquets.
Lambert concluded that price preferences (in the absence of brand names) were not always for the lowest price and that they were product-specific.
The research also looked at whether buyers experienced in a particular product category were more likely to buy the cheapest choice. Lambert found instead they were more likely to purchase the highest-priced option. This could be biased, as those who rate themselves experienced buyers of, say, tennis racquets are likely to play a lot of tennis and may then prefer a better quality product—which they hope to secure through the higher price.
Detailed Research on Buyer Price Position Preferences
Exhibit 14.1 shows the results of a research study Dr. Ron Drozdenko and I did on the attractiveness of specific price positions for a new product—when brand names were not a factor. We researched 12 different products and offered five different price choices for each.
EXHIBIT 14.1 Mean Results for Each Price Level

For example, for a long-sleeve, 100 percent cotton shirt with collar, the price choices were:
- Low ($9)
- Low/middle ($27)
- Middle ($45)
- High/middle ($62)
- High ($79)
Exhibit 14.1 shows the results over all 12 product types.
Here is some of the intelligence we can get from this study:
- If so, then why launch with the lower profits you’d get from the cheapest price position?
- If so, then why launch at low/middle? Why not instead get the higher profits from the middle position?
Because other research has shown price preferences can differ by the type of product, we then broke out the results by product type. Exhibit 14.2 shows what we found.
EXHIBIT 14.2 Comparative Price Attractiveness by Product

What can we learn from Exhibit 14.2? Products for which the cheapest price is most attractive included watches and shirts. In both these categories, not only was the lowest-priced option most attractive, but the highest-priced option was least attractive.
Products for which the middle price is most attractive included:
- MP3 player
- Deodorant
- Shoes
- Toothpaste
- Cereal
- Tires
What can we make of consumer preference to pay the middle-of-the-road price for these products instead of a thriftier price?
- First, we must recognize that for deodorant, toothpaste, and cereal the out-of-pocket costs are slight, so upgrading doesn’t require as much cash for these products as for some others.
- Deodorant carries a social risk if the product doesn’t work, so spending a few more cents for a better-quality deodorant may provide ease of mind.
- The most likely reason for the MP3 player, shoes, toothpaste, and cereal is that consumers have tried cheap brands and found them unsatisfactory. Thus most of these consumers are likely to avoid the cheapest brands in the future.
- Tires carry a physical safety risk. If a tire blows on a freeway, the result could be your life—or at least some physical harm. In that situation, more people seek higher quality, even though the additional cost is substantial.
NoteAdditional Research on Preferred Prices
Because this research could be critical for pricing new products, I replicated it for four products in a separate study. Replicating research is one way we test it to make sure the research is valid. The new research verified the results and also offered some new insights.
If you’ve studied economics in college (or even in high school) you were probably told about a demand curve. This purports to show how demand drops as price rises. It typically looks something like the figure in Exhibit 14.3.
EXHIBIT 14.3 Generalized Demand Curve

Exhibit 14.4 shows the results of the four retested price preferences plotted as demand curves. You’ll see the plotted line of the shirt/blouse comes closest to a traditional demand curve, while the other products are very different:
EXHIBIT 14.4 Likelihood-to-Buy at Different Price Positions by Product

- HDTVs show a small drop at each price increment.
- Vitamins are preferred at the second-from-lowest price level.
- Tires are preferred at the middle level.
Another interesting way to look at this research is to break out the products so we see how diverse the demand is at each level. Note in Exhibit 14.5 that the widest diversity in price preferences is seen for the shirt/blouse. This means a change in price—either up or down—can make a huge difference in demand.
EXHIBIT 14.5 Preferred Price Level by Product Category

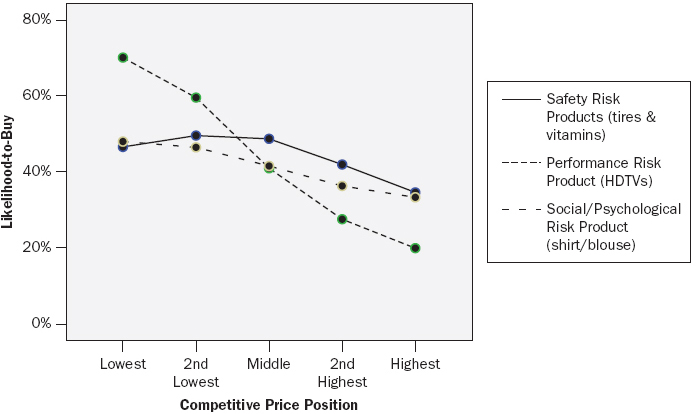
Finally, I looked at the products by the type of risk they carried if a person bought the cheapest one and it didn’t work well.
What stood out is consumer sensitivity to a safety/physical risk (see Exhibit 14.6). More consumers preferred the middle or second-highest price levels for the two safety-risk products than they did for the HDTVs.
EXHIBIT 14.6 Preferred Price Position by Product and Risk Type
Learn More about Risk and Pricing
Dowling (1986) identified aspects of risk theory, including:
In a study of three consumer electronics products (a TV, a stereo, and a camera) Peterson and Wilson (1985) found the higher the price, the less perceived performance risk in consumer perceptions.
Grewal, Gotlieb, and Marmorstein (1994) recommended new brands introduced at lower-than-competitive prices use a highly credible spokesperson to offset an otherwise likely perception of increased performance risk.
This potential use of risk to justify high prices was developed by Bettman (1973). He recommended marketers with high-priced products emphasize the risks of their product category while also stressing the quality of their own brands.
Looking at risk—without looking at it specifically by product—may underestimate its effect in consumer reactions to price. This is consistent with the theory of risk taking in consumer behavior proposed by Taylor (1974). Taylor noted that research must be purchase specific, and that it may be difficult or impossible to generalize across studies with different products.
Tellis (1988) also found a correlation between risk perception and optimal prices or discounts.
Of course, most new products or services have direct competitors—usually with established brand names. The next chapter looks at competing against established brands.