2. Five Simple Questions
“I’ve missed more than 9,000 shots in my career. I’ve lost almost 300 games. 26 times, I’ve been trusted to take the game winning shot and missed. I’ve failed over and over and over again in my life. And that is why I succeed.”1
—Michael Jordan
A trader must ask five simple questions about every potential trading catalyst or market shock:
A sixth question might also be added: Will the price action in one market affect prices in other markets? Asking the questions is easy. Finding the answers might not be, as the following real-life trading examples show.
Which Market(s)?
Identifying the best trades entails determining which market will have the greatest response to a shock. The answer isn’t always obvious.
The death of North Korean leader Kim Jong-Il in December 2011 sparked a flight to safety to the U.S. dollar and a sell-off in the South Korean stock market and the South Korean currency, the won.2 The decline in the won was immediate, along with an even larger percentage decline in South Korean equities. Interestingly, the Financial Times noted that the initial decline in equities was overdone and gold actually declined in price.
“...The won...fell more than 1 per cent...The Kospi index deepened losses by more than 2 percent ...Gold...was down 0.3 percent....”3
Deciding which assets will move in response to a shock is sometimes difficult even when the shock precipitates a flight to quality or safety. Buying gold in this instance would have been a losing trade even though it is considered a safe haven asset.
Sometimes even the pros get it wrong. This is illustrated in an interesting case discussed in detail in Webb [2007] and briefly recounted here.4 On October 31, 2001, the U.S. Treasury Department announced at a nonpublic quarterly refunding press conference that it was discontinuing the issuance of the long bond—the 30-year Treasury bond. The information was embargoed until 10:00 a.m. to allow the assembled reporters time to write their stories and release the information to the public at one time. One of the “reporters” was actually a consultant, Peter J. Davis, who passed on the information to his clients at various financial firms. One of his clients, John M. Youngdahl, worked as an economist at Goldman Sachs and had retained the services of this consultant without the knowledge or approval of his superiors at the firm. After the Treasury nonpublic press conference ended around 9:25 a.m., the consultant relayed the information to his client at Goldman Sachs who, in turn, passed it on to bond traders at Goldman Sachs without revealing that the information was illegally obtained inside information. The bond traders knew that the price of bonds should rise with the perceived future shortage of supply. Their trading decisions are instructive and are indicated in a U.S. Justice Department indictment of the individuals involved, which stated:
“...At approximately 9:35 A.M., and in violation of the embargo, DAVIS telephoned YOUNGDAHL and informed YOUNGDAHL that the Treasury Department had announced that it was suspending the issuance of 30-Year Treasury Bonds and that this information was subject to a 10:00 A.M. embargo. YOUNGDAHL, in turn, tipped several traders at Goldman Sachs who, while in possession of this information, purchased approximately $84 million in 30-Year Treasury Bonds and approximately $233.6 million in 30-Year Treasury Bond futures contracts [i.e., 2,336 contracts] before the public release of this information. Treasury’s decision to suspend issuance of the 30-Year Treasury Bond sparked one of the biggest single-day rallies in the history of the United States bond market. Although the Treasury Department inadvertently released this information at approximately 9:43 A.M., shortly before the scheduled 10:00 A.M. release time, according to the Indictment, Goldman earned approximately $3.8 million from its trading that morning....”5
Succinctly stated, the traders at Goldman Sachs placed two big bets on U.S. Treasury bonds—one in the cash market and one in the bond futures market. The cash market bond bet was about one-third the size of the futures bet. It would seem that the professional traders at Goldman Sachs thought that they would get more bang for the buck with the futures market bet than the cash market bet (or that a larger cash market bet might move the market against them and cut into profits). However, the bond futures market was the wrong market to place the bet in this case.
Although Treasury bond futures contracts are a proxy for cash market Treasury bonds, the design of the contract allows Treasury securities with remaining maturities of 15 years or more to be delivered at the option of the seller. The rational seller will always deliver the cheapest eligible Treasury security. This means that holders of U.S. Treasury bond futures contracts would not be delivered 30-year Treasury bonds but Treasury securities with shorter maturities. The bottom line was that the Treasury bond futures contract, which tracked the cheapest to deliver Treasury security, did not rally as much as cash market Treasury bonds did.
The bond traders at Goldman also misjudged the length of the ensuing rally as Goldman exited its cash and futures market bond positions too early. That is, they failed to answer the “how long?” question correctly. The excerpt noted: “Treasury’s decision to suspend issuance of the 30-Year Treasury Bond sparked one of the biggest single-day rallies in the history of the United States bond market.” However, the rally disproportionately impacted long-dated Treasury securities. The December 2001 Treasury Bond futures contract traded on the Chicago Board of Trade closed up 1 25/32 or $1,781.25 over the previous day’s close. The on-the-run 30-year Treasury bond closed up 5 1/4 points for the day. Simply put, a $100 million investment in 30-year Treasury bonds would have closed up $5.25 million over the previous day, whereas a similar sized position in the Treasury bond futures market would have been up $1.78125 million. The choice of which market to place your bet matters, as does the holding period.
This episode illustrates a problem that every trader faces with a winning trade: determining when to get out. Like most everyone else in the market, the bond traders at Goldman Sachs didn’t know that the Treasury’s decision would precipitate such a massive rally. So they cut their profits short. Goldman did not get to keep the illegal profits. They forfeited the illegal profits and paid a $5 million fine in a settlement with the SEC.6
One last point deserves mention, and that is that the inadvertent premature posting of the Treasury’s decision provided traders monitoring the Treasury website with an advantage over those who waited for the news to be released by news organizations. Although relatively rare, instances of premature postings of other announcements have occurred. This means that sometimes tradable information might be available sooner than most traders expect. Given that traders know both the date and the expected release time of government announcements, monitoring the government agency website if you are trading off information in those announcements may pay off.
Which Direction?
The answer to the question of, “Which direction?” prices will move in response to a shock also seems like it should be obvious, but it isn’t always the case. Sometimes, seemingly good news results in sell-offs and what appears to be bad news results in rallies. Sometimes the direction an asset takes is more dependent on overall market sentiment than asset-specific news. Direction is influenced by market sentiment as well as the reactions of similar securities to news. For instance, Zynga, which derived much of its revenue from games on Facebook’s platform, announced its second-quarter (Q2) 2012 results and got crushed; Facebook did the same the next day and its stock also got crushed. Zynga announced its mediocre Q3 2012 results and its stock price soared—Facebook did the same the next day and its stock price soared. These correlations are usually not permanent, but offer savvy traders clues to determine market direction.
Bear Stearns
On the morning of Friday, March 14, 2008, JP Morgan Chase announced that it, in concert with the Federal Reserve Bank of New York, had arranged $30 billion in financing for Bear Stearns Companies (BSC). The apparent objective of the announcement was to reassure market participants that Bear would be able to obtain the necessary financing to remain in business.7
Like many investment banks, Bear Stearns made a market in Treasury securities and mortgage-backed securities. Bear funded its position by borrowing short term, usually overnight in the repo (repurchase agreement or collateralized loan) market.8 The rates were low because the loans were secured by U.S. Treasury securities. Also, little equity had to be posted, meaning banks could borrow almost the entire value of the securities posted.9 If long maturity rates exceeded short rates—the case when the yield curve is upward sloping—the strategy made money from positive carry. Simply stated, Bear would earn more from its holdings of Treasury securities than it would cost to finance if security prices remained unchanged. This strategy worked well under most conditions but exposed the bank to risk when short rates exceeded long rates or when the bank was perceived as a poor credit risk and was unable to borrow in the repo market. Put differently, Bear was exposed to the risk that a sudden loss of confidence in its financial soundness would make financing its activities difficult, if not impossible.
Rumors swirled around the market about Bear’s financial viability in early 2008. Despite repeated attempts by management to reassure investors that Bear was financially sound, the rumors came to a head on Thursday evening, March 13, 2008, when Bear was unable to borrow sufficient funds in the repo market to finance its massive security position. The failure of Bear to obtain financing was tantamount to a “run on the bank.” Bear turned to the Federal Reserve Bank of New York for help. The Fed believed that it did not have the authority to lend directly to investment banks like Bear Stearns and arranged for JP Morgan Chase—a commercial bank that it regulated—to serve as the conduit for financing to Bear. The Fed’s interpretation of its powers would change a few days later, but too late to save Bear and to avoid the substantial collateral damage that a forced sale of Bear would cause to the overall market.
The announcement was made around 9:13 a.m., before the 9:30 opening of the New York Stock Exchange.10 Bear Stearns’ stock was trading in Frankfurt and over the counter at the time of the announcement. Suppose you were trading stock at that time. Would you buy or sell Bear? Remember that it had traded at more than $170 per share slightly more than a year before. Where would you set your stop? (That is, how much of a loss would you be willing to suffer before covering your position?) After all, you want to be able to trade again if you are wrong. There is no glory in suffering a lot of pain. Bear closed at around $57 per share on Thursday night and was trading in the mid-fifties prior to the announcement.
In retrospect, knowing that Bear Stearns failed, it seems easy to say that you should have sold Bear and held the short position open until Bear collapsed. However, you wouldn’t have known that at the time. Rather, you have to determine how to profit from this opportunity while taking limited risks. So, would you buy or sell Bear? How much? How would you size your position? (That is, how large of a position would you take?) How long would you expect to hold your position?
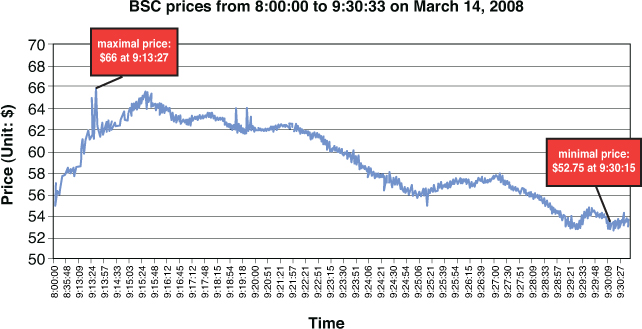
So, what happened? Within moments of the announcement, Bear reached a momentary high of $66.00 at 9:13:27, or almost 13% higher than its 9:13:06 price of $58.50 and substantially higher still than its 8:00 price, shown in Table 2-1. At first glance, this reaction seems to confirm the notion of market efficiency because prices quickly responded to the new information about Bear’s access to financing. However, Bear fell and then rallied to $65.48 around 9:15:33 before falling again. Bear fell to $52.92 around 9:29:30 before rising to $54.23 when the New York Stock Exchange (NYSE) opened. The impact of the announcement was short-lived.
Table 2-1. BSC Pre-Market Action: Friday March 14, 2008 (Selected Prices)
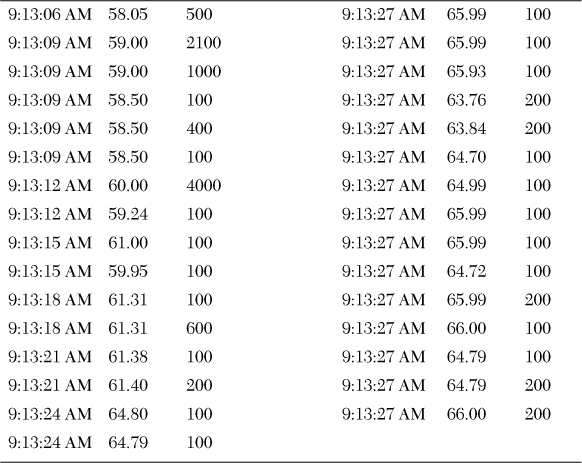
The behavior of BSC’s stock price from 8:00 to shortly after the New York Stock Exchange opened is depicted in Figure 2-1. The spike in price and the relatively short-lived rally after the announcement are immediately apparent. Figure 2-1 also shows a gradual rally in price before the announcement was made. The rally is also consistent with information leakage—the notion that the news might have leaked out and been traded on before the announcement was made to the public.
Figure 2-1. This chart depicts the behavior of Bear Stearns’ stock price from 8:00 a.m. to shortly after the NYSE opens at 9:30:00 on Friday, March 14, 2008. It includes the reaction of BSC stock price to the JP Morgan Chase financing announcement at 9:13 a.m.
So why did Bear rally on the announcement of the financial rescue plan by JP Morgan Chase? Was it a piece of good news in a sea of bad news about Bear? One possibility is that those who were short Bear stock started buying to cover their positions and pushed prices up. Another possibility is that traders misinterpreted the news. Perhaps they thought it was a rescue package rather than the prelude to a forced sale of Bear to JP Morgan Chase. Yet another possibility is that the market simply made a mistake.
BSC opened at $54.23, down almost three dollars from the previous close and down almost $12 from the high reached in pre-opening trading. By the time the NYSE opened at 9:30, it was clear that the announcement was not having the desired effect of calming concerns about Bear’s financial viability. Yet, there was plenty of time to short Bear. Bear continued to trade lower and was down over $12 more by 9:55:30 when it traded at $42. The real sell-off in Bear didn’t start until a few minutes before 10:00. By 10:00:51, it traded at $28.51 down over half from Thursday’s close.
Lehman (LEH), another investment bank plagued by rumors about its financial viability, moved somewhat with Bear in pre-opening trading, rising slightly with the JP Morgan Chase announcement to provide financing to Bear, and then falling slightly as Bear’s stock price fell. Lehman opened at $45.91 on the NYSE. Suppose you decided to short Lehman in the expectation that it and other stocks like Merrill Lynch—also rumored to have financial viability concerns—would fall given Bear’s likely further decline during the trading day. So how much time did you have in which to sell LEH before it fell and stayed below the opening price of $45.91? The answer: several minutes. By that time Bear Stearns was trading at $52.19 per share or down 7% from the opening price. As Bear started to decline, Lehman became more sensitive to (or highly correlated with) the decline in Bear’s stock price. Lehman hit its low of the day when Bear plummeted between 9:55 and 10:01.
Lehman took a big hit on Friday, March 14, 2008, but nowhere near the hit that Bear took. The real hit to Lehman would occur on St. Patrick’s Day after the forced sale of Bear Stearns to JP Morgan over the weekend for a reported $2 per share.11 The policy response to Bear’s funding difficulties precipitated a sell-off in financial markets on Monday, March 17, 2008, with Lehman Brothers and Merrill Lynch suffering large losses. Lehman fell to around $22 at one point before closing at $31 per share. However, the losses weren’t limited to investment banks. Policymakers were apparently completely unaware of the tremendous collateral damage that their action on Bear Stearns would cause. The Fed reversed course and decided that it could lend directly to investment banks. That decision precipitated a rally on Tuesday, March 18, 2008, with the Dow Jones Industrial Average closing up more than 420 points or 3.5%. It is interesting to speculate on what would have happened if the Fed had made the decision to lend directly to investment banks the week before. Bear Stearns need not have gone under, and a bank that was already too big to fail, JP Morgan Chase, need not have gotten even larger.
What are the trading lessons from this episode?
• The initial reaction might not be the final reaction. This makes stop-loss orders (whether mental or placed with a broker) an important component of trades.
• Good news in a downward trending market might not last very long. If you have a losing position in a down-trending market, selling on good news might be a good chance to exit.
• Betting on good news in a bear market (no pun intended) should have a short trade horizon.
• Opportunities might arise in related stocks, which might react more slowly to news specific to other companies as information cascades from one company to another. For instance, Lehman Brothers stock exhibited a seemingly delayed reaction to the news about Bear.
• The sensitivity of related companies to negative news specific to a given company increases with the size and speed of the decline in the company’s stock price.
• Not surprisingly, trades with greater opportunities for gain come with greater risk.
Finally, another bizarre dimension to the Bear Stearns saga involves trading in Bear puts. Bloomberg News reported on March 13, 2008, sharp increases occurred in both trading volume and the price of $25 and $40 strike put options on Bear Stearns stock expiring in less than a week. Given that Bear was trading in the $50s at the time, it would require a massive drop in the price of BSC stock for these puts to become profitable. The most actively traded puts on Bear were the $25 strike price puts, which according to Bloomberg News increased in price:
“...sixfold to 30 cents. For those wagers to pay off, the shares must drop by 59 percent...in the next five trading sessions....”12
The trading volume associated with these options wagers was huge. This means that a large amount of money was bet on the imminent collapse of BSC. Why large bets were placed on the imminent collapse of Bear Stearns is puzzling as such bets in most cases would be considered bad trades a priori absent additional information. The surprisingly large volume of trading in short-dated deep out-of-the-money BSC put options in the week before Bear collapsed is discussed in more detail in Chapter 10.
The Market Reacts to the Employment Report
Arguably, the most important periodic government economic report is the U.S. monthly employment situation report. Surprises from the report often impact the bond, currency, commodity, and stock markets.
At 8:30 a.m. on Friday, February 3, 2012, the Labor Department released the much-watched monthly employment situation report for January 2012. Traders typically focus on two numbers: new jobs created (nonfarm payrolls) and the unemployment rate. The reaction to the January 2012 U.S. employment report illustrates the confusion that traders sometimes have in determining which way a market should react to the news.
In the perverse world of bond trading, a slowing economy where fewer jobs are being created suggests falling interest rates and rising bond prices as the demand for credit falls. Conversely, an economy where more jobs are being created than expected suggests rising interest rates and falling bond prices. When the economy is strong, people would rather risk money in the stock market. When times are tough, they put their money in “safe” assets such as bonds. On February 3, 2012, the market responded to the news that substantially more jobs had been created during January 2012 than expected. The market’s response—stocks rose and bonds fell.
What was expected? The consensus expectations were that between 125,000 to 150,000 new jobs were created in January 2012 and that the unemployment rate would come in at 8.5%. What was reported? Instead, the Labor Department reported that 243,000 new jobs had been created in January 2012 and that the unemployment rate had fallen to 8.3%. The employment report was stronger than expected.
The report contained other information indicating that the economy was stronger than expected. This included greater labor force participation, higher earnings, upward revisions in nonfarm payrolls, and higher-than-expected private sector job creation.
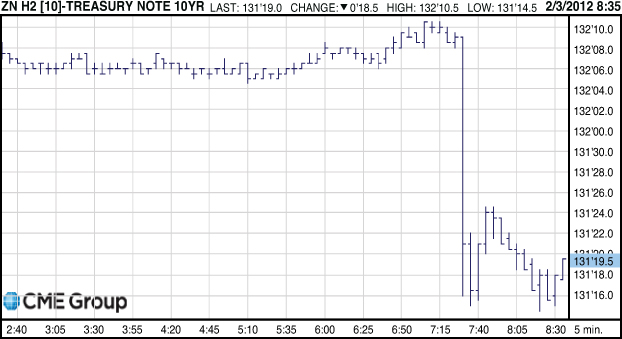
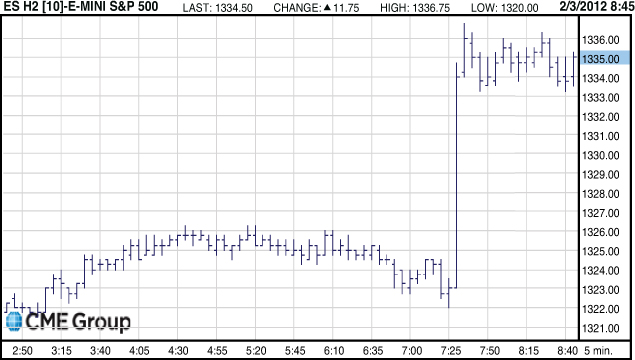
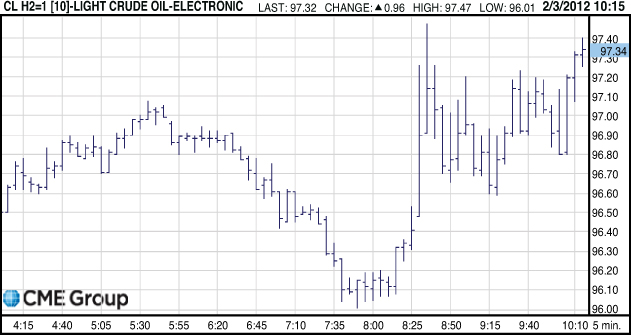
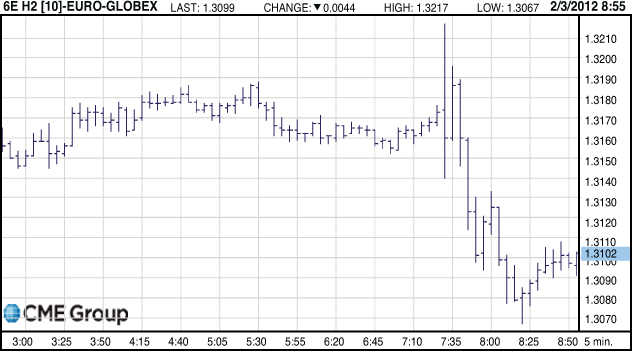
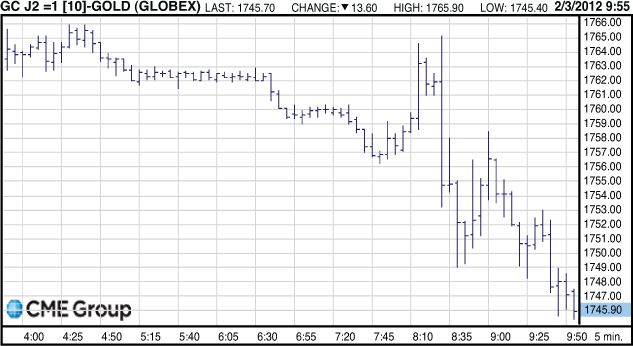
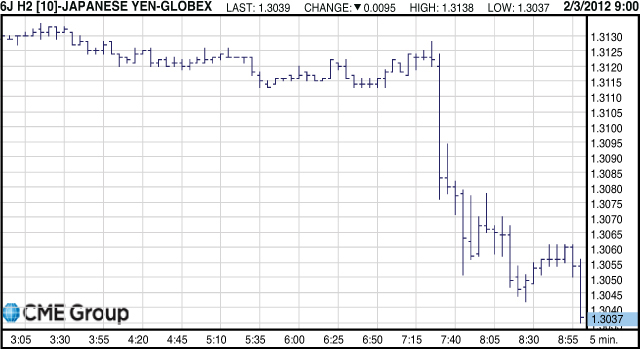
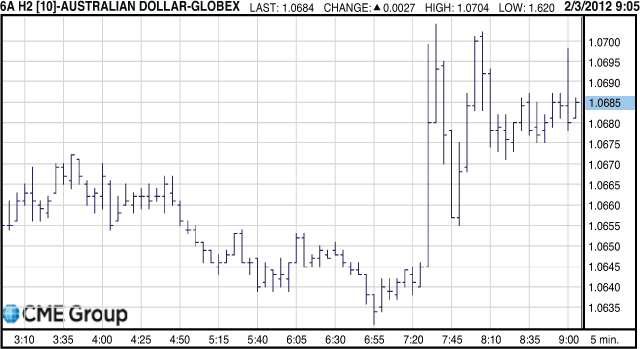
The Chicago Board of Trade (CBOT) March 2012 delivery 10-year Treasury note futures contract fell 25/64 or $390.625 per contract within the first four-tenths of a second. Within the first second, 2,252 trades occurred. The reaction of the 10-year Treasury note futures to the employment report is depicted in Figure 2-2. The reaction of the CME e-mini S&P 500 stock index, NYMEX crude oil, CME EuroFX, Japanese yen, Australian dollar, and NYMEX gold futures contracts are depicted in Figures 2-3, 2-4, 2-5, 2-6, 2-7, and 2-8. The charts are reprinted with permission of the CME Group (© CME Group. All rights reserved).
(Reprinted with permission of the CME Group.)
Figure 2-2. This chart depicts the reaction of March 2012 delivery CBOT 10-year U.S. Treasury Note futures prices to the January 2012 U.S. employment situation report. All times are Chicago times.
(Reprinted with permission of the CME Group.)
Figure 2-3. This chart depicts the reaction of March 2012 delivery CME E-mini S&P 500 Stock Index futures prices to the January 2012 U.S. employment situation report. All times are Chicago times.
(Reprinted with permission of the CME Group.)
Figure 2-4. This chart depicts the reaction of March 2012 delivery NYMEX WTI Crude Oil futures prices to the January 2012 U.S. employment situation report. All times are New York City times.
(Reprinted with permission of the CME Group.)
Figure 2-5. This chart depicts the reaction of March 2012 delivery CME EuroFX futures prices to the January 2012 U.S. employment situation report. All times are Chicago times.
(Reprinted with permission of the CME Group.)
Figure 2-6. This chart depicts the reaction of April 2012 delivery NYMEX Gold futures prices to the January 2012 U.S. employment situation report. All times are New York City times.
(Reprinted with permission of the CME Group.)
Figure 2-7. This chart depicts the reaction of March 2012 delivery CME Japanese Yen futures prices to the January 2012 U.S. employment situation report. All times are Chicago times.
(Reprinted with permission of the CME Group.)
Figure 2-8. This chart depicts the reaction of March 2012 delivery CME Australian Dollar futures prices to the January 2012 U.S. employment situation report. All times are Chicago times.
Figures 2-2 and 2-3 respectively show that ten-year Treasury note futures prices immediately fell and E-mini S&P 500 Stock Index futures prices immediately surged higher. These reactions are exactly what one would expect. NYMEX WTI (West Texas intermediate) crude oil futures prices also surged higher—presumably on expectations that a stronger economy would lead to increased fuel consumption. This is shown in Figure 2-4.
Many observers would argue that a stronger economy should lead to higher interest rates. Higher interest rates, in turn, should lead to a stronger dollar. Several currencies behaved a little differently. The British pound, euro, and Swiss franc all initially surged higher on this positive news on the U.S. economy (an unexpected move) before falling, as you would expect. The reaction of EuroFX futures prices to the report is shown in Figure 2-5. Gold, although not a currency, followed a similar pattern—but not in lockstep with the aforementioned currencies. This is shown in Figure 2-6. On the other hand, the Japanese yen behaved just as theory would suggest, and fell against the dollar with no temporary rise along the way as shown in Figure 2-7.
For the average trader, this discussion may seem academic. It’s not. You should care because you might be right about the overall trend (downward for the euro in this case) but get stopped out before you can make money on the move.
As a risk minimization strategy, putting on stops makes sense. If the employment report had turned out to be unexpectedly negative, a close stop on any appreciation of the pound or euro would make perfect sense. However, a stop set too close could end up killing your trade, even if you made the right prediction.
Not all currencies fell against the dollar in reaction to this report. The Australian dollar initially rose. This is what you might expect for a “commodity currency.” However, the Aussie dollar then fell most of the way back, then rose, then fell back to somewhere in between the exchange rate before the announcement and the post-surge rate. This is shown in Figure 2.8. Sometimes the reaction of the market to news is unpredictable and puzzling. That’s why you have to always be prepared and have a solid trading game plan.
“Which direction?” seems like a simple question, but it is not.
Trading Lessons
The direction of the price move for the euro, pound sterling, Swiss franc, and Aussie dollar in this example was uncertain. This was not the case for the Japanese yen, which fell against the U.S. dollar. Similar situations arose with respect to gold and crude oil.
The principal trading lesson is that the direction that prices will initially move in response to a trading catalyst is not always easy to determine in advance. This makes stop-loss orders or stops an important component of your trades.
How Much?
Determining the expected gain or loss of a potential trade is a crucial part of your trading strategy. The size of the expected move plays a large part in risk analysis. However, moves might not always be straight down or straight up. Significant countermoves within a larger trend also occur.
For example, Bloomberg News reported on April 16, 2010, that the SEC sued Goldman Sachs:
“...for fraud tied to collateralized debt obligations that contributed to the worst financial crisis since the Great Depression. The firm’s shares tumbled 13 percent...”13
The surprise announcement by the SEC hit the wire around 10:38 a.m. on Friday, April 16, 2010. Goldman Sachs’ stock price immediately fell. However, the initial move was followed by a spike up moments later.
During the 10:40:00 to 10:40:59 period, Goldman traded in a $19.41 range. It traded at $169.32 at 10:40:01 and at $171.32 at 10:40:59. The stock hit a low of $167.00 before hitting a high of $186.41 per share during that same minute. The high reached during this minute exceeded the price before the news came out by several dollars. How would you explain the sharp upward spike in prices during the minute beginning at 10:40:00? Most likely, it was the result of limit buy orders being set off as the price of Goldman Sachs stock fell. Investors who wanted to buy Goldman Sachs on a dip were finally able to do so much to their later regret. After those orders were exhausted, the downtrend resumed. However, the size of the move up might also have set off short covering after the price rose above the pre-announcement price. If so, that might have pushed the price of Goldman Sachs temporarily even higher.
When determining how much the market might react to a shock, never assume past results are always indicative of how the stock will react to a similar shock in the future. You need to allow for a possible change in market reaction.
Investors getting into Apple when it became the world’s most valuable company had to ask themselves, “How much higher can it rise?” They would find that the amount Apple could reasonably rise was relatively small—while the amount it could fall was surprisingly large.
When evaluating how much a stock might rise (or fall) in response to a shock, you should consider and settle the question before you calculate how much you could make or lose on the trade.
For instance, if you think in terms of, “‘If stock X goes to $25, I’ll make 50% on my money,” your evaluation of the potential influence of the shock is tainted by the hope of future gains. If instead you think, “Stock X is likely to go to $25 because their fundamentals are strong and their new product ‘Z’ is going to be a breakout smash,” you have the right template for considering how to make the most money off of that move.
How Long?
The initial reaction to a shock might be muted or sharp. A natural question to ask is, “How long will it last?”
The Market Reacts to the Fed
At 2:15 p.m. on September 18, 2007, the Federal Reserve announced that it was cutting the targeted Fed funds rate by 50 basis points. Immediately before the announcement at 2:14:59, the price of the 10-year Treasury note futures contract (traded on the CBOT) stood at 109-18. Four seconds later at 2:15:03, the price had jumped to 109-27+ (or $296.875 per contract). The price rose, then fell, then rose again. Table 2-2 reports the reaction of the CBOT December 2007 delivery 10-year T-note futures price to the announcement. (The dollar value per contract of selected price changes is indicated in parentheses.)
Table 2-2. Immediate Market Reaction to Fed Funds Rate Cut
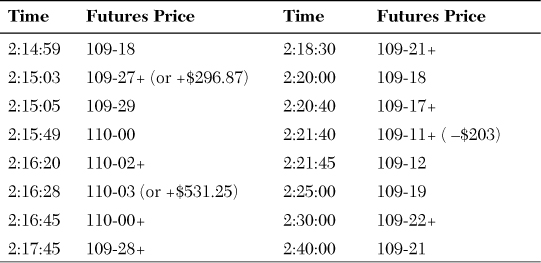
The market rallied sharply after the Fed announcement (up $531.25 per contract) and then broke $734.375 per contract and then rallied back $218.75 per contract or two ticks above its level before the news came out. The price moves all occurred within 10 minutes of the Fed announcement. No other significant market news was reported during this period. The market settled at 5:00:00 pm on September 18, 2007, at 109-27+ or $109.375 above the previous day’s close and $296.875 above the pre-Fed rate cut announcement.
The Chicago Mercantile Exchange reports a market-based measure of expectations of Fed rate cuts in the publication, CME Fed Watch. Market expectations of the probability of the Fed cutting the targeted Fed funds rate by either 25 or 50 basis points are reported in Table 2-3, which reveals that the market calculated the odds of a 50-basis-point cut at 74% and the odds of a 25-basis-point cut at 26% on September 12, 2007. Five days later, on September 17, the odds had fallen to even money. This meant the market was in for a bigger surprise when the 50 basis point cut was announced on September 18 than if the announcement had come on September 12. The information in Table 2-2 shows how quickly market expectations changed as the September 18, 2007 Fed announcement grew closer.
Table 2-3. CME Fed Watch—Probability of a Fed Funds Rate Cut of 25 or 50 Basis Points on September 18, 2007

The 10-year Treasury note futures market’s reaction to the Fed rate cut announcement suggests that the market is not always efficient. It also demonstrates that rallies and breaks can be short-lived.
In contrast to the 10-year Treasury note futures market, most stock indices rallied sharply after the Fed rate cut and remained higher. For instance, the DJIA was up about 70 points before the Fed rate cut news and was up another 265 points after. This illustrates that markets can react differently to the same information. The equity market didn’t experience the roller coaster ride that the 10-year Treasury note futures market did even though it was responding to the same news.
Longer-term shocks also occur that traders and investors who do not trade every day can exploit. One such shock was caused by the Argentinean de facto nationalization of YPF, an oil producer—the majority of which was owned by Repsol—a large Spanish energy firm. This shock not only created waves on the day of the shock, but set in motion a long-term trend that negatively affected the value of other energy companies with Argentine holdings such as WPX Energy, Inc.
Like many political shocks, the nationalization of this company was a signal to the broader market. It told the markets that Argentina would put short-term interest over long-term economic stability, that it would seize foreign assets, and that the government was not business friendly. These obvious signals of decline led to a continued depreciation of the Argentinean peso against the U.S. dollar that has continued unabated through early 2013.
Governments have an impact on the long-term business climate of a country. The nationalization of assets is typically a sign of a long-term souring of the business climate for foreign investors.
The Market Reacts to the November 2012 Employment Report
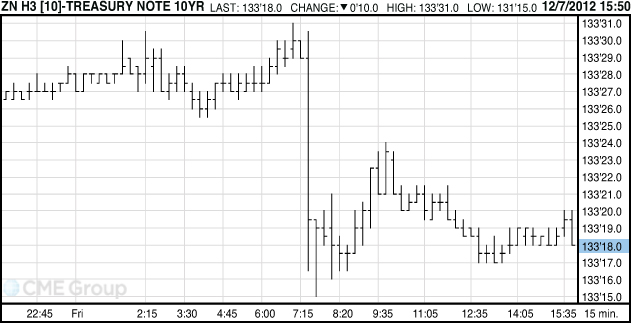
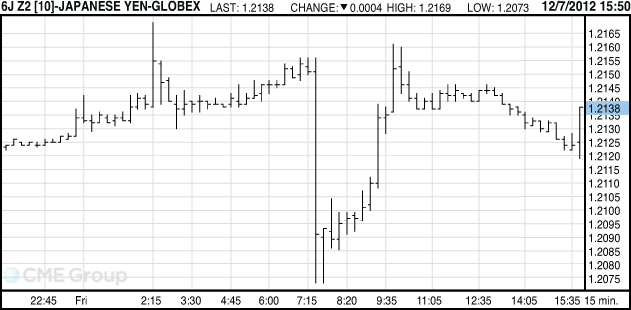
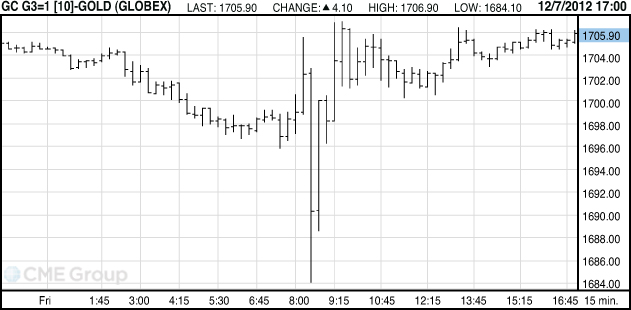
On Friday, December 7, 2012, financial markets reacted to the release of the November 2012 U.S. employment situation report. The report came in stronger than expected with more new jobs created than expected and the unemployment rate falling more than expected. The reaction in the financial markets was swift. Bonds fell and stocks rose. This is illustrated in the reaction of the CBOT 10-year Treasury note futures price March 2013 delivery in Figure 2-9. The reaction to the news in the Japanese yen futures market for December 2012 delivery and in the gold futures market for January 2013 delivery was immediate, too, but essentially short lived, as depicted in Figures 2-10 and 2-11, respectively. To be sure, a net reaction to the news occurred in each case, but it was far smaller than the initial reaction and arguably reversed direction in the case of gold futures. The reaction to news not only might vary across markets but might also be extremely short-lived.
(Reprinted with permission of the CME Group.)
Figure 2-9. The reaction of March 2013 delivery CBOT 10-year U.S. Treasury Note futures prices to the November 2012 U.S. employment situation report. All times are Chicago times.
(Reprinted with permission of the CME Group.)
Figure 2-10. The reaction of March 2013 delivery CME Japanese Yen futures prices to the November 2012 U.S. employment situation report. All times are Chicago times.
(Reprinted with permission of the CME Group.)
Figure 2-11. The reaction of February 2013 delivery NYMEX Gold futures prices to the November 2012 U.S. employment situation report. All times are New York City times.
How Quickly? Mad Cow Disease
Closely related to the issue of how long a shock will impact the market is the question of how quickly the market will react to the shock. In most cases the market will react very quickly, so the question is moot. However, sometimes most of the reaction is delayed.
At 12:15 p.m. on Tuesday, May 20, 2003, Canadian officials announced that a cow had been diagnosed with mad cow disease. The U.S. Department of Agriculture immediately imposed a ban on the importation of Canadian beef. However, word had leaked out prior to the announcement by Canadian authorities. The market’s reaction was swift. Live cattle futures fell the maximum amount allowed by 10:48 a.m. The decline was attributed to rumors of the discovery of mad cow disease in a Canadian cow. Traders then seemingly looked around for other securities that might be adversely affected by the news. An obvious candidate was McDonald’s. The price of McDonald’s stock fell sharply at 11:37 a.m. At one point, McDonald’s was down 8% for the day even though McDonald’s restaurants in the U.S. don’t use Canadian beef. Interestingly, traders took almost an hour before McDonald’s started to tank even though live cattle futures were lock limit down on rumors of the discovery of mad cow disease in a Canadian cow at 10:48 a.m. However, plenty of time was still available to trade off of the news (or rather, the rumor) as Wendy’s stock didn’t start to fall until five minutes later. Tse and Hackard [2006] argue that the sequential reaction indicates the effects of cascading information.14
How Quickly? CME Group Stock Price
The delayed reaction of the CME Group stock price to news on February 5, 2008 that a letter from the Antitrust Division of the U.S. Justice Department suggesting that futures exchanges be separated from their clearing houses to promote competition also illustrates that the market might take a while to respond to publicly available news. The Department of Justice’s letter stated:
“Based on its extensive experience investigating competitive conditions in various financial markets, including financial futures, options, and equities, the Department believes that certain regulatory policies governing financial futures may have inhibited competition among financial futures exchanges, potentially discouraging innovation and perpetuating high prices for exchange services. More specifically, the Department believes that the control exercised by futures exchanges over clearing services—including (a) where positions in a futures contract are held (“open interest”), and (b) whether positions may be treated as fungible or offset with positions held in contracts traded on other exchanges (“margin offsets”)—has made it difficult for exchanges to enter and compete in the trading of financial futures contracts. If greater head-to-head competition for the exchange of futures contracts could develop, we would expect it to result in greater innovation in exchange systems, lower trading fees, reduced tick size, and tighter spreads, leading to increased trading volume.
“In contrast to futures exchanges, equity and options exchanges do not control open interest, fungibility, or margin offsets in the clearing process. This lack of control appears to have facilitated head-to-head competition between exchanges for equities and options, resulting in low execution fees, narrow spreads, and high trading volume. Equities and options execution systems are also very sophisticated and feature-rich, more so than futures contract execution systems.... In light of the potential competitive benefits that could flow from regulatory changes that would facilitate competition in financial futures exchange markets, the Department recommends that Treasury propose a thorough review of futures clearing and its alternatives....”15
At 3:11 p.m. on February 5, 2008, the story was published by Bloomberg News.16 An alert with the same headline indicating a story would soon follow had been released about an hour earlier. CME Group stock closed down $30.20 on February 5, 2008 to $588.80 and $103.55 on February 6, 2008 to close at $485.25.17 To be sure, the CME Group had recently entered into negotiations to acquire the New York Mercantile Exchange (NYMEX), which was potentially jeopardized by the Justice Department letter (as the same division of the Justice Department would have to approve the merger). However, the value of a clearinghouse to a futures exchange should not be underestimated. Indeed, some observers would argue that one of the main reasons that the Intercontinental Commodity Exchange acquired the New York Board of Trade for about $1 billion in September 2006 was to obtain the NYBOT clearinghouse.18
The delayed reaction to news provided trading opportunities to those who recognized the potential (the value of clearinghouses to futures exchanges) and were prepared to assume the risks if they were wrong.
How Risky?
“How risky?” is the last of the five questions because risk is directly correlated with the other questions. A move that is too quick to profit from might make an otherwise safe trade very risky. Evaluating risk is crucial. Every trade you make, without exception, should be a trade where the risk is lower than the reward. This seems obvious, yet many traders—perhaps out of a desire for safety—unintentionally put on trades where the reward is smaller than the risk.
The ideal trade is a one-sided or uneven bet where the potential for gains far outweighs the potential for losses. The greater the potential payoffs for a level of risk, the larger the trade size can be, all else being equal.
One of the most common trades where the risk often outweighs the reward is a crowded trade. That is part of their attraction and their risk. Crowded trades buy you the mental security of “‘following the herd.” Analysts might recommend the trade, and the stock has doubled several times, so it appears safe. In some cases, riding bubbles and joining crowded trades can be a rational strategy. However, you might get in at a high price with limited upside built into the stock. The real danger comes in trying to exit the trade at the same time as everyone else.
Look at Green Mountain Coffee Roasters (GMCR).
On September 6, 2011, CNBC noted that GMCR had returned 3,585% in the previous 5 years.19 That was a fantastic return for those who got in early. But was it still a fantastic investment after September 2011? It was not. GMCR, trading above $110 in late September, had fallen to $40 by November 2011.
In only a few months, GMCR was subject to several sharp breaks punctuated with brief rallies as investors rushed for the exit. The run wasn’t over as there were more plunges, including a particularly large nearly 50% crash on May 3, 2012 that is discussed in more detail in Chapter 4, “Earnings and Corporate Announcements.”
The moral of the story is that GMCR had such great performance that it was running on momentum, not fundamentals. By January 2011, it was trading at a PE ratio of 85.20 It’s a classic case of a trade that looked safe—great track record, lots of hype, a popular product—but had peaked.
The same analysis is true for Apple after it became the world’s most valuable company on August 20, 2012. It had already risen about 10,000% since its lows around the return of Steve Jobs to active management of Apple.21 When Apple hit $700 it would take a major (approximately 50%) rise for it to become the first trillion-dollar company in terms of market capitalization. Apple has had a rational P/E ratio, especially when compared to some other high-flying companies, such as Amazon—yet other metrics showed it was unlikely to rise significantly—and could fall fast.22
Apple was worth $620 billion when it became the largest company on earth.23 It later got an even higher valuation as the stock rose more than $700 dollars per share. For Apple to even double from that price, it would be the worth more than $1.2 trillion—the world’s first trillion-dollar corporation. That is higher than South Korea’s GDP, and greater than the GDP of Saudi Arabia and Switzerland combined.
The already gargantuan 10,000% growth of Apple in the previous decade meant that the risk/reward ratio of Apple was simply not attractive. The odds of Apple doubling or tripling in a year were small. Plenty of other companies were much more likely to return 100%, 200%, or 300% that investors could consider.
Every action you undertake involves risk; what is key is evaluating just how risky that action is. Trades can be risky for any number of reasons. Risk is a function of both your probability of being wrong, and the consequences of being wrong.
A riskless bet could be one that either never goes against your position or that, no matter how often it does go against your position, costs you nothing. The trouble with evaluating risk is not that risk cannot be analyzed and computed, but that the true risk is constantly changing, is likely not to be completely known even by the best analysts, and that people are inherently fallible.
Crowded trades and following trends are examples of trades that might minimize your fear of being wrong. They do not, however, minimize the consequences of being wrong. In fact, they can amplify the consequences as a bubble suddenly pops, the crowd runs for the exit, or a once-popular trade swiftly falls out of favor.
A Sixth Question
In addition to answering the five simple questions presented in this chapter, sometimes a trader must answer a sixth question: Will the price action in one market spill over to other markets?
On Monday, March 9, 2009, Citigroup’s CEO sent a message to employees that the bank was profitable in January and February. This was widely attributed as the catalyst for a dramatic rise in its stock price in after-hours trading and on Tuesday, March 10. The rally in Citigroup stock served as a catalyst for other bank stocks.
The Citigroup news, coupled with later speculation that the uptick rule (that prohibits shorting a stock on a downtick) would be reimposed, were widely perceived as the catalysts for a global stock market rally. The S&P 500 closed up 6.4%. The FTSE index closed up 4.9%. The DAX closed up 5.3%. The CAC-40 closed up 5.7%. Does this mean that corporate memos are important? No. However, this episode does illustrate that the spark for a major rally could be anything.
Looking at the impact that the April 10, 2010 decision by the SEC to sue Goldman Sachs had on the price of Goldman Sachs’ stock mentioned earlier in this chapter is instructive. The selloff in Goldman stock precipitated a decline in the prices of other bank stocks on Friday, April 16, 2010 as well, in particular, large banks perceived to have similar involvement with the CDO market. For example, the more than 9% decline in Deutsche Bank’s stock price on Friday, April 16 was largely attributed to the selloff in Goldman Sachs. One interesting aspect of this stock price decline was the lagged reaction to the news. That is, not only did the Goldman Sachs news affect the prices of other major banks it did so with a lag. The low of the day for (New York traded) Deutsche Bank stock occurred shortly before 3:30 (New York time), while the low of the day for Goldman stock occurred shortly before 11:30 (New York time).
Additional Trading Lessons
Why is it so important to find the answers to these five simple questions?
Answering these questions forces you to take a broad look at the markets and evaluate potential trades as you analyze the risk reward tradeoffs. The answers to the questions influence not only the type of trade you put on (long or short) but also which security you select, the size of the trading position, and the expected holding period or trade horizon.
Your predictions might not exactly come to pass—in the market they rarely do—or the market might react in the exact opposite manner. Regardless of whether you predicted the future or were dead wrong, these five simple questions force you to analyze the markets in a thorough and wide-ranging manner. They also force you to ask yourself these crucial questions:
• Is this really such a safe bet?
• Is this market the best one in which to make my move? Does enough time exist for me to profit off of this move?
• Is this shock really going to send the market down—or will it send it up?
• Are my trades independent or are they highly correlated with each other?
You can never entirely predict the future, but you can plan for it. Asking yourself these questions prepares you for making informed trading decisions. For all trades, you must also consider both market conditions and investor sentiment because they can influence how the market reacts to shocks. The importance of market conditions and investor sentiment is discussed in the next chapter.
Endnotes
1. http://www.brainyquote.com/quotes/authors/m/michael_jordan.html#CZkQBFEi286Kul1U.99.
2. Cookson, R., and A. Ross, “Won Falls Sharply on Kim’s Death,” Financial Times, December 19, 2011. http://www.ft.com/intl/cms/s/0/76ca2a0a-29f1-11e1-8b1a-00144feabdc0.html#axzz2E7C7jZ00.
3. Ibid.
4. Webb, R.I., Trading Catalysts, How Events Move Markets and Create Trading Opportunities, Upper Saddle River: Pearson Education, 2007.
5. United States Attorney, Southern District of New York, “U.S. Charges Ex-Goldman Sachs Vice President and Consultant with Insider Trading in U.S. Treasury Bonds,” press release, September 4, 2003. http://www.justice.gov/usao/nys/pressreleases/September03/youngdahlindict.pdf.
6. A September 4, 2003, SEC press release noted the terms of the government’s settlement with Goldman Sachs: “...Based on its former employee Youngdahl’s conduct and on the bond trading that occurred as a result, Goldman Sachs has consented to a Commission administrative order finding that the firm violated the anti-fraud laws applicable to broker-dealers and government securities broker-dealers. The Commission’s order also finds that Goldman Sachs lacked adequate safeguards to prevent the misuse of material nonpublic information obtained from paid consultants. Goldman Sachs will pay over $9.3 million in disgorgement of trading profits, interest, and penalties. The order also recognizes that Goldman Sachs promptly notified the Commission staff about the trading that occurred and cooperated with the Commission’s investigation....” “SEC Brings Enforcement Actions Against Three Individuals, Goldman Sachs, and Massachusetts Financial Services Company Related to Trading Based on Non-Public Information about the Treasury’s Decision to Cease Issuance of the 30-Year Bond,” SEC press release, September 4, 2003. http://www.sec.gov/news/press/2003-107.htm.
7. BSC press release. www.efinancialnews.com/story/2008-03-14/bear-stearns-press-release-on-funding.
8. The repo (repurchase agreement) market is a market for short-term loans secured by high-quality collateral such as U.S. Treasury securities. The market is enormous with several hundred billion dollars traded each day. The Fed funds market is also a short-term loan market in which banks borrow from one another. The loans are not secured by collateral so the Fed funds rate is usually above the repo rate for general (unspecified) collateral.
9. The difference between what banks need to put up and what they could borrow is called the haircut. A small haircut in the repo markets meant that banks could hold highly levered positions in Treasury securities.
10. Kelly, K., “Inside the Fall of Bear Stearns,” Wall Street Journal, May 9, 2009. http://online.wsj.com/article/SB124182740622102431.html.
11. The forced sale was botched by policymakers and in response to a threatened lawsuit, the purchase price of Bear Stearns was increased to $10 per share. Contemporary news accounts reported that U.S. Treasury Secretary Hank Paulson had insisted that Bear be sold at a fire sale price.
12. Srivastava, S. and J. Kearns, “Bear Stearns Falls to Five Year Low on Capital Concern,” Bloomberg News, March 13, 2008. http://www.bloomberg.com/apps/news?pid=newsarchive&sid=a69chRKal0mo.
13. Gallu, J. and C. Harper, “Goldman Shares Tumble on SEC Fraud Allegations,” Bloomberg News, April 16, 2010. http://www.bloomberg.com/news/2010-04-16/goldman-sachs-sued-by-sec-for-fraud-over-mortgage-backed-cdos-shares-drop.html.
14. Tse, Y. and Hackard, J. C., “Holy Mad Cow! Facts or (Mis)perceptions: A Clinical Study,” Journal of Futures Markets,” Vol. 26, 2006, pp. 315–341.
15. Review of the Regulatory Structure Associated with Financial Institutions. Comments of the U.S. Department of Justice, January 31, 2008. http://www.justice.gov/atr/public/comments/229911.htm.
16. Leising, M., “U.S. Says Futures Clearinghouses Inhibit Competition,” Bloomberg News, February 5, 2008.
17. The CME Group had a 5 for 1 stock split in May 2012.
18. Cameron, D., and K. Morrison, “ICE to buy Nybot for $1bn,” Financial Times, September 15, 2006. http://www.ft.com/intl/cms/s/0/7a53d212-4472-11db-8965-0000779e2340.html#axzz2F9icBfDE.
19. Fox, M., “Cramer’s Top Performing Stocks of Past 5 Years,” CNBC.com, September 6, 2011. http://www.cnbc.com/id/44409556/Cramer_s_Top_Performing_Stocks_of_Past_5_Years.
20. 12 Value Stocks—Intelligent Investment in the Stock Market, “Green Mountain Coffee GMCR, Further Proof of How Irrational the Markets Can Be,” 12value stocks.com. July 13, 2012. http://12valuestocks.com/2012/07/green-mountain-coffee-gmcr-further-proof-of-how-irrational-the-markets-can-be/.
21. Baran, D., “Financial Markets Salute Steve Jobs as Apple Shares Soar,” October 11, 2011. http://www.webguild.org/20111011/financial-markets-salute-steve-jobs-as-apple-shares-soar.
22. Satariano, A., “‘Apple Fever’ Prompts Predictions of $1 Trillion Value,” Bloomberg News, April 3, 2012. http://www.bloomberg.com/news/2012-04-03/-apple-fever-to-push-stock-to-1-001-within-year-analyst-says.html.
23. Benzinga Insights, “Apple Now Most Valuable Company in History,” Forbes.com, August 21, 2012. http://www.forbes.com/sites/benzingainsights/2012/08/21/apple-now-most-valuable-company-in-history/.

