
Chapter 3: Common Use Cases and Architecture Patterns
This chapter provides an overview of common use cases and architecture patterns you will see with Amazon Elastic MapReduce (EMR) and how EMR integrates with different AWS services to solve specific use cases. The use cases include batch Extract, Transform, and Load (ETL), real-time streaming, clickstream analytics, interactive analytics with machine learning (ML), genomics data analysis, and log analytics.
This should give you a starting point to understand what problem statements you can solve using Amazon EMR and use it to solve your real-world big data use cases.
We will dive deep into the following topics in this chapter:
- Reference architecture for batch ETL workloads
- Reference architecture for clickstream analytics
- Reference architecture for interactive analytics and ML
- Reference architecture for real-time streaming analytics
- Reference architecture for genomics data analytics
- Reference architecture for log analytics
Reference architecture for batch ETL workloads
When data analysts receive data from different data sources, the first thing they do is transform it into a format that can be used for analysis or reporting. This data transformation process might involve several steps to bring it to the desired state and, after it is ready, you need to load it into a data warehousing system or data lake, which can be consumed by data analysts or data scientists.
To make the data available for consumption, you need to extract it from the source, transform it with different steps, and then load it into the target storage layer – hence the term ETL. For a few other use cases, when the raw data is in a structured format, you can then load it into a relational database or data warehouse and then transform it with SQL, where it becomes Extract, Load, and Transform (ELT).
What we understand from all this is that transformation is the primary piece that makes raw data ready for consumption. What needs to be done as part of the transformation process depends on the type or format of data, any data cleaning that needs to be done, any business transformations that need to be applied or not, and many more.
In earlier days, when data volumes used to be small (in MB), you had the option to use typical programming languages and a single server to process them, but with higher volumes of data (gigabytes to petabytes), you need to look at distributed processing capability with Hadoop/Spark and execute through Amazon EMR.
Batch ETL use cases are very common in the data analytics world and the job execution can be through a scheduler or triggered based on a file arrival event. In this section, we will explain a reference architecture for batch ETL workloads that receives data from different sources and after multiple transformation steps, the transformed output is ready for data analysis or business intelligence (BI) reporting.
Use case overview
For this use case, let's assume, as an organization, you receive data from the following two sources:
- On-premises systems, which includes two data sources. One is a relational database and the other is a filesystem.
- A vendor filesystem that uses SSH File Transfer Protocol (SFTP) to send files.
You have an objective of curating the data in an Amazon Simple Storage Service (S3) data lake through different storage layers, such as raw, processed, and consumption, and then making the data available for consumption, where you should be able to access the data through SQL for analysis or build reports through a self-service BI reporting tool.
Reference architecture walkthrough
Now, to provide a technical solution to the preceding use case, you can refer to the following architecture where Amazon S3 is used as a persistent storage layer, Amazon EMR is being integrated to perform ETL transformations, and Amazon QuickSight is being used for BI reporting:

Figure 3.1 – Reference architecture for batch ETL workloads
As part of this architecture, you will notice the following three Amazon S3 storage layers:
- S3 raw layer: This layer is responsible for keeping the raw data from the source system as it is, which can help you to reprocess the pipeline in case of issues or if you plan to reuse the same data for other downstream processing. If you do not keep the raw data persistently, you may have to pull the data from the source system again when needed and the older data might be missing from the source system itself. So, it's always better to keep the raw data persistently separate if you need to handle future needs, such as reprocessing the data to address any earlier transformation issues or using it for another use case.
- S3 processed layer: After you receive raw data, you may need to apply a few common data cleansing, data validation, or standardization processes to make the data ready for consumption. This might include validating the number of records, the file size, or the schema of each record before making it available for consumption. Data engineers use this layer to apply business logic transformation and create a subset of data for different downstream systems.
- S3 consumption layer: This layer is the final storage layer, which is used by data analysts to analyze data to derive insights or build BI reports or dashboards for leadership teams. The processed layer data goes through transformations based on the consumption need and is written to the consumption layer with the required file format and partitioning strategies.
Here is an explanation of the architecture steps:
- Step 1 represents data ingestion or movement from on-premises to an Amazon S3 raw bucket:
- Steps 1.1 and 1.2 represent pulling data from a relational database source where you can integrate AWS Data Migration Service (DMS) to pull data to an Amazon S3 bucket through a scheduled pull mechanism. AWS DMS is a managed service using which you can move data from different databases (on-premises or the cloud) to different AWS databases (Amazon Relational Database Service (RDS) or Amazon Aurora), Amazon S3, or AWS analytics services such as Amazon Kinesis Data Streams (KDS), Amazon OpenSearch Service, and Amazon Redshift. This enables you to pull data from the source as a one-time extract or pull data on a continuous basis using a Change Data Capture (CDC) mechanism.
- Step 1.3 represents your on-premises files that can be uploaded to Amazon S3 directly.
- Steps 1.4 and 1.5 represent the vendor file being pushed to an SFTP server hosted on Amazon EC2, from which you can push to Amazon S3 through a scheduled batch script.
- Step 2 integrates a transient EMR cluster that takes input from the raw S3 bucket, applies required cleansing or standardization rules, and writes the output back to the S3 processed bucket. For the ETL transformations, you can use Hive or Spark steps in EMR.
- Step 3 applies additional business logic to enrich the processed datasets. Here also, an Amazon EMR transient cluster is integrated that reads input from the processed S3 bucket and applies business logic transformations through Spark, then writes enriched output to the consumption S3 bucket.
- Step 4 represents an external Hive Metastore built on top of Amazon RDS, which is used by all the transient EMR clusters so that each transient cluster can refer to the existing data catalog instead of creating it from scratch.
- Step 5 represents the consumption layer, where with EMR's Hive or Presto query engines, you can access the data from the S3 consumption bucket through SQL. You can also use the Hue web interface for data analysis.
Then, on top of that, you can integrate Amazon QuickSight or any other BI reporting tool to create aggregated visualizations or report dashboards.
Now let's discuss a few best practices that you can follow while implementing the pipeline.
Best practices to follow during implementation
While there are use case-specific recommendations, the following are some generic guidelines you can follow while implementing this use case:
- File formats: When you perform ETL operations, at the final stage, you write the output back to an Amazon S3 data lake and you have different file format options to select from, for example, Parquet, Avro, ORC, JSON, and CSV.
You might receive raw data as JSON or CSV, but for analytics use cases, columnar formats such as Parquet are very popular. Columnar formats provide storage savings and provide great performance when you query specific columns through SQL.
- Partitioning: This is a data distribution technique where you first identify your query patterns to understand how you filter your datasets and then use the filter columns as your partition columns. On the storage layer, it creates subfolders based on the partition column value. For example, if most of your queries are with a country column filter, then you can select a country as the partition column and in S3, you will have a country-based subfolder and each country subfolder will have records related to that country. So, when you filter by a country, you only scan that country-specific subfolder, which gives you better performance.
- Transient EMR clusters: As this is a batch ETL workload, your ETL jobs are mostly scheduled to run once daily or multiple times a day. When the jobs are not being executed, your cluster becomes idle and you still pay for the cluster usage time as the infrastructure is still up and running. So, for batch ETL jobs, transient EMR clusters are better suited as you save infrastructure costs when the EMR cluster resources are not being utilized.
- External Hive Metastore: When you have transient EMR cluster workloads, it's always recommended to go with an external Hive Metastore so that you don't lose catalog data when your cluster is getting terminated and also, you can share the catalog with multiple EMR clusters. For an external Hive Metastore, you can have an Amazon RDS database or you can use AWS Glue Data Catalog.
I hope this provides a good overview of batch ETL use cases and you will now be able to integrate Amazon EMR to build a data analytics pipeline. In the next section, you will learn how EMR can be integrated for a clickstream analytics use case.
Reference architecture for clickstream analytics
In consumer-facing applications, such as web applications or mobile applications, business owners are more interested in identifying metrics from a user's access patterns to derive insights into which products, services, or features users like more. This enables business leaders to make more accurate decisions. Often, it becomes a necessity to capture user actions or clicks in real time to have a real-time dashboard suggesting how successful your campaign is or how users are responding to your new product launch.
To make business decisions in real time, you need to have the data flow in near real time too. This means as soon as the user clicks anywhere within the application, you need to capture an event immediately and push it through your backend system for processing. As multiple users access your application through different channels, it generates a stream of events and you need a scalable architecture that can support receiving a massive volume of concurrent records and can also use a big data processing framework to process them.
Use case overview
Here, we will take an example use case to explain how you can integrate a few AWS services with Amazon EMR to build a real-time streaming clickstream application.
It assumes your organization has a website that has a lot of user traffic on a daily basis. To track overall usage patterns, you have integrated Google Analytics into your website and for detailed user session-based analytics, you plan to stream click events in real time too.
Your objective is to aggregate both Google Analytics and real-time clickstream events into a data lake and also ingest aggregated output to a data warehouse, on top of which you can build real-time BI reports.
Reference architecture walkthrough
Now, to provide a technical solution for the preceding use case, you can refer to the following architecture where Amazon S3 is integrated as a data lake, Amazon Redshift is used for a data warehouse, Amazon EMR is integrated to perform ETL and real-time streaming, and Amazon QuickSight is integrated for BI reporting:

Figure 3.2 – Reference architecture for clickstream analytics
Apart from Amazon S3, EMR, and QuickSight, you will notice other AWS services integrated, which are as follows:
- Amazon AppFlow: Amazon AppFlow is a fully managed integration service that can help you transfer data between software-as-a-service (SaaS) applications, such as Salesforce, Google Analytics, and Slack, and AWS services, such as Amazon S3 and Amazon Redshift, in just a few clicks on the AppFlow interface. You can schedule these flows to run at regular intervals or integrate them to get triggered with different business events. It also provides a few configurations in terms of selecting which attributes you want to transfer, what the target storage format should be, or what the partitioning structure in Amazon S3 should be.
For this clickstream analytics use case, you can integrate Amazon AppFlow to pull data from Google Analytics to Amazon S3 in a scheduled pull manner.
- Amazon KDS: Amazon KDS is a scalable and durable message bus that can help integrate real-time streaming use cases, where you can have multiple producers pushing data to KDS and there can be multiple consumers who are reading from the stream in real time. It is a serverless service that can stream gigabytes of data per second and is a great fit to stream real-time clickstreams, log events, financial transactions, or social media feed events. You can integrate multiple consumers, including AWS Lambda, EMR with Spark Streaming, or AWS Glue with Spark Streaming or Flink, to process the stream events in real time and write to the target storage.
- Amazon Redshift: Amazon Redshift offers massively parallel processing capability and is great for high-volume data warehousing platform needs. Its high performance makes it popular in the analytics world and is commonly integrated as a backend database for real-time BI reports.
Here is an explanation of the architecture steps:
- Steps 1 and 2 represent data movement from the Google Analytics tool to an Amazon S3 raw bucket with the help of Amazon AppFlow. You can define a scheduled pull from Google Analytics and store the output JSON in S3. Please note, the output you receive is a nested JSON that requires additional transformation to flatten it for consumption.
- Steps 3 and 4 integrate a transient EMR cluster that takes nested JSON input from the raw S3 bucket, flattens it, applies minimal cleansing or standardization rules, and writes the output back to the S3 data lake bucket. For the ETL transformations, you integrate a Spark step in EMR. Step 3 applies additional business logic to enrich the processed datasets. Here also, an Amazon EMR transient cluster is integrated that reads input from processed S3 bucket and applies business logic transformations through Spark, then writes enriched output to the consumption S3 bucket.
- Step 5 represents the web application that can integrate Amazon KDS's Kinesis Producer Library (KPL) to ingest data into KDS partitions as soon as a user click event happens. KPL also provides in-built buffering and retry mechanisms to handle failures.
- Steps 6 and 7 represent Amazon EMR with Spark Structured Streaming as the consumer application of the Kinesis stream. It does two operations; one is writing the raw events to Amazon S3 and the second is aggregating the stream data with Google Analytics and writing aggregated output to the Amazon Redshift data warehouse.
- Steps 8 and 9 represent the consumption layer, where we have integrated Amazon Redshift Spectrum to query data from both the data lake and Amazon Redshift storage layers and then integrate Amazon QuickSight on top of it to build real-time reports or dashboards. This is the layer where your business users join to see how your campaigns perform in real time or how your users are reacting to your new product launch.
Now let's discuss a few best practices that you can follow while implementing the pipeline.
Best practices to follow during implementation
Here are a few generic guidelines that you can follow while implementing this use case; for sure there will be more use case-specific ones:
- Scalability: You don't need to invest in creating a massive cluster for your KDS or Amazon EMR cluster from day 1. You can use the scaling features available in both of them to scale the cluster up and down as the volume of stream events changes throughout the day. Amazon EMR provides in-built autoscaling and managed scaling features that you can use to scale your cluster in real time.
- Fault tolerance: You also need to consider how you recover from failures. Regarding KDS, you can use the data retention setting, which is by default set to 7 days but can be extended up to 1 year. Then, you can take advantage of EMR with Spark Streaming's checkpointing feature using which you can checkpoint stream events to the Amazon S3 location. If your EMR cluster or Spark job gets terminated, you can restart from the failure point that is checkpointed in Amazon S3.
- Optimizing data lake storage: As discussed in Figure 3.1 – Reference architecture for batch ETL workloads, you can optimize storage in a data lake by choosing the appropriate file format and also structuring your data into subfolders or partitions, which will give better performance when you query the table with the partition column as a filter.
- Use Redshift for aggregated output: You have the option to write the complete raw dataset into Redshift too as it's structured data but avoid doing so as Redshift infrastructure will add a lot to the cost, compared to data lake storage. So, creating a mix of a data lake and data mart is great for use cases such as this.
With this use case, you have learned how you can implement clickstream analytics using Amazon EMR and what some of the general recommendations you can follow are. In the next section, let's understand how you can do interactive analytics with Amazon EMR as a long-running cluster.
Reference architecture for interactive analytics and ML
In the previous sections of this chapter, you might have seen the usage of Amazon EMR as a transient cluster that gets created through file arrival or a scheduled event, processes the file with Hive or Spark steps, and then gets terminated. Transient clusters are great to decouple storage and compute and also to save costs by reducing cluster idle time.
But there are few use cases where you might need a persistent EMR cluster that might be active 24x7 with minimal cluster node capacity and goes through the EMR autoscaling feature to scale up and down as needed. These persistent clusters generally serve multiple workloads, including ETL transformations with Hive/Spark, analyzing data through SQL-based query engines such as Hive and Presto, or interactive ML model development through notebooks. In a few cases, you can implement a multi-tenant EMR cluster that serves multiple teams with an access policy and data isolation.
As the cluster is available 24x7, multiple users use the same cluster compute capacity for different workloads. Then, you can configure the cluster to define queues that will have required CPU and memory resources assigned that get used through EMR's capacity and fair schedulers.
Use case overview
Here, we will see an example to explain how a persistent EMR cluster can serve multiple workloads and make the data available to data analysts and data scientists for interactively querying the datasets or ML model development.
It assumes your organization receives data from two different sources that need to be aggregated into a data lake. Then, the aggregated output should be available to your data analysts for interactive querying using SQL or your data scientists for exploring the datasets and doing ML model development, model training, and inference.
To give an overview of ML engineering, it goes through a sequence of steps. Initially, data scientists put effort into exploring the datasets, cleansing or preparing them, and identifying the attributes that make the most sense for model development. Then, they start ML model development using the Python or R scripting languages using different ML frameworks, such as TensorFlow, MXNet, or PyTorch. After the model development is ready, they train the model on historical datasets and optimize their model as needed.
The model training process creates trained models that will be used to predict output against new input datasets. So, in general, model development and training is an intensive process where data scientists go through a lot of iterations to standardize the data, optimize ML model code, and do training with a proper mix of datasets.
Now let's understand the two data sources we have, which will be the input to the data pipeline:
- An external vendor is sending a daily CSV file to your input S3 bucket directly that includes the financial credit score of your customers, which needs to go through a validation and cleansing process.
- You have subscribed to another vendor's data feed that exposes data through REST APIs and you need to pull the data dynamically from their APIs in a periodic fashion. After extracting data, you need to flatten the results and store them in your data lake.
Let's take a look at the reference architecture.
Reference architecture walkthrough
Now, to provide a technical solution for the preceding use case, you can refer to the following architecture, where we have the following:
- Amazon S3 is integrated for the data lake.
- Amazon EMR is used for both transient and persistent EMR clusters.
- AWS Lambda and Amazon DynamoDB are integrated to automate data extraction from REST APIs.
- The EMR cluster's Hive, Presto, Zeppelin, or Jupyter notebooks are integrated to provide an interactive development experience for data scientists.
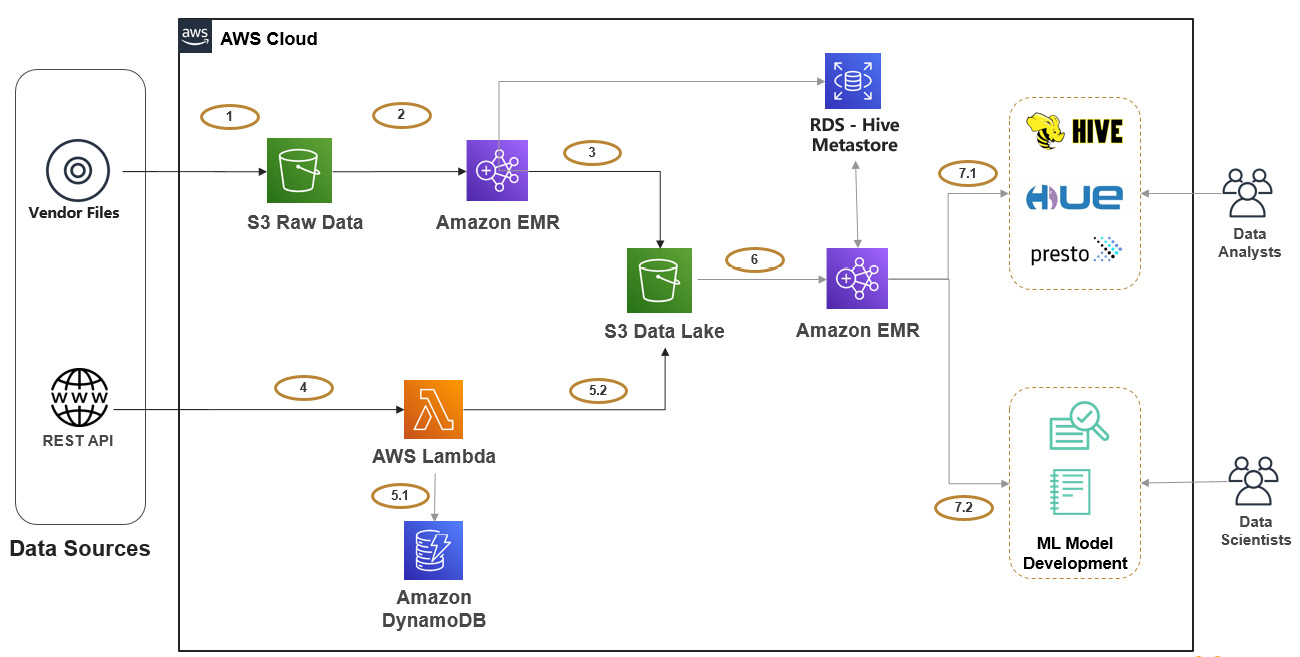
Figure 3.3 – Reference architecture for interactive analytics and ML
Before going deep into the architecture, let's understand the two new AWS services we have introduced as part of this architecture:
- AWS Lambda: AWS Lambda is a serverless compute service that lets you run code without provisioning or managing any infrastructure. It provides flexibility to scale compute capacity as needed and it also allows you to choose from a variety of programming languages for implementing your business logic. You can use AWS Lambda's user interface to write code or package your code as a ZIP file and upload it to AWS Lambda for execution. You can integrate AWS Lambda to get triggered through various events or through a scheduler and also, it natively integrates with other AWS services, such as Amazon API Gateway, Amazon DynamoDB, Amazon KDS, and AWS Step Functions, to build your application in a decoupled approach.
For this use case, you can integrate AWS Lambda to get triggered at a regular interval (for example, every 5 minutes or every 1 hour) to connect to the REST API, fetch datasets, transform it, and write to a target Amazon S3 data lake.
- Amazon DynamoDB: Amazon DynamoDB is a key-value NoSQL database in AWS that delivers single-digit millisecond performance at any scale. It is fully managed and can be deployed as a global database across multiple regions of AWS. It is often used as the backend of scalable REST APIs or as a key-value metastore.
For this use case, DynamoDB is integrated to keep track of the Lambda execution and the amount of data being pulled from the REST API. So, if the Lambda execution fails, it can refer to the DynamoDB table to identify the failure point and trigger again from that point.
- Notebooks: Amazon EMR integrates both Jupyter and Zeppelin notebooks, which you can configure to submit jobs and queries to the Amazon EMR cluster's Hadoop/Spark interfaces.
For this use case, analysts can use a notebook to execute their queries or jobs step by step during development.
Here is an explanation of the architecture steps:
- Steps 1-3 represent the vendor file ingestion to the data lake. Step 1 represents the vendor directly pushing the file to your input raw S3 bucket. Then, you can integrate a transient EMR cluster on top of it, which might have a Hive or Spark job step to read from the input bucket, apply required transformations, and write the final output to the S3 data lake bucket.
- Steps 4 and 5 represent ingesting REST API data to the data lake. You can schedule the AWS Lambda function to be executed every 30 minutes, which might be written in Python. It will connect to the REST API, get the response as JSON, apply a few transformations to flatten it, and then finally, write the transformed output to the data lake. As explained earlier, we need to bring in a mechanism to recover from failures as the REST APIs will have throttling enabled to restrict frequent access to the APIs. Step 5.1 represents writing metadata to a DynamoDB table, where every time the Lambda function pulls data from the REST API, it will checkpoint which timestamp or record ID it pulled so that the next execution will be from the earlier checkpointed timestamp.
- Step 6 represents a persistent Amazon EMR cluster that users connect to explore the data available in the data lake. EMR provides the distributed processing capability with all Hadoop ecosystem services such as Hive, Spark, Presto, and Jupyter Notebook for interactive analytics. It also integrates Amazon RDS as its external Hive Metastore.
- Step 7.1 integrates Hadoop interfaces, such as Hue, Hive, and Presto, which data analysts can use to analyze the data in the data lake through SQL. Hue is a web interface that acts as a client for users, which integrates with the Hive catalog and can submit queries to query engines such as Hive and Presto.
Hive is a distributed query engine that can be configured to submit queries to MapReduce or Spark. It will parse the user-submitted queries to MapReduce or a Spark-equivalent script, which will read input data from the data lake, do processing, and then serve the result in tabular format.
Similar to Hive, Presto is a low-latency query engine that you can use to execute ad hoc analytical queries.
- Step 7.2 represents the integration of notebooks on top of the EMR cluster for interactively developing Python, PySpark, R, and other scripts to analyze data, do ML model development, or train your model for inference.
EMR provides options to select Jupyter Notebook or Zeppelin notebooks on top of the EMR cluster, which comes with different scripting language options, and you can also integrate your own plugins and modules for development.
Now, let's discuss a few best practices that you can follow while implementing the pipeline.
Best practices to follow during implementation
Here are a few generic guidelines that you can follow while implementing this use case; for sure there will be more use case-specific ones:
- Cluster resource management: As this is a persistent EMR cluster that will be used for multiple workloads, you need to have a strategy to manage cluster resources well. You can think of defining different queues to manage high-priority and low-priority jobs so that when high-priority jobs are getting executed, low-priority jobs can wait for their completion.
You can configure multiple queues with different amounts of memory and CPU resources as per your needs and configure the capacity scheduler or fair scheduler to let the scheduler decide how to respond as multiple workloads get executed concurrently.
After you have defined queues, you can specify -queue <queue-name> as an additional parameter for your spark-submit commands to direct YARN to use the specified queue for this job.
- Cluster capacity planning and scaling: You can monitor your cluster usage for a period of time and derive patterns around the minimum cluster capacity you need on a continuous basis and keep that as your minimum cluster capacity. On top of that, you can configure EMR's autoscaling or managed scaling features to scale up or down as new workloads come in.
In addition, you also need to consider the amount of HDFS space you need on the cluster, depending on your implementation. Even if you have integrated Amazon S3 as your persistent data store, you may still need to cache some amount of data in HDFS for better performance.
- Data isolation and security: When you have a persistent cluster being shared by multiple teams and multiple workloads, you also need to make sure the security aspects are integrated so that you are able to configure authentication, authorization, and encryption of data at rest or during transit.
For authenticating users' access to your cluster, you can create a mix of AWS IAM and your Active Directory integration.
For authorization, you can integrate AWS Lake Formation or Apache Ranger, where you can define which user can access which catalog databases, tables, or columns.
To make your data secure at rest, you can enable encryption with AWS Key Management Service (KMS) keys or custom keys, and for making the data secure while it's in transit, make sure you have SSL/TLS integrated.
Reference architecture for real-time streaming analytics
At the beginning of the chapter, you learned about clickstream analytics that integrated Amazon KDS and EMR with Spark Streaming to stream clickstream events in real time. The use case covered in this section is another use case that explains how you can stream Internet of Things (IoT) device events in real time to your data lake and data warehouse for real-time dashboards.
To give an overview of IoT, it's a network of physical objects called things that uses sensors and related software technologies to connect and exchange information with other devices or systems over the internet. These devices can be any household or industrial equipment that has a sensor and required software embedded into it to communicate with other devices or send messages to a central unit that monitors requests or signals.
The adoption of IoT around the world is increasing as analytics on device data can provide a lot of insights to optimize usage or predict patterns.
Use case overview
Let's assume your organization has IoT devices to track electric usage at anybody's home or office. Your plan is to sell these IoT devices and help set them up at your customers' homes or offices. This will track all usage of electricity and help stream the data in real time to a centralized data lake and data warehouse in AWS.
Your organization's data analysts will analyze these real-time datasets, aggregate them with historical data to derive insights, and then provide analytical reports to their users.
These analytical reports might include usage patterns around which days of the week or which time of the day they consume more electricity or which electronic devices in their homes consume more electricity. Your organization also might provide recommendations around how your customers can save their monthly costs by changing their usage patterns.
As the IoT devices will stream every bit of device usage information in real time, it is expected that the data volume will be higher, and to handle processing such a bigger volume of data, you need a big data processing service or tool such as Amazon EMR.
Reference architecture walkthrough
Now, to provide a technical solution for the preceding use case, you can refer to the following architecture where AWS IoT is integrated to receive IoT events and publish them to KDS. Then, Amazon EMR helps in further aggregations to make the aggregated data available in Redshift and an Amazon S3 data lake for analytics:

Figure 3.4 – Reference architecture for real-time streaming analytics
Before going deep into the architecture, let's understand the three new AWS services we have introduced as part of this architecture:
- AWS IoT: AWS IoT provides capability using which you can connect one IoT device with another and connect your IoT devices to the AWS cloud. It provides device software that will help you integrate your IoT device with AWS IoT-based solutions. It has several components, such as AWS IoT Core, FreeRTOS, AWS IoT Greengrass, AWS IoT 1-Click, AWS IoT Analytics, AWS IoT Button, AWS IoT Device Defender, AWS IoT Device Management, AWS IoT Events, AWS IoT SiteWise, AWS IoT Things Graph, and AWS Partner Device Catalog.
AWS IoT Core provides support for Message Queuing and Telemetry Transport (MQTT), MQTT over WSS (WebSockets Secure), Hypertext Transfer Protocol Secure (HTTPS), and Long Range Wide Area Network (LoRaWAN), which gives a wide range of flexibility for integration.
AWS IoT natively integrates with other AWS services, which can help you to implement an end-to-end pipeline faster.
- Kinesis Data Firehose: Amazon Kinesis Data Firehose is a fully managed service with scalability built in, which provides delivery stream capability that can deliver streaming data to Amazon S3, the Amazon OpenSearch service, Amazon Redshift, HTTP endpoints, and a few third-party service providers, such as Splunk, Datadog, and New Relic.
It provides additional features, such as the buffering of stream messages, applying transformations through AWS Lambda, and delivering to Amazon S3 with different file formats or partitioning in place.
Kinesis Data Firehose is popular for delivering KDS messages to its supported targets with minimal transformations in near real time. For this IoT use case, it does something similar where it reads IoT events from KDS and writes them back to Amazon S3.
- Amazon Athena: Amazon Athena is an interactive query engine that is built on top of Presto and uses Apache Hive for Data Definition Language (DDL) internally. It is serverless, which means there is no infrastructure to manage, and this also follows the pay-as-you-go pricing model. Athena's pricing is based on the amount of data you are scanning.
Athena is very popular for querying data lakes or Amazon S3, where you define a virtual table on top of an Amazon S3 path, add required partitions to the table as needed, and then execute standard SQL queries to get results. It adds a lot of value when analysts are more familiar with SQL-based analysis compared to complex ETL programming.
Athena is integrated with AWS Glue Data Catalog out of the box. Also, apart from querying from Amazon S3, Athena also supports querying from other relational or third-party data sources through its Federated Query feature, which uses AWS Lambda internally to fetch data from the source and provide results to Athena in a tabular format.
The following is an explanation of the architecture steps:
- Steps 1 and 2 represent the IoT devices sending electricity usage metrics to AWS IoT Core through MQTT in real time.
- Steps 3 and 4 represent AWS IoT Core using IoT rules to send event messages to KDS, which will facilitate multiple consumer applications to read data from KDS and write it to multiple targets.
You should be considering what the different types of events you are going to receive from your IoT devices are and define partition keys in KDS accordingly.
- Steps 5.1 and 6 represent one of the consumers of the KDS events, where Amazon EMR uses Spark Structured Streaming to read data from KDS in real time and write to Amazon Redshift. In this case, the EMR cluster will be an always-on persistent cluster with a minimal number of nodes to stream data on a continuous basis.
- Steps 5.2, 7, and 8 represent another consumer of KDS where Kinesis Data Firehose is integrated to define a delivery stream with an Amazon S3 data lake as the target and on top of which Amazon Athena is integrated for querying the data through standard SQL. The purpose of writing the data to a data lake is to have a persistent data store for the historical data, whereas Amazon Redshift is being used as a data mart to store aggregated output for real-time reporting.
- Steps 9 and 10 represent the integration of Amazon QuickSight on top of an S3 data lake and Redshift data mart for building BI reports. QuickSight can use Amazon Athena to query from an S3 data lake or use Redshift Spectrum to read data from both S3 and Redshift to show a real-time report on aggregated output.
Now let's discuss a few best practices that you can follow while implementing the pipeline.
Best practices to follow during implementation
Here are a few generic guidelines that you can follow while implementing this use case; for sure there will be more use case-specific ones:
- Buffering and partitioning configuration of Kinesis Data Firehose: Kinesis Data Firehose has configurations where you can specify whether you would like to buffer the data before delivering it to Amazon S3, which might help in aggregating a number of records to a single file in Amazon S3 to avoid too many small files in S3. Please note, too many small files (files in KBs or less than 64 MB) in an S3 data lake might create a performance bottleneck when you try to access them through Amazon Athena, Amazon Redshift, or Redshift Spectrum as it will create a lot of overhead in tracking so many small files. You can take advantage of the buffering configuration of Kinesis Data Firehose and also consider partitioning configuration while writing data back to an S3 target.
- Distribution and sort key of Redshift: As you write data into a Redshift cluster, it gets distributed across compute nodes so that when you submit queries, it can execute your query in a distributed fashion. But Redshift provides flexibility to choose how you would like to distribute your queries across nodes so that your join or filter queries can perform better. It provides the Key, Even, and All distribution styles to choose from.
In addition to the distribution key, Redshift also provides flexibility to select a sort key, which helps to decide in which order data will be sorted internally. When the data is sorted, it enables the Redshift query optimizer to scan fewer chunks of data, which in turn will give higher performance. Redshift provides two types of sort keys: a compound sort key and an interleaved sort key.
Now that we have understood this use case, let's dive into another in the following section.
Reference architecture for genomics data analytics
Before going into the technical implementation details of genomics data analytics, let's understand what genomics means. It is a field of study of biology that focuses on the evolution, mapping, structure, and functions of genomes. A genome is a complete set of DNA of a living being, which includes all of its genes.
In recent times, there have been significant investments in genomics and clinical data to explore more about living beings' genes and their characteristics, which can help diagnose any disease beforehand or predict new features. Technology continues to play a vital role in genomics studies: as the data volume grows, you can use big data technologies for distributed processing.
Genomics datasets are available in complex data formats, such as VCF and gVCF, and to parse them, there are several popular frameworks available, such as Glow and Hail.
Use case overview
Let's assume your organization is providing products or services that can help in detecting, diagnosing, or treating different health diseases, and for this, your organization heavily invests in genomics studies. Your organization has its own research data and gets data genomics and clinical data from third-party vendors to aggregate it with in-house data and derive insights out of it.
You are in need of a big data processing solution for the genomics clinical data and also a centralized data store. For the whole solution, you plan to use AWS cloud-native services.
Reference architecture walkthrough
Now, to provide a technical solution for the preceding use case, you can refer to the following architecture, where you can use Amazon EMR with Spark and one of the open source VCF file processing frameworks, such as Glow, for the ETL need. Apart from EMR's big data processing capability, you can use Amazon S3 for the persistent storage of historical data, Amazon Redshift as a data warehouse for aggregated data, and Amazon QuickSight for BI reporting:
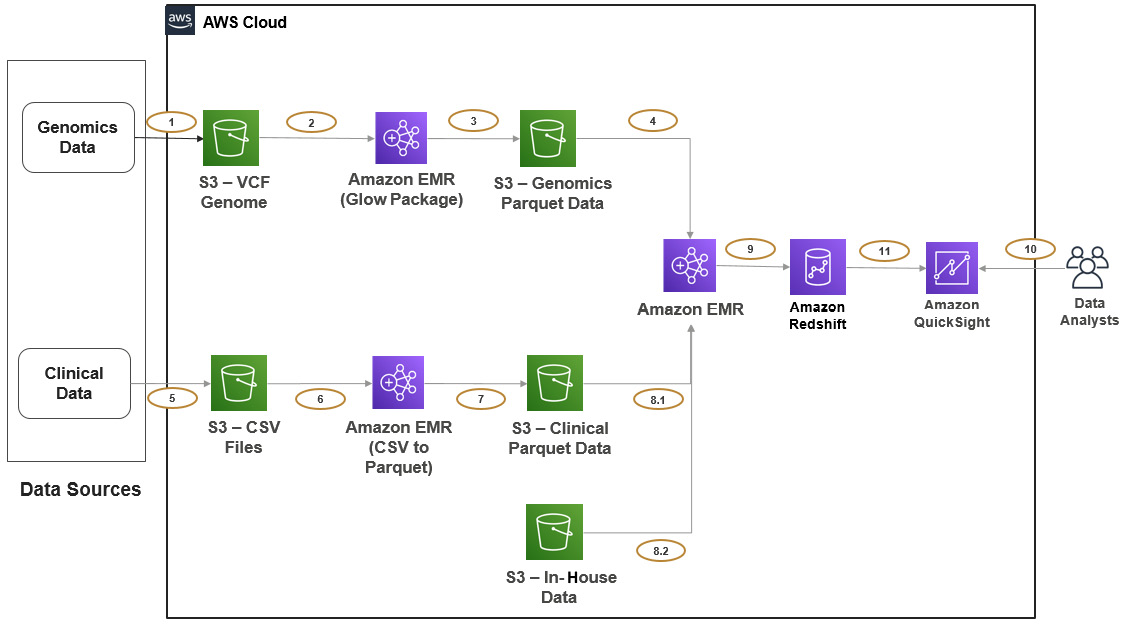
Figure 3.5 – Reference architecture for genomics data analysis
Before going deep into the architecture, let's understand a bit about the open source Glow package, which you can integrate into an EMR Spark job.
Glow is an open source utility that helps you work with genomics data and is built on Apache Spark, which can help in big data processing. It supports processing popular genomics formats, such as VCF and BGEN, and can scale with Spark's distributed processing. Because of its native Spark support, you have the flexibility to choose from the Spark SQL, Python, Scala, or R languages.
The following is an explanation of the architecture steps:
- Steps 1, 2, and 3 represent the data ingestion pipeline for genomics data that you receive from your external vendor. Step 1 represents your vendor writing genomics VCF files to your input S3 bucket directly and your objective is to parse them and convert them to standard Parquet format.
Steps 2 and 3 represent a transient EMR cluster that is scheduled to run a Spark job every day, which will read input data from the input S3 bucket, parse it through the Glow package, and write the Parquet to the output bucket with a daily partition (year/month/day). It moves the input files to a processed folder after successful transformation, so the next execution picks up the new files.
- Steps 5, 6, and 7 represent the data ingestion pipeline for the clinical data that you receive from another vendor. This is a simple pipeline compared to the genomics data pipeline, which reads input CSV files, converts them to Parquet, and writes output to an S3 target bucket with day-wise partitions. Here also, you can integrate a transient EMR cluster that runs a Spark job every day at midnight.
- Steps 4, 8.1, 8.2, and 9 represent another transient EMR cluster, whose responsibility is to aggregate all data sources, derive aggregate output, and push it to Amazon Redshift for further analytics or reporting needs. Apart from the vendor's genomics and clinical data, we also have in-house datasets in another S3 bucket. A scheduled EMR job reads data from all three input buckets and does transformations and aggregations using Spark.
- Steps 10 and 11 represent the integration of Amazon QuickSight on top of an Amazon Redshift data warehouse for building BI reports.
Now let's discuss a few best practices that you can follow while implementing the pipeline.
Best practices to follow during implementation
Here are a few generic guidelines that you can follow while implementing this use case; for sure there will be more use case-specific ones:
- Bootstrap action in EMR for additional library configuration: As discussed, there are several frameworks or utilities that support parsing genomics file formats. We have taken the example of Glow here, but you can integrate others, such as Hail. When you are in need of configuring external libraries in your EMR cluster, use its bootstrap actions, which will configure the clusters as needed while launching the cluster. When you have transient EMR cluster use cases like this, these bootstrap actions will help a lot as every time a cluster is launched, it will automatically configure external libraries in the required nodes.
- Distribution and sort key of Redshift: As discussed earlier, choose from the Key, Even, and All distribution styles for your data in Redshift depending on your query pattern or join scenarios. Also, see whether you need to use sort keys to let the Redshift optimizer choose fewer chunks of data while querying.
Now, let's look at the reference architecture for log analytics in detail.
Reference architecture for log analytics
Log analytics is a common requirement in most enterprises. As you grow with multiple applications, jobs, or servers that produce enormous logs every day, it becomes essential to aggregate them for analysis.
There are several challenges in log analytics as you need to define log collection mechanisms, process them to apply common cleansing and standardizations, and make them available for consumption. Each server or application produces its own format for logs and your job is to bring them to a format that you can use and use technologies to handle the heavy volume of log streams.
Use case overview
Let's assume your organization is on AWS and you have multiple applications deployed on AWS EC2 instances. These applications are written in Java and a few other languages and hosted through Apache or NGINX servers. You have the following three log streams that are generating logs continuously, which you plan to collect and make available for consumption:
- EC2 server logs: Each of your EC2 servers is generating logs that include CPU, memory usage, error logs, or access logs.
- Application logs: Each application is generating debug or error logs. For example, Java applications are generating logs through the Log4j framework.
- Apache or NGINX server logs: When applications are deployed or accessed through Apache or NGINX servers, they also generate access logs or error logs.
There are different teams in your organization that are interested in accessing these logs and they have their own preferred tools to access them. The following are the consumers:
- Security team: Your security team is collecting logs from different sources and is interested in EC2 access logs to make sure there is no unauthorized access and also that a hacking attack is not happening. They use Splunk as their tool for log analytics and would like to get these EC2 access logs into Splunk too.
- DevOps team: Your DevOps team is more interested in getting all software configuration information and also CPU and memory usage of the EC2 instances in real time to react to additional resource provisioning. Your DevOps team has their own Redshift cluster, on top of which they do further analysis and reporting. So, they expect the logs to be pushed to their Redshift cluster.
- Application team: The application team is more interested in analyzing their application logs to find common failure patterns. They prefer loading the application logs into an Amazon OpenSearch Service cluster, where they would like to do a regular expression or pattern matching search on the last 3 months of data.
Apart from these three teams, your organization has a requirement to archive all logs in Amazon S3 to compliance requirements.
Reference architecture walkthrough
Now, to provide a technical solution for the preceding use case, you can refer to the following architecture where all servers and applications will be publishing logs to KDS and EMR with a Spark Streaming job that can parse the logs and send them to the respective target depending on the log type.
Please note, all four targets we have here (Splunk, Redshift, Amazon ES, and S3) are also supported on Kinesis Data Firehose. The question may arise why we are not integrating Kinesis Data Firehose to read from KDS and write to the defined target—and, yes, that can be done—but EMR provides the following benefits over Kinesis Data Firehose:
- EMR with Spark Streaming will provide real-time streaming, compared to the near real-time streaming of Kinesis Data Firehose.
- You have different types of logs coming in, which might come through different partition keys of KDS. With EMR, you will get the flexibility to loop data by topic, apply respective transformation rules, and write to the target. If you use Kinesis Data Firehose, each delivery stream will receive all the data and you will have to integrate additional Lambda functions to filter by topic.
- As the number of log types and different targets increases, you will have to define more delivery streams by type. So, it may not scale in the future.
The following diagram shows the reference architecture of log analytics:

Figure 3.6 – Reference architecture for log analytics
Before going deep into the architecture, let's understand a bit about Amazon OpenSearch and Splunk, which are a couple of new components introduced in this architecture:
- Amazon ES: This is a fully managed service that facilitates the easy setup and deployment of the open source OpenSearch service at scale. You can do everything that you do with the open source OpenSearch service with native integration with other AWS services and cloud security built in. In our use case, it facilitates faster search with pattern matching. So, when you receive millions of log records every day, searching through them and finding patterns becomes key and the Amazon OpenSearch service is great at it.
- Splunk: This is a software platform, commonly used for log analytics or search use cases, that captures machine-generated data and indexes it for faster search. It also supports generating alerts, graphs, visualization dashboards, and so on. For this use case, we have assumed your organization's security team analyzes access logs using Splunk.
The following is an explanation of the architecture steps:
- Steps 1.1 and 1.2 represent publishing EC2 server logs to KDS, where you can set up and configure a Kinesis agent in each of the EC2 servers that will read logs from the server log file path and push to KDS with any optional buffering configurations.
- Steps 2.1 and 2.2 represent applications using the Kinesis Producer Library (KPL) to publish logs dynamically to KDS. For a few logging frameworks, you have native integrations to submit logs instantaneously to KDS using KPL.
- Steps 3.1 and 3.2 represent publishing application server logs using the same Kinesis agent approach that is being integrated for EC2 server logs.
- Step 4 represents the integration of Amazon EMR with Spark Streaming, which will read from KDS and write to different targets, depending on the log type or schema. Please note, as you have different log types with different schemas being ingested to the same KDS, you need a way to separate them. The best method you can follow is defining partition keys by log type in KDS and letting EMR loop through each partition key and define the target by log type.
This way, your EMR Spark Streaming code can decide whether the log type is an access log, then write to Splunk, and if it is an Apache log, then write to Amazon OpenSearch.
- Steps 5.1 and 5.2 represent an EMR Spark Streaming job writing to Splunk and Amazon Redshift.
- Steps 5.3 and 5.4 represent an EMR Spark Streaming job writing to Amazon ES for faster search, and then the integration of an Amazon OpenSearch Dashboard visualization on top of it for reporting dashboards.
- Steps 5.5 and 5.6 represent writing all the log types to Amazon S3 and accessing them through Amazon Athena's standard SQL query. Please note, when you write to S3, define folders or buckets based on log type and also use partitioning for better performance.
- Steps 6.1-6.4 represent the consumption layer, where different teams will use their respective tool's interface to access the data. Teams using Splunk and Redshift can access their console or APIs to access the data, whereas teams using Amazon OpenSearch can use Amazon OpenSearch Dashboard to access data or build visualizations on top of it.
Now let's discuss a few best practices that you can follow while implementing the pipeline.
Best practices to follow during implementation
Here are a few high-level guidelines that you can follow while implementing this use case:
- Configure source log types to partition the key and target: The major challenge we have here is publishing all types of logs with different schemas to one KDS. The first thing you need to define is what the different types of logs are that should be treated separately and map them to different partition keys of KDS so that your Spark Streaming consumer application can read by partition key and write to different targets.
The other thing you can do is use AWS Glue Schema Registry, which you can integrate with KDS to enforce a schema on your data. A schema of a record represents the format and structure of the data and AWS Glue Schema Registry helps to enforce the schema and provide a centralized place to manage, control, and evolve your schema.
- Scaling KDS and EMR clusters: You can use EMR's autoscaling or managed scaling features to scale your cluster up and down as the log stream data volume changes.
To scale KDS, you can take advantage of CloudWatch metrics, which will provide the read and write metrics of each shard of the Kinesis stream, and based on that, you can have your custom application or AWS Lambda function that will add or remove shards from your KDS cluster.
With this last use case, you have got a good overview of different use cases you can implement with Amazon EMR that includes transient and persistent EMR clusters.
Summary
Over the course of this chapter, we have dived deep into a few common use cases where Amazon EMR can be integrated for big data processing. We discussed how you can integrate Amazon EMR as a persistent or transient cluster and how you can use it for batch ETL, real-time streaming, interactive analytics, and ML and log analytics use cases. Each use case explained a reference architecture and a few recommendations around its implementation.
That concludes this chapter! Hopefully, you have got a good overview of different architecture patterns around Amazon EMR and are ready to dive deep into different Hadoop interfaces and EMR Studio in the next chapter.
Test your knowledge
Before moving on to the next chapter, test your knowledge with the following questions:
- Assume you are receiving data from multiple data sources and after ETL transformation storing the historical data in a data lake built on top of Amazon S3 and storing aggregated data in the Redshift data warehouse. You have a requirement to provide unified query engine access, where your users can join both data lake and data warehouse data for analytics. How will you design the architecture and which query engine you will recommend to your analysts?
- Your organization has multiple teams and departments that have different big data and ML workloads. They plan to use a common EMR cluster that they can use for their analytics and ML model development. Your data scientists are new to Amazon EMR and would like to understand how they can take advantage of this EMR cluster to do ML model development. What will your guidance be?
- You have a customer use case where you need to stream IoT device events into a data lake and data warehouse for further analysis. Because of cost constraints, your customer team is ready to compromise the real-time streaming requirement and is happy to wait for 5 minutes to 1 hour for the data to arrive. How will you design the architecture so that it's cost-efficient and at the same time solves the business problem?
Further reading
The following are a few resources you can refer to for further reading:
- Different EMR case studies (search for EMR): https://aws.amazon.com/solutions/case-studies/
- Redshift distribution style: https://docs.aws.amazon.com/redshift/latest/dg/c_best-practices-best-dist-key.html
- Read more about AWS DMS: https://aws.amazon.com/dms/
- Read more about AWS IoT: https://aws.amazon.com/iot/