
6. Defining the Six Sigma Program Expectations and Metrics
With Joe Ficalora
You’ve assessed your external realities and have a clear understanding of your company’s gaps in performance with your customers. You’ve done the research and decided that Six Sigma is the next major initiative. Now, before your official launch of Six Sigma, your leadership team must develop a clear and easily understandable set of expectations and metrics for the new Six Sigma program. This is to certify that internal actions associated with Six Sigma will be linked to financial targets and corporate strategies.
The metrics are sometimes the tricky part because sometimes we track the metrics of interest and sometimes we don’t. For example, a prominent metric associated with Six Sigma is the estimate of a process’s rolled throughput yield (RTY)—the percent of work units that make it through the process error-free. The RTY of an invoicing process of 80 percent means that 80 percent of the invoices processed make it through the process without any defects. Yet, 20 percent of the invoices are found to have one or more defects. Because invoice accuracy is closely tied to customer satisfaction, that 20 percent is a big number for large companies.
Not all the metrics are financial in nature, but they are ultimately linked to financial targets. For example, in 1995, my $4 billion sector of AlliedSignal had a financial target of $75 million to $125 million in pretax income. But we had other metrics and goals as well. The base operational metrics were rolled throughput yield (RTY), cost of poor quality (COPQ), and capacity productivity (C-P). Table 6.1 shows a summary table of these three metrics and how they were tracked quarter to quarter.
Table 6.1 An Example of Three Six Sigma Metrics, Goals, and Actual Performance
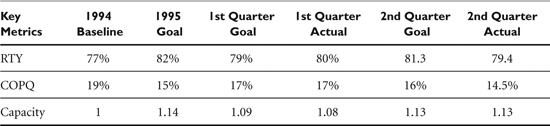
This table shows the three Six Sigma metrics. The starting points for each metric were the previous year (1994) baselines. The goals for 1995 were set for the year and prorated for each quarter. Actual results were reviewed each quarter. While none of these are true financial targets except parts of cost of poor quality, they are each linked to financial targets. RTY is directly related to margins because the fewer defects you produce, the better the margins. COPQ is directly related to margins because the less you lose due to waste, the better you perform. If the capacity goal is met (moving from baseline to adding 14 percent capacity), then capacity is related to additional revenue if your factories are capacity constrained (which ours were).
There were other Six Sigma metrics as well, but these three were the top metrics for our factories. Other Six Sigma metrics tracked were safety, customer satisfaction, materials management, and inventory. We ended up beating all the sector goals and our financial resources put the final number at $95 million pretax income for the year. That’s about equivalent to adding a $950 million business to the sector without any new people or capital. And these were the results that are reported directly to Wall Street.
Another large company (about $36 billion) set these three goals for Six Sigma:
1. Growth: $9 billion in additional sales.
2. Cost: Three-year saving = $1.0 billion.
3. Cash: $3.5 billion.
These goals would total more than $13.5 billion in three years. Talk about creating a positive sense of urgency.
But the important thing is to set aggressively clear goals because if you shoot low, you’ll hit it. Only by aiming high can you expect excellent results that will transform your company. My company worked with a large $7 billion company. By the end of the first year, I discovered the CEO’s goal for Six Sigma was $12 million. For a company that size, that goal was embarrassingly low. So, either the CEO didn’t understand the potential benefit of Six Sigma or was just doing Six Sigma to say he was doing it. I couldn’t help myself. I sent this CEO a letter.
Mr. John Doe
Chief Executive Officer
InfoSystems
Dear John,
We are closing on the second year of Six Sigma deployment, and InfoSystems has come a long way in moving toward becoming a Six Sigma company. We have enjoyed our relationship with InfoSystems, and Christine, her staff, and the operations folks have been a pleasure to work with.
I am certain that you will meet your 1999 financial goals of $12 million for the program. I would like to share some results from some of our other clients and suggest a more aggressive goal for InfoSystems for the year 2000.
One of our smaller clients (about $2B in sales) will bring in $50M+ from 200 Black Belts and Green Belts averaging about $200K per “Belt.” We’ve just launched a chemical company ($1.2B in sales) whose CEO is a former AlliedSignal business president. This CEO set a $50M goal for the year 2000 based on the results he obtained at AlliedSignal.
We are launching another $7B company whose COO is setting a goal of $100M for the year 2000. Another $4B company is setting a $75M goal. During my work with the $4B AlliedSignal engineered materials sector, we achieved $95M of pretax income the first year, $110M the second, and $160M the third.
John, frankly I think your 1999 goal was low. I don’t think your goal created the sense of urgency that is essential to make operational breakthroughs in your company. I recommend you announce soon that your expectation for 2000 is $100M in pretax income. You’ll see a totally different dynamic occur, and I think this goal will stimulate commitment and activity at a level you haven’t experienced before.
You move into 2000 with 150 trained Black Belts, some Green Belts, and several Master Black Belts and Master Black Belt candidates. With the continuation of Six Sigma training at the same level, you should have resources that, when brought to bear around an aggressive goal, will achieve results that will have a major impact on InfoSystems. A $100M goal equates to about 400 $250K projects. That is about two projects per Black Belt if you continue to train aggressively. Your Black Belts should be averaging between $250K and $750K per year. My consultants report that many of your Black Belts are attaining that level of performance.
Successful Six Sigma implementations have always been marked by the concept, “If you think big, you’ll get big.” Please consider my suggestion seriously. I want InfoSystems to be one of the few classic case studies demonstrating real breakthrough in performance using Six Sigma.
I’d love to discuss these ideas with you in the near future. Just let me know and I’ll be glad to visit.
Yours truly,
Stephen A. Zinkgraf, Ph.D.
Chief Executive Officer
Sigma Breakthrough Technologies, Inc.
Well, John easily achieved his $12 million goal and reported it to the Wall Street analysis. He did raise the goal for the next year to $56 million and got pretty close to that one. If he’d stayed at the $12–$15 million level, he would have lost about $40+ million for the year. In the Six Sigma business, it pays to think big.
Defining the Bottom-Line Six Sigma Program Expectations and Metrics
It is crucial that each leader set the priorities for the Six Sigma program before the outset or launch. Bottom line (productivity improvement), top line (revenue improvement), or customer satisfaction and participation targets need to be set and prioritized. Any Six Sigma program is distinguished by its results, and those results must be quantifiable. These results can be separated into expectations for the bottom line, the top line, and participants too. In the prelaunch phase, Executive and Champion workshops are completed to establish the priorities, plan out the program expectations, and define the strategic links and metrics. Don’t launch your deployment until the hard work of preparing the launch plan is done. This is one place where Ready-Fire-Aim will not work. Taking the time to aim the program at the right targets will pay off during the launch of the program.
Bottom-Line Expectations—Productivity and Efficiency Improvement
Without having experienced it personally, the numbers from Six Sigma at first seem unbelievable. That efficiency can be improved enough to generate the cash discussed next seems unrealistic at first. However, if you stop and think about how many chronic problems you have within your company that seemed too complex at first glance, you will arrive at a fairly good project list. Review this list, and you will get an idea of how much awaits you down the road to Six Sigma.
Financial Metrics. You will expect a return of about 1 to 3 percent of gross revenues in profit during the first 24 months of deployment. Setting such an aggressive goal requires determination and clear commitment from everyone in the organization. The leader can partition this goal between business units and functional groups using goal trees.
Here’s a $1B dollar company example: Goal is anywhere from $100M to $300M bottom line. At $250K/project, this is between 400 and 1,200 projects, depending upon size and scope. Each BB must do 3–4 projects/year. The training target to create the critical mass of Black Belts would be between 150 and 300 BBs trained over the first two years. Training Green Belts will add increased $$$. Figure 6.1 displays what this process would look like as a roadmap.
Figure 6.1 A $1 billion company sets a goal of $100 million. This is an example goal tree that shows the generation of three projects for one strategic thrust.
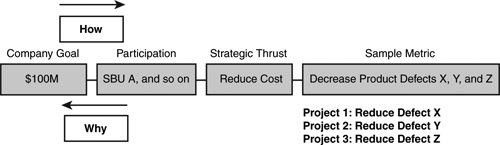
All bottom-line expectations are tied to dollars in one way or another. Dollars are often tied to labor and materials, but only at the project or lowest levels. At the deployment level, it is best handled with a goal tree linked to the strategic focus areas. Goal tree strategic categories and metrics are as follows:
• Productivity
• Operating income
• Delivery/speed
• Working capital, days sales outstanding (DSO)
• Cycle time reduction
• Health, safety, and environment
• OSHA reportable incidents
• Safety audit findings
• Environmental fines and warnings
• # Hazmat spills and calls
• Customer satisfaction/warranty
• Returns and warranty claims
• Satisfaction ratings
• Surveys
• Repeat purchases
• Percent new customers
• Growth
• Sales revenue
• Percent market share
• New market penetration
General Managers sometimes ask: “How many people will be reduced from the payroll?” By expecting this link, there is a traceable path to labor cost reduction claims. This “macro” view is unfortunately not fine enough to judge each Six Sigma project. The savings must be counted project by project and linked to key metrics that ultimately determine the business operational costs. The metrics come from the goal trees. Labor savings is only one part of the equation, and will eventually show up as business efficiency. Reducing head count might be a result of increased efficiency, but should not be a driver of it.
Key Metric—Defects per Unit. The traditional early Six Sigma metrics are related to defects and the causes of scrap, and rework. Eliminating defects directly improves productivity and customer satisfaction. By eliminating defects, cost and schedule variances improve. Motorola proved this with their original Six Sigma program. The general responses to the question, “How do I know I have defects?” usually lead to investigating nonconformance to expectations or requirements. Defects typically cause the following:
• Customer dissatisfaction and complaints with product or delivery
• Warranty claims or returns
• Rework or scrap or variance requests
• Late/early shipments
Not all defects are created equal. Defects are prioritized through the use of Pareto’s addressing frequency, count or occurrence rate, cost to business, and impact to customer. Defects are the key root causes to poor productivity and mediocre customer satisfaction. Defect rates of occurrence directly relate to whether or not an operation tracks defects rigorously on a day-to-day basis. If defects are not rigorously tracked, there is no way their type and frequency are known. And there’s no systematic effort to eliminate them.
Most operations, if they track defects at all, will track them at process testing stations or at final product test. The weakness of that approach is that most of the defects that occur are not considered. If an operator creates a defect and then fixes it, that defect will never show up in the system.
The common metric for tracking defects is defects per unit. The formula is DPU = (Total Defects/Total Units Processed). If DPU is chosen as a metric, most organizations will require the establishment of a defect tracking system. Within the first year of Six Sigma at Motorola, almost all operations had installed a defect tracking system. Just by doing that and making defects visible, a noticeable improvement in operations was immediately apparent.
DPU is also a component of a more robust metric, rolled throughput yield (RTY). RTY represents the percentage of units processed that had no defects. The calculation is pretty straightforward. Figure 6.2 shows the First Pass Yields of each step in an actual automotive tire manufacturing line. The First Pass Yields are equivalent to DPU, but is usually oriented more toward testing results.
Figure 6.2 The First Pass Yields for each process step when manufacturing car tires and the resulting RTY.
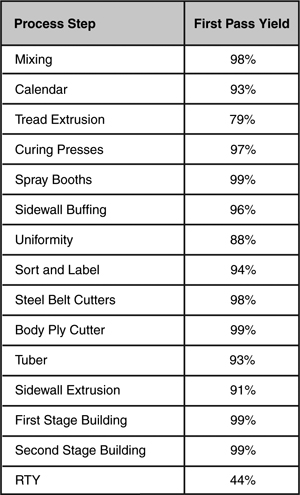
This chart shows that, except for one step, the yields are well over 90 percent. But, when you inspect RTY at the bottom of the chart, you see that only 44 percent of the tires go through this process without a recorded error. That means a huge amount of time is spent on fixing tires instead of shipping tires. RTY is calculated just by multiplying the First Pass Yield at each process together (.98 × .93 × .79....). And you can clearly see that the first place to work would be the Tread Extrusion process, the process with the worst yield.
During the early years at Motorola (the late 1980s), every manufacturing line could review and report the data listed in Figure 6.2 almost in real time. Very few companies have that capability. The ability to document defects in real time and investigate their structure to drive improvement activities was a way of life. Common defects in several functions are listed after Figure 6.2. Needless to say, DPU is a terrific operational metric. But most companies will be required to implement a defect tracking system before DPU can be effective. These systems are simple, straightforward, and not difficult to implement. The hard part is getting everyone to put in every defect they encounter.
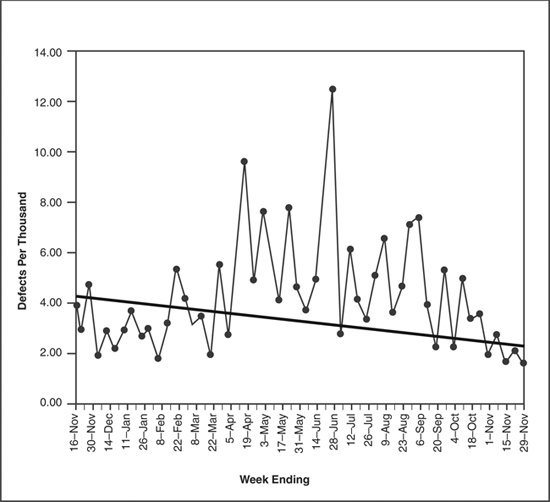
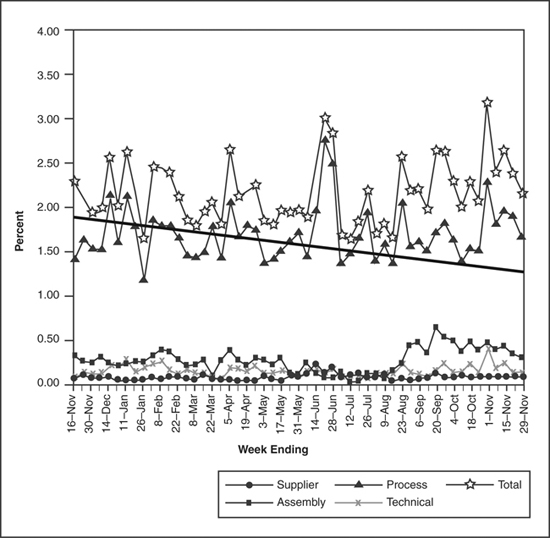
Figure 6.3 shows a typical trend chart for DPU. In this case this chart documents defects per 1,000 units. The Six Sigma goal line is also shown, and you can see that defect elimination projects do not seem to be working well, but there is a nice downward trend toward the end of the time period. This chart is similar to those used in Motorola.
Figure 6.3 Example trend chart for defect per unit with a goal line.
1. Some Manufacturing Defect Examples:
a. Burrs or chips
b. Scratches
c. Component placement
d. Contaminants, dirt, stains
e. Mislabels, missing labels
f. Wrong color, wrong options
g. Wrong packaging
h. Missing items
i. Supplier base defects
2. In General Business Process Defects:
a. Missing information
b. Missing signatures
c. Wrong information and typos
d. Wrong routing of information
3. In Service Business Defects:
a. Banking and finance
i. Missing info on mortgage application
ii. Wrong info on mortgage application
iii. Missed signatures in sign-off loop
b. Healthcare
i. Incorrect diagnosis due to missing patient information
ii. Missed allergy notations resulting in wrong antibiotic
c. Transportation
i. Wrong airline luggage tag
ii. Overbooking seats
iii. Missing special meal annotation
iv. Missed arrival times
d. Utilities
i. Wrong meter reading
ii. Incorrect billing statement
iii. Misapplied credits
i. Unnecessary repairs due to wrong diagnosis
ii. Missed warranty coverage (customer pays instead of manufacturer)
f. Restaurants
i. Wrong food order
ii. Incorrect food bill
iii. Unavailable selections
4. In New Product Introductions Defects:
a. Errors on drawings or prints
b. Missing information on drawings
c. Late release
d. Missing start-up information
i. New capital equipment omissions
ii. New manufacturing or supplier capability omissions
iii. New supplier qualification omissions
Key Metric—Scrap. This metric is sometimes a good place to start because most MIS systems will at least capture scrap in a manufacturing environment. This is harder to measure in a business process and may not be readily available in those situations. But scrap is surprisingly of sufficient magnitude to adversely affect productivity. Here are some examples of things to measure in the category of scrap:
1. In Manufacturing:
a. Final test rejects in assembled products
b. Rejected batches in chemical industries
2. In Business and Service Processes:
a. Rejected applications
b. Rejected forms and submittals
c. Missed rate lock for mortgage
d. Special request denials
e. Wrong repair done on a car
f. Incorrect installation of copy machine
g. Food refused at a restaurant
3. In New Product Introductions:
a. Product recalls
b. Market flops
c. Product cancellation
Figure 6.4 shows a typical trend chart for scrap over a given period of time. There is also a goal line shown. You can observe the effectiveness of reducing scrap quickly. For this operation, scrap is high and stable. The efforts to reduce scrap have not been implemented well or designed well. But, at least they know and can make adjustments.
Figure 6.4 Example trend chart for scrap with a goal line.
Key Metric—Rework. Rework is typically easy to find in a manufacturing environment, but it is generally not tracked very well. The only detriment in measuring rework is that it takes an outside set of eyes to really see what is reworked because we become blind to rework when it is stable and has been there a while. Rework is also an issue in business processes, such as in redoing a contract because essential elements were omitted. Here are some examples of rework.
1. In Manufacturing:
a. Readjustment of subassembly
b. Adjust-at-test items
c. Reformulation of chemical batches
d. Reprocess for contaminant removal
2. In Business Processes:
a. Reapply for mortgage
b. Fixing wrong restaurant bills
c. Food sent back at restaurant for additional cooking/preparation
d. Rescheduled airline flights and crews
3. In New Product Introductions:
a. Engineering change notices
b. Repricing after launch (sales promotions)
c. Field repair tickets
Top-Line Expectations—Effectiveness and Value Proposition
We’re in the business of producing product and services that are the most efficient and effective, and those with the highest value proposition generally get rewarded in the marketplace. The impacts are two: market dominance and command of a higher price.
Top-line expectations are the most difficult to meet. These expectations capitalize on the linkages between external realities of the market and internal activities to remedy market gaps. How do you know where you stand with regard to effectiveness in closing the gaps and your current value? Look for metrics like these:
Strategic Thrusts and Key Metrics:
1. Revenue:
a. Top-line sales growth
2. Percent Revenue from New Products:
a. On market for three years or less
3. Market Share:
a. Percent core market ownership
4. New Market Development:
a. Entry into existing markets
b. Market capture of new markets
5. New Customers:
a. Percent who used to purchase from competitors
b. Percent who never owned/purchased before
6. Percent Repeat Customers
7. Percent Lost Customers
Six Sigma Participation Expectations
Participation expectations are determined within the goal trees. All divisions and functional groups will ultimately participate, and a phased participation is fully acceptable. Most Six Sigma deployments represent “All or some.” Some business units may have priorities that will impede a new deployment, such as reorganization or SAP deployment, or perhaps they have just been merged with your organization and other changes are needed prior to deploying Six Sigma. In your program plan, you may want to have two or three phases to communicate with the organization when certain businesses or functional groups begin deployment.
1. Percent Business Units Participation:
a. All business units should be deploying Six Sigma.
2. Percent Functional Groups Participation:
a. All functional groups should be participating in Six Sigma.
3. Black Belt/Green Belt Percent Time Dedicated:
a. 100 percent for Black Belts.
b. 50 percent for Green Belts.
4. Black Belt/Green Belt Weekly Champion Meetings:
a. Every Belt has weekly Champion meetings.
b. Champions hold best-practice meetings quarterly or monthly at the beginning.
5. Black Belt/Green Belt # Sponsor Meetings:
a. Monthly.
b. Quarterly.
6. Number of Champion Project Reviews.
7. Percent of Annual Training Plan Complete.
8. Leadership Kickoff/Close at Training:
a. Management level.
b. Percent participating.
Measuring participation is not easy. But setting aggressive financial targets and other metrics will tell you whether everyone is on board or not. Nothing surpasses the energy as being there and asking the right questions. Several CEOs I know (Larry Bossidy, Fred Poses, George Fisher, and Paul Norris) were known for their extensive travel throughout their company and arriving at each destination with good questions about the Six Sigma deployment.
Selecting the right metrics—financial and performance—and expecting the right participation is the foundation upon which you will build your Six Sigma deployment. Get these two components defined before you launch your deployment, ensuring that all are talking off the same script.