
A. Case Study
Give a man a fish and you feed him for a day. Teach a man to fish and you feed him for a lifetime.
—Chinese Proverb
In this appendix, we put all of the previous thoughts and discussions to use in a case study format. From May 11–13, 2015, IBM held one of its largest conferences titled “IBMAmplify.” This event focusing on marketing, analytics, selling, and fulfillment was designed especially for IBM Commerce clients. Our hope was that with over 3,000 attendees encompassing 20 tracks and more than 200 sessions, the amount of information (and hopefully opinions) shared there would be substantial, and we might be able to derive some interesting insights from this conference. According to the marketing material for this event, “Everyone from thought leaders, product experts, and industry peers will be providing tips and strategies for creating amazing customer experiences across channels, leveraging buyer behaviors and analytics to deliver targeted interactions at every touch point.” Consequently, the real question for us is:
What were the key insights or thoughts expressed by the attendees both during and after the event?
If you recall, we divided social media analytics activities into three broad phases:
![]() Data identification
Data identification
![]() Data analysis
Data analysis
![]() Information interpretation
Information interpretation
We approach the discussion of the case study in the context of these phases.
Introduction to the Case Study: IBMAmplify
There were four main themes to the IBMAmplify Conference: eCommerce, Marketing, Customer Analytics, and Merchandising. The eCommerce track focused on the creation of unique brand experiences across all marketing channels for both business-to-business and business-to-consumer. Among the many topics discussed were best practices, trends in eCommerce, and techniques and strategies to help businesses obtain the most from their implementations. Many of the sessions were advertised to include topics such as proven strategies, architectural considerations, case studies, and hands-on skills workshops to help attendees deliver the best customer experience from engagement to fulfillment as well as post sales service.
Customer analytics focused on optimizing the customer experience while understanding the customer journey. The sessions for this track covered best practices and strategies for applying digital, social, and predictive analytics to help users accelerate profitability and improve their business outcomes. The Marketing and Merchandizing tracks focused on business use cases and product demonstrations for generating positive marketing results across a number of areas in the organization.
Data Identification
Early on we examined the concept of data identification when we discussed the need to verify that we could collect enough data to allow us to perform an analysis that could produce meaningful insights or conclusions. Normally, before undertaking a study such as this, we would perform a number of queries and data collection steps to understand how much data was available for our project. In this case, we were lucky enough to use our real-time analytic engines (discussed in Chapter 8) to watch Twitter for mentions of content around the hashtag #ibmamplify (the identifier used at the conference). Because we did that, we were able to look at some of our descriptive statistics produced by our InfoSphere Streams environment to understand approximately how much data we would have.
A quick look at the number of tweets that we captured and analyzed during the event revealed that we had over 30,000 tweets. This is not an overwhelming amount of data and points to the fact that we will need to bring in more data from other social media venues. However, it is enough to get a feel for what a larger sample may look like. In our experience, it is difficult to create general benchmarks of how much data is sufficient. This really depends on the project at hand. When we are looking for potential security threats in a data stream, even a small amount of data is good enough. On the other hand, when we are looking for which fashion trend is most popular among shoppers, we might need a larger amount of data. For the purpose of this case study, we determined that this data set was sufficient to give us the flexibility we needed to analyze the data in multiple ways.
Part of our real-time analysis included the categorization of tweets into topic areas. We decided to review this to understand what our data sources may look like. Figure A.1 depicts the tweet counts for the various topics over a nine-day period from May 6 through May 14. Even though the conference itself was held from the May 11 through May 15, we chose to collect data several days prior to the event to watch as discussion of topics increased heading into the event.

Not surprisingly, the number of tweets or discussions that pertained to the concept of “customer” far exceeded all others. We’ll come back to the topics of conversation later; at this point, we were more interested in the relative amounts of data and the time frame. The horizontal axis of the graph in Figure A.1 represents data points from days 1 through 9; this represents the nine-day range of our data query with May 6 as day 1 and May 14 as our day 9. Again, not surprisingly, many of the topics peaked at the start of the conference, although topics such as mobile computing and workforce seemed to peak toward the end.
One of the issues we raised early in our discussions on data was the location of people posting content and the language used. Normally, this is an issue when we have an international event or some event is generating reactions worldwide. We understand that people from around the world attend conferences in the United States, but our assumption would be that most of the attendees travel domestically; thus, the predominant language that we would have to analyze would be English.
Using our set of descriptive statistics from InfoSphere Streams (see Figure A.2), we can see that the bulk of the tweets we collected were in English.
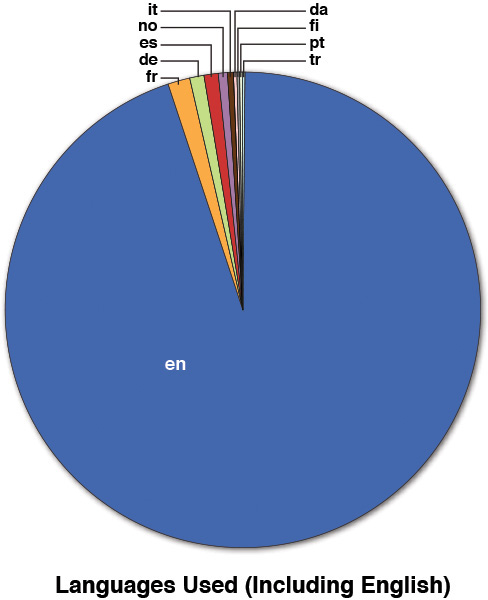
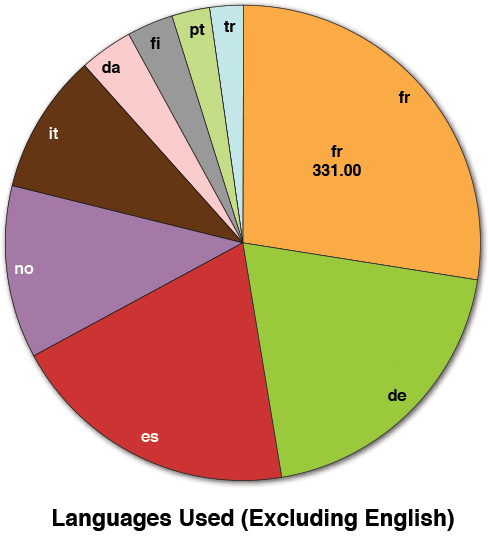
Removing the dominant data point in the graph (English) produced the pie chart shown in Figure A.3, and from that, we can see that the next dominant language used was French, with only 331 tweets over the nine-day period. With our whole dataset containing over 30,000 tweets, that means French language tweets made up approximately 1% of the dataset, and as such, we chose to exclude those tweets from any analysis needing translations (sentiment, and so on). The other languages quickly fell into amounts that were less than 1% and were therefore deemed as negligible. Note that this doesn’t mean those tweets or data items were unimportant. We were doing this as a quick study; for a more complete analysis, we would probably look closer at the tweets in French, German, and Spanish (the top three languages after English) simply because together they represent about 3% of the sample. However, due to time constraints, we stuck with just the larger portion of the dataset.
In Chapter 3, we discussed the potential need to understand who is “talking” in the many analysis projects that we executed. In the case of an IBM-sponsored event, we think this is a critical issue. If we were just to analyze all of the data collected around an event without understanding who was saying it, we might end up with a biased insight. In this case, we wanted to understand if an IBMer or a group closely aligned with IBM was having an impact on the social media conversation. This is just “good” scientific discovery. If we analyzed the tweets and came to the conclusion that the latest IBM product introduced into the marketplace was being perceived as the “greatest thing since sliced bread” (a U.S. colloquialism based on a slogan used by Wonder Bread, indicating a relatively recent invention that is likely to significantly improve people’s lives), we might want to be sure IBMers weren’t promoting that idea. It’s not a “bad” thing if they think their company’s products are significantly better than others, but from a business perspective, it’s probably much more important to understand IBM’s customer’s viewpoint instead.
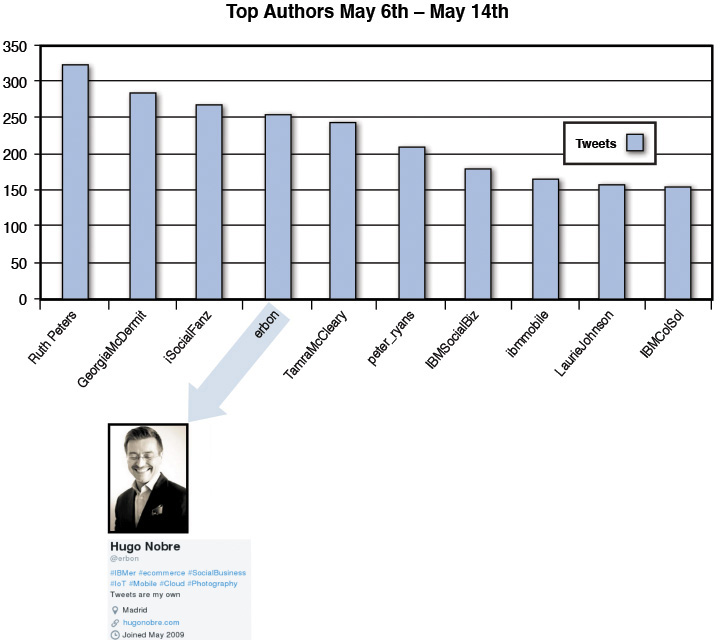
So again, using our descriptive statistics, we looked at the top authors in the sample of data to identify any IBMers who might be promoting their viewpoints. Figure A.4 is a graph of the top authors in Twitter for our datasets. These are essentially the people tweeting the most in our collection of data.

Obviously, some of them are IBM-specific Twitter handles (IBMSocialBiz, ibmmobile, IBMColSol). More than likely, the tweets coming from those accounts contained a marketing message of some kind; however, they may indeed contain some social commentary. So for that fact, we didn’t exclude them from our analysis just yet, but they became data points in our collection that we marked as “sympathetic to IBM” (or related to IBM) if we detected an overly positive or negative viewpoint in our analysis.
We may also want to look at the other top tweeters to see if they are IBMers as well. Sometimes this task is easy, other times it’s difficult, and sometimes it’s impossible. For the sake of an unbiased analysis (or the best you can do), it could be worth the effort to understand if those “talking” about you or your brand are potentially biased.
With Twitter, this task is pretty easy. For this case study, we just took our top tweeters and looked at their profiles. In our case, if they identified themselves with IBM or a business partner of IBM, we simply marked them (as we did the others). If they revealed themselves as overly relevant in a conversation, we could make an informed decision about the analysis. See Figure A.5.
Taking a First Pass at the Analysis
Rarely do we define a data model for an analysis and not make changes to it. Our case study is no exception. For our first pass at the data, we decided to look closely at the conversations surrounding the Cloud-Analytics-Mobile-Social-Security (CAMSS) themes because those seem to be hot topics in and around IBM today. Also, since we had created our real-time analysis of conversation themes based on InfoSphere Streams, we knew that a good portion of the dataset included those topics.
The first step in analyzing the data is to define the data model, or the organization of text and keywords, into meaningful buckets. Using IBM’s Social Media Analytics (SMA) offering, we defined about eight themes that we believed were being discussed at the conference. As we said, all models will evolve over time, and we fully expected this one to as well. We had to start somewhere, and as Lao Tzu said: “The journey of a thousand miles begins with one step.”
For our model, the “buckets” (or themes, as they are referred to in SMA) consisted of the following topics:
![]() Analytics—This includes discussions around Cognos or any of the IBM Watson analytics tools. Any mentions of insights or analysis would indicate discussions in and around this theme.
Analytics—This includes discussions around Cognos or any of the IBM Watson analytics tools. Any mentions of insights or analysis would indicate discussions in and around this theme.
![]() Customers—The IBMAmplify conference was centered around the customer experience, so we thought creating this theme might be interesting to create to see if there was any discussion around customer use of IBM tools or services.
Customers—The IBMAmplify conference was centered around the customer experience, so we thought creating this theme might be interesting to create to see if there was any discussion around customer use of IBM tools or services.
![]() Mobile—This is a fairly self-explanatory topic; it involves any discussion around the use of mobile technologies or applications.
Mobile—This is a fairly self-explanatory topic; it involves any discussion around the use of mobile technologies or applications.
![]() Cloud—This includes discussion around moving applications to the cloud as well as comments made around SoftLayer or cloud suppliers such as Amazon Web Services (AWS).
Cloud—This includes discussion around moving applications to the cloud as well as comments made around SoftLayer or cloud suppliers such as Amazon Web Services (AWS).
![]() Security—Obviously, anything around the topic of security or breeches in security is included.
Security—Obviously, anything around the topic of security or breeches in security is included.
![]() Social—Interestingly, we monitored social media for discussions centered around the use or exploitation of social media (for advertising, communication, or brand awareness).
Social—Interestingly, we monitored social media for discussions centered around the use or exploitation of social media (for advertising, communication, or brand awareness).
![]() Workforce—Before we started our analysis, a quick look at the Twitter data showed some mentions of the millennial workforce, so we added a theme to determine if there was anything of interest around that topic.
Workforce—Before we started our analysis, a quick look at the Twitter data showed some mentions of the millennial workforce, so we added a theme to determine if there was anything of interest around that topic.
![]() Design—IBM has recently published its design thinking language. IBM Design Thinking is a collection of design practices that identify and ideate on the aspects that make a solution desirable to its users. Because the use of Design Thinking from IBM is relatively new, we decided to see if there was any reaction in the marketplace (and specifically at this conference).
Design—IBM has recently published its design thinking language. IBM Design Thinking is a collection of design practices that identify and ideate on the aspects that make a solution desirable to its users. Because the use of Design Thinking from IBM is relatively new, we decided to see if there was any reaction in the marketplace (and specifically at this conference).
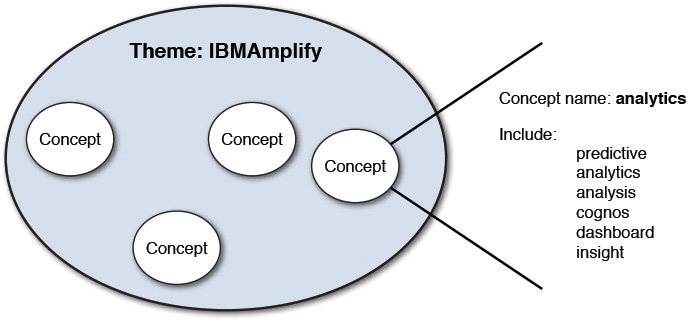
In IBM’s SMA product, a concept is a topic area that is specific to a particular use case (or in our case, a topic under study). A theme is composed of a group of concepts that describe the theme and are typically analyzed together. In SMA, concepts determine the parts of a document that are extracted from a larger body of information that then forms snippets. A snippet is the specific part of a document (remember the word document is used generically here to refer to a blog, website, or any other source of social media input) that matches one or more concepts within a theme. A snippet consists of the sentence that contains the concept and the sentences that surround the sentence that contains the concept.
The configuration of a concept specifies the terms that must be included, additional terms that must also appear (to provide context), and terms that must not be included. IBM’s Social Media Analytics uses the theme and concept definitions to retrieve the documents and create the snippets.
The creation of themes can be thought of as creating a number of buckets, or categorizations of topics. So if we create a theme of mobile, what we have to do is decide what words, when used, are being used in the context of mobile computing. Some of the first words that come to mind are the following:
![]() iPhone
iPhone
![]() iPad
iPad
![]() Samsung
Samsung
![]() Android
Android
This is not an exhaustive list of keywords, but it is a set of words or phrases that, when used, probably refers to the theme we have defined.
Up until now, we’ve tried to stay away from specific screen shots of products, but at this point we decided it might be more beneficial (or meaningful) to show what we mean. For example, Figure A.6 illustrates our first iteration on the definition for the “Design” theme.
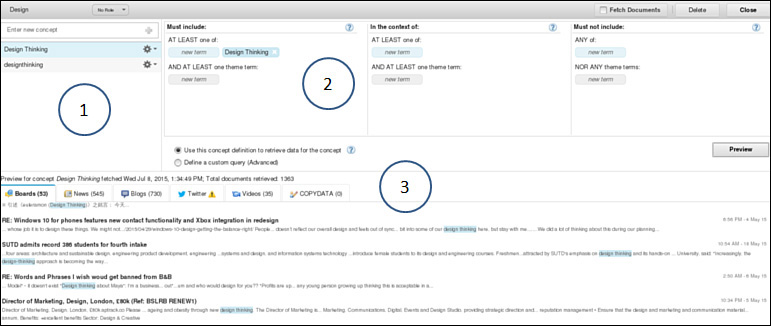
In this case, we created the theme Design (labeled 1 in Figure A.6), and in that theme, two concepts that represent conversations around that theme are defined. As an example, in Figure A.6, we show the concept Design Thinking, which captures any social media that’s gathered containing terms or phrases related to design thinking, which is included in the theme of design. Later, we use this to understand the relationships between concepts. (For example, is there a strong relationship between the theme cloud and the theme design thinking? In other words, when people talk about cloud, how much of that conversation is around the use of design thinking to build and support applications in the cloud?)
The section labeled 1 in Figure A.6 shows the text elements that match the keywords specified in section 2. In this case, we were looking for any text that contained the phrase design thinking. We also included additional terms such as UCD and phrases such as user centered design in this grouping. If you recall the value pyramid we introduced in Chapter 2, the idea is to gather as much relevant data as possible to enable the analysis to be more complete. To help with the relevancy, SMA attempts to “look ahead” and provide an example of the type and quantity of text that would match this configuration (section 3 of Figure A.6). Again, in the case of IBM’s SMA product, there is a close tie with Boardreader, a third-party social media aggregator, that will source the data for our analysis.
As you can see, we are able to be fairly specific about the phrases and what they do and do not contain within the string of text under analysis. For example, consider the tweets in Figure A.7 that are around the word cloud. It’s clear that they refer to weather or climate, so the use of the “exclude” clause in the example in section 2 of Figure A.6 would be helpful (that is, it must not include any reference to the word weather).

In our case, we didn’t have to worry about this issue too much. Remember, we started with a set of captured data that included the words IBMAmplify or IBM Amplify, so the assumption we made going into our analysis was that any theme we identified by concept matching would be correct and unambiguous. To put it another way, since the data set refers to IBM and one of its conferences, if the word cloud was used, we assumed it referred to cloud computing, or as in the case of Figure A.6, if the phrase was design thinking, it was just that—IBM’s latest use of the Design Thinking methodology. This relationship between SMA themes/concepts and the keywords is illustrated in Figure A.8.
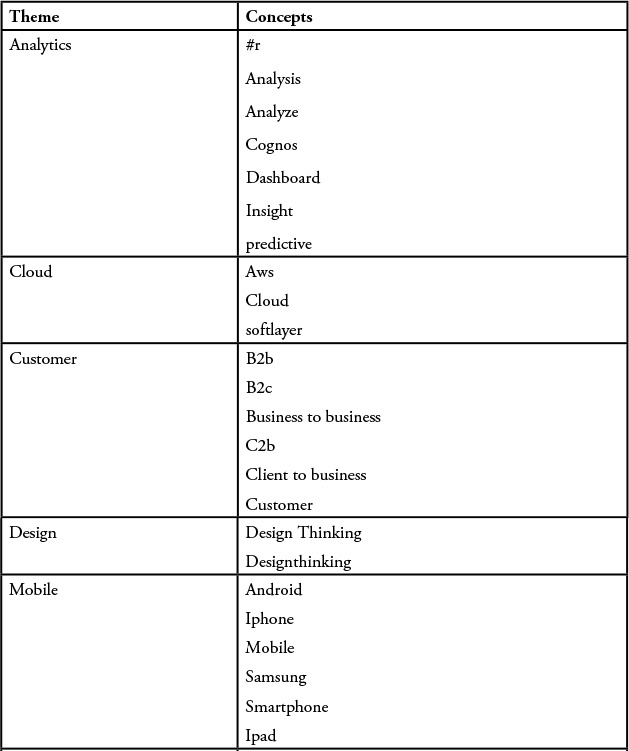
When we build a data model, we start with high-level themes, or topics of conversations. Those topics are composed of the ideas or specifics of the conversation—something we call concepts. Consider a discussion about cloud computing. While discussing cloud computing, we could focus on the merits of moving or migrating applications to the cloud versus applications that are “born on the cloud.” Each of those topics would be considered a concept that may be discussed in conversations involving cloud: migration or born on the cloud.
How people discuss those concepts and what words they use when talking about those concepts are the key words we want to configure into our model. So for a concept like migration, we might look for keywords such as existing application, legacy code, or standalone program, terms that, when used in the context of cloud computing, would imply a migration or movement to the cloud.
Our first model ended up looking something like Table A.1.

Data Analysis
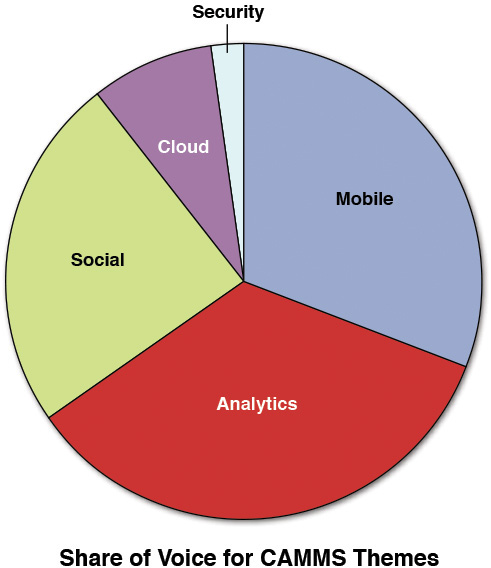
In our data analysis phase, our first inclination was to look at the discussion around CAMSS topics. So after our first analysis was done, we attempted to assess which was the most talked-about topic of the five disciplines (see Figure A.9).
The graph in Figure A.10 shows that analytics was the most talked-about topic followed by discussion of social media and mobile solutions.
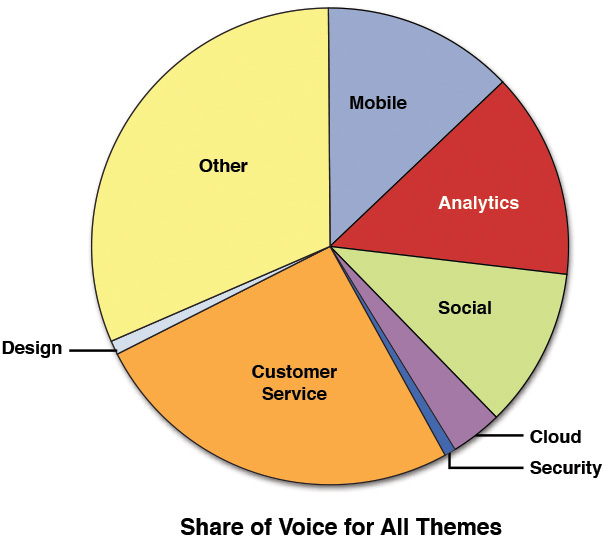
However, if we look at the same data and take all of our themes into account, the discussion around CAMSS resulted in only 42% of the total conversations (refer to Figure A.10). Themes around customers and the “other” category (those that didn’t fit within our defined themes) accounted for about 58% of our dataset.
We also looked closely for relationships between some of our defined themes (for example, between mobile and analytics), but we didn’t find much in the way of relationships or common discussions. A quick look at the data did seem to show, for example, that at times there was discussion around Apple and mobile or Apple and other topics, so perhaps some of the defined themes and concepts we created were too specific.
One of the more informative tools in IBM’s SMA product is the Evolving Topic analysis. An evolving topic is a set of words of phrases that appear in many samples of a dataset and appear to be an active area of conversation (simply due to the number of times the words or phrases are mentioned).
Using the evolving topics graph (see Figure A.11) from our analysis, we can discover new themes or concepts in our dataset that we may not have considered in the creation of our themes/concepts. Looking closely at Figure A.11, we can see there were discussions around companies and commerce that we hadn’t considered, as well as phrases such as online sales and tools and very little mention of the CAMSS topics we were so actively looking for.
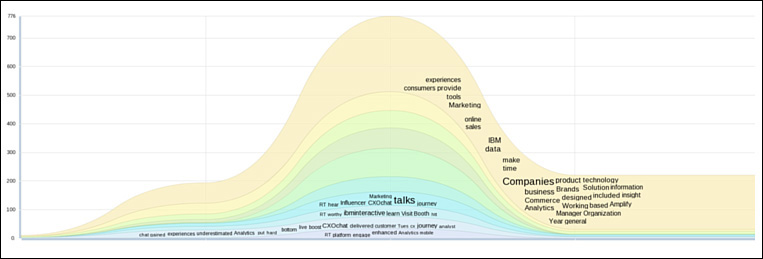
Clearly, we needed to revisit the model.
A Second Attempt at Analyzing the Data
A closer look at the website that announced the conference revealed a number of new areas of interest that could be added to the model. The conference had a number of predetermined tracks that we used as the basis for the model expansion. As a result, we enhanced the model with additional themes that included E-Commerce, Merchandising, Marketing, and Customer Analytics. As we said, our initial focus area was CAMSS (Cloud-Analytics-Mobile-Social-Security) because we wanted to understand the “share of voice” around these areas. This iteration of the model, in which we ended up mixing CAMSS topics with themes highlighted by the conference, created overlaps between our themes. As a result, we lowered the signal, or the strength, of the relationships. We asked our analyst to create a view of the model to separate out only CAMSS topics.
At the same time, when revising our model, we realized that we were narrowing our analysis by insisting that only comments that also referenced IBMAmplify be included as part of a theme in our concepts. This is partially an artifact of how IBM’s SMA produces what it calls snippets of information to be analyzed. Snippets, which are created at the theme level, consist of a small text segment that surrounds a concept match in a document. As mentioned previously, a snippet consists of a sentence or set of phrases that contains the concept and the sentences that surround the sentence that contains the concept. As a result, each snippet can contain more than a single concept.
Inside IBM’s SMA, snippets are obtained from various online media sources, such as blogs, discussion forums, and message boards, Twitter, news sites, review sites, and video sites. The content of these sources might be detailed and unstructured, and much of it might be unrelated to the topic of interest. Snippets represent the text segments taken from the documents that are relevant to the theme under analysis.
Information Interpretation
Our new model provided a better representation of the conversations being held at the conference. Even though we abandoned the first data model, much of the earlier analysis shown in Figures A.1 and A.2 is still valid; however, now we can look at them in a more appropriate context. We can see from Figure A.12 that most of the CAMSS topics had a good representation in the discussion, which we had initially assumed would be dominant.
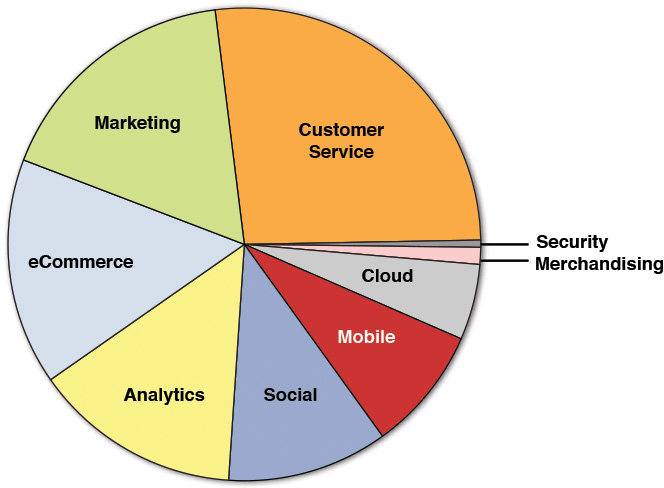
While there appears to be a decent distribution around Mobile, Analytics, eCommerce, Marketing, and Customer Service, some of the lesser-discussed topics were surprisingly around themes such as security and merchandising. Not surprisingly, given the theme of the conference, topics around customer and customer service were strongly represented.
While it’s interesting to understand what’s on the mind of the attendees, we wanted to dig a little deeper and see if we could find interesting insights or topical areas that might be of interest. One great way to do this is to look at an affinity matrix.
An affinity matrix looks at how closely two dimensions (or attributes) are related to each other. This can help us gain some insight into the strengths or weaknesses of the discussions. It’s also a way to identify potential opportunities to discover conversations that we hadn’t thought were occurring (or just hadn’t considered). According to IBM’s documentation, the affinity matrix algorithm in its SMA product estimates how often two dimensions occur together or if they were independent (referenced near each other in the conversation).
In an affinity matrix, we want to look for areas with a high number of references, but areas that also show a high degree of affinity. For example, in Figure A.13, the concepts of customer and customer service (labeled item 1 in the matrix) have a high number of references (1,210) and a high affinity. That is essentially a false positive, because every time someone uses the term customer service, she is by default using the term customer as well. Basically, the two words are right next to each other, so the affinity is high.
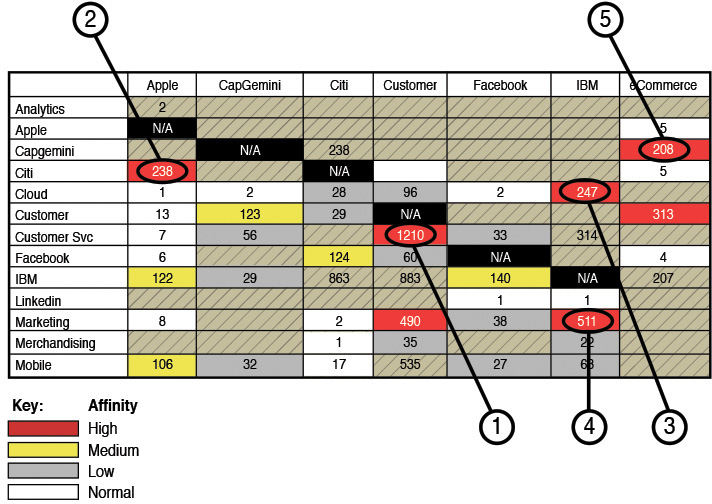
The first thing we noticed was the affinity between apple and citi (labeled 2 in Figure A.13). We had expected to see Apple mentioned more around mobile (and indeed there was a higher than normal affinity between mobile and apple, but not as strong as we expected). While there was a large amount of discussion around IBM and Apple’s various partnerships, what stood out in the conversations was how Citibank had created an Apple Watch application, which leveraged IBM’s Design Thinking. There were several references to the fact that a number of features were delivered in a relatively short time (crediting design thinking) and pointing to the industry trend of rapid creation of user center applications.
We were not surprised to see the concept (or term) IBM used in a high affinity with other terms given this was an IBM-sponsored event. As we said previously, we wanted to be sure to take any trends we uncovered and give more weight to those being discussed by non-IBM employees rather than IBMers.
Right away, we saw IBM being referenced with a high affinity to both cloud and marketing (labeled 3 and 4 in Figure A.13). Again, with the hype around cloud computing and IBM’s rich portfolio in this space, this outcome was not surprising. Looking at the data, however, we found a very large set of discussions happening around IBM’s latest entry into this market. IBM is moving toward a combination of SaaS/On-Premise offerings, what some would call a “cloud hybrid.” Interestingly, many of the attendees were referring to this as IBM Marketing Cloud. So again, we saw a high affinity between the terms IBM and Cloud and IBM and Marketing (areas 3 and 4 in the affinity matrix in Figure A.13). Clearly, IBM was getting some good coverage of this offering as the data surrounding the topic was fairly overwhelming. As a matter of fact, one of the findings we came up with was to do yet another pass at this model (or perhaps a separate model) looking at just cloud and the applications/services around it. We saw references to a wide variety of products and services (products such as Tealeaf or services such analytics and engagement all used in and around the conversations of cloud).
Finally, one of the other interesting insights we were able to observe was the frequent association between a company called CapGemini and the topic of eCommerce (notice section 5 in Figure A.13). While there were a number of vendors at the conference, it’s clear that CapGemini was referenced more than others. This may be an artifact of the company’s popularity or its knowledge and use of social media. In any event, most of the discussion around eCommerce was centered around (or had a high affinity) with CapGemini. There was a relatively high affinity between customer service and eCommerce as well. A quick set of searches revealed deep discussions around CapGemini and comments about presenting flexible presentation layers to customers and intelligent commerce applications. These were all positive comments by or about CapGemini, so clearly this company was standing out in the drive for customer service and eCommerce—a message it made loud and clear !
Conclusions
Like most of the analysis we do, we tend to end up with more questions than answers as we dig deeper into the results. This isn’t a bad thing, but you have to remember that at some point, the analysis has to end. For example, as we said earlier, there was interesting discussion around cloud, and perhaps a deeper dive into the topic would reveal richer insights into the use and needs of cloud adopters. However, once we find that, will we find there is a whole subconversation around cloud and some other topic? The permutations can go on forever.
With this simple analysis, we chose to get an overall understanding of the various themes of conversation. We’re happy with the results. In summary, we saw that many of the CAMSS themes are still alive and well in the hearts and minds of many. What was surprising about those conversations was the noted lack of discussion around security. Again, we want to be cautious about drawing far-reaching conclusions about lack of concern because perhaps this audience wasn’t focused on security but rather engagement with customers. However, given the strong affinity around Apple/Citi and the latest mobile banking application, there may be cause for caution or additional investigation.
If we had to sum up the major theme of discussion, we would say it was discussion around customer engagement (service) for the mobile space as well as what seems like a strong desire on the part of many of the attendees to investigate the hybrid cloud model (as opposed to a public cloud). Note that we said “investigate” because there was quite a bit of discussion and excitement around the topic, but no definitive talk about moving to it.