
2
Role of Green Technology Vehicles in Road Transportation Emissions – Case of the UK
This chapter highlights the role of green technologies and provides an insight into the ways in which they can help reduce carbon emissions. The chapter studies various options and features related to green technology (alternative fuel-powered vehicles [AFVs]) in terms of emissions in transportation and logistics. The chapter sheds light on AFVs providing information on the current UK market. It then goes into detail about their various types, including layout, design, and features. The chapter explains the comprehensive battery specification information: how various power auxiliaries affect energy consumption, the charging implications for the batteries and the costs involved. It also highlights specific features of the AFVs such as regenerative braking and CO2 emissions; multiple avenues are explored when it comes to AFV emissions.
2.1. Introduction
Green logistics has attracted increased attention from researchers recently due to the growing public environmental awareness, as well as the legislations by numerous governments around the world. Road transport is a major factor in climate change and accounts for a large proportion of the total greenhouse emissions, including carbon dioxide (CO2). With the increase in traffic and congestion levels, greener vehicles (more environmentally friendly) combined with efficient transport routing strategies will be of great importance. Transport organizations are increasing their awareness of the potential impacts, and their activities and services – both internally and externally – as they grow and develop. For example, the UK government has set its targets high and aims to reach its goal, from the Climate Change Act (2008), of reducing the UK’s greenhouse gas (GHG) emissions by at least 80% by the year 2050 when compared with 1990’s levels. This policy requires a drastic reduction in emissions as the road transport industry is one of the main contributors to these negative impacts. We believe this aspect ought not to be ignored where attention should be focused.
Climate change is happening as shown by the evidence across several key indicators, including the major four as noted in the following (2018 Progress Report to Parliament Committee on Climate Change).
- – Atmospheric CO2 (Carbon Dioxide) concentrations continue to rise, now exceeding 400 parts per million.
- – Global average surface temperature has increased further, with 2017 being in the top three warmest years on record. Recent years have exceeded 1°C above pre-industrial levels.
- – Arctic Sea Ice is still in decline, September sea ice extent has declined on average 13% each decade since 1979.
- – Global sea level has been on the rise since the 1990s.
According to the International Energy Agency’s figures [International Energy Agency (2017)], global emissions are still on the rise, though emissions produced by the developed countries were in fact reduced by 8% in 2015 when compared to 2000. However, developing countries doubled their emissions over that same period. This can be attributed to several factors, including a very strong growth in per capita economic output (+90%) combined with population growth (+23%). The CO2 intensity of the energy mix also increased (+12%), mainly due to higher coal consumption in larger countries (International Energy Agency 2017).
Among the developed countries, the UK reduced emissions in 2017 by 3% compared to the previous year, with the power sector being most successful in reducing its emissions in electricity production: a 75% reduction in 2018 from 2012. However, while other sectors including buildings and industry also saw a reduction in emissions, transport consumed an increase of 1% in 2017 over the previous year. Since 2014, transport sector has been the largest emitting sector in the UK economy accounting for a staggering 27% of UK greenhouse gases produced in 2017. Cars, vans and heavy goods vehicles (HGVs) account for the largest percentage of this transport sector. Policies must be introduced in order to meet the UK government’s target of 100% of new car sales to be ULEVs (Ultra Low Emission Vehicles) by the year 2040 (ULEV in the UK 2015). AFVs can reduce direct transport emissions drastically and, when combined with greener electricity generation, could provide a solution to the UK’s growing transport emission crisis. However, it is worth noting that their high battery cost and limited range may constrain their effectiveness.
The aim of this chapter is to highlight the role of green technologies and provide insight into ways to help reduce carbon emissions. We aim to study various options and features related to green technology (AFVs) in terms of emissions in transportation and logistics.
In the following sections, we introduce AFVs, providing information on the current UK market and then go into detail about their various types, including layout, design, and features. We provide comprehensive battery specification information: how various power auxiliaries affect energy consumption, the charging implications for the batteries and the costs involved. We also highlight specific features of the AFVs such as regenerative braking and CO2 emissions. Multiple avenues are explored when it comes to AFV emissions followed by our conclusion.
2.2. Alternative Fuel-Powered vehicles market
Among the alternative powered vehicles, the Ultra-low Emission Vehicles (ULEVs), such as Battery Electric Vehicles (BEVs), Plug-In Hybrid Electric Vehicles (PHEVs) and Extended Range Electric Vehicles (EREVs) are becoming increasingly important to cut down greenhouse gas emissions and air pollution in the transport sector. The ULEV uptake in the UK is prominent; recent advancement in battery technology means that these electric vehicles are now becoming increasingly viable for general use. AFVs have increased rapidly in popularity in recent years within the UK. Looking solely at electric vehicle sales, they have increased from 3,500 in 2013 to more than 150,000 by May 2018 (Electric Car Market Statistics 2018). Figure 2.1 shows the recent electric vehicle uptake in the UK on a six-point rolling average.
This particular rolling average is important, as it removes the peaks created by the new vehicle registrations that happen in March and September, and the troughs before these months as people wait for the new vehicle registration and dealers purchase a large number of newly registered vehicles in bulk. These peaks and troughs due to the new vehicle registrations are well-known within the motor trade industry. The increase in popularity is evident in the large increase in the sales of EVs, the most popular type of EV currently available is the EREV Hybrid Petrol Vehicle, with monthly sales almost doubling in the last 2 years. Plug-in hybrids also prove to be popular in the UK market with the BEVs trailing behind. The last quarter of 2018 saw zero Hybrid diesel vehicle registrations. This could be due to a number of factors including the increase in diesel tax, more stringent emission tests, and the lack of hybrid diesel–electric vehicles being manufactured. The EV market now has 8% share of the UK New Vehicle market, an increase of 7% from July 2013.

Figure 2.1. EV uptake in the UK over the last 5 years (Data acquired from the Society of Motor Manufacturers and Traders). For a color version of this figure, see www.iste.co.uk/besbes/transport.zip
2.3. Electric vehicles – options and features
Electric vehicles vary according to a number of different parameters. Table 2.1 shows the different variations of AFVs available with their drivetrain configurations, electric range and the grams of CO2 per km, for example, of that particular type of vehicle.
Table 2.1. Electric vehicle types
| Type | Drivetrain configuration | Range (km) | gCO2/km (WLTP*) |
| PHEV (Plug-in Hybrid Electric Vehicle) | ICE (Internal combustion engine) and chargeable electric engine powering wheels | 48–64 electric | 46 (Mitsubishi Outlander PHEV) |
| E-REV (Extended-Range Electric Vehicle) | All electric with ICE generator support for the battery | 112–350 electric | 0 (Battery only)/162 (BMW i3 Empty Battery) |
| BEV (Battery Electric Vehicle) | All electric | 128–400 electric | 0 |
| HEV (Hybrid Electric Vehicle) | ICE with additional support of electric engine, internally charged | 8–32 electric | 98 (Suzuki Ignis 1.2 SZ5) |
| FCEV (Fuel Cell Electric Vehicle) | Fuel cell providing power to electric engine and battery for energy storage | 480–640 electric (with hydrogen fuel) | 0 |
* Worldwide Harmonized Light Vehicle Test Procedure
Three different plug-in vehicles exist today which consumers can choose between to satisfy their needs: the plug-in hybrid electric vehicle (PHEV), the extended-range electric vehicle (E-REV), and the battery–electric vehicle (BEV). The basic design premise is shown in Figure 2.2.
The plug-in hybrid electric vehicles (PHEVs) contain a conventional combustion engine alongside an electric engine. The two can work together or independently, often each engine powering a separate axle. This type of vehicle can provide a reduction in both transportation costs and greenhouse gas emissions when compared to a comparable conventional vehicle, as when in full electric mode, PHEV’s create zero direct emissions. The PHEVs have the capability of an electric vehicle such as charging from a regular power outlet with the added benefit of a gasoline-powered engine for long-distance trips. The electrical engine can operate in two different modes: Charge Depleting (CD) mode or Charge Sustaining (CS) mode (Arslan et al. 2015). The CD mode is when the vehicle uses the electric motor to generate the necessary power using the batteries as a power supply. Once the battery is depleted, the PHEV will then switch to the CS mode. In this mode, the vehicle uses the combustion engine to generate the required power; however, in this mode, the combustion engine also generates enough energy to recharge the vehicles battery supply while driving. Typically, the battery will never reach zero charge in order to prolong battery life. PHEVs can be refueled at regular fuel stations similar to conventional cars and can be charged at designated charging points or at regular power outlets similar to the BEVs. Some examples of a PHEV include the Mitsubishi Outlander PHEV, Chevrolet Volt, BMW-i8, Toyota Prius, Volvo V70 PHEV, Honda Accord Plug-in Hybrid, and Porsche Panamera S E-Hybrid.

Figure 2.2. Conventional layouts for the typical electric vehicles in the current market (Onewedge 2018). For a color version of this figure, see www.iste.co.uk/besbes/transport.zip
Extended-range electric vehicles or E-REVs have a plug-in battery pack and an electric motor, as well as a combustion engine like the PHEVs. However, the difference is that, in the E-REVs, the electric motor always drives the wheels, with the internal combustion engine acting as a generator to supply power to the battery when it is depleted. As such, small combustion engines with low fuel consumption can be used as they are solely used to generate electricity for the E-REVs motors; as a result, these vehicles are capable of long-ranges between refueling. There are multiple generations of combustions engines designed to operate the generator for the electric motor. The first generations were designed with combustion engines used by normal convention vehicles. Generation 2 is where new engines were designed to develop a fairly constant load suited to the generator for the electric motor (Sumper and Baggini 2012). The most recent development includes microturbines and fuel cells which provide a constant load, and are most suited to the electric generators needs where a constant load is favored. Microturbines present a real opportunity for many domestic and commercial users. Several buses have recently been developed adopting this extended-range vehicle with microturbines and can see large improvements. For example, Capstone has developed this turbine technology and is currently the market leader in the area (Capstone Turbines Technology 2017). An example of an E-REV is the BMW i3 REX.
Battery Electric Vehicles or BEVs are traditional electric vehicles. They have been around since the mid-19th century, providing a preferred method of transport over the traditional combustion engines at the time. A BEV relies entirely on electricity for fuel and, as a consequence, direct emissions are zero. Typically their range is around 100–200 miles. They are wholly-driven by an electric motor which receives its power from a chargeable Lithium ion (Li-ion) battery. Electric motors are very simple when compared to the traditional combustion engine and can achieve very high efficiencies of around 95% (AEA 2008; JEC 2011). They can provide very high torque compared to others and can avoid the need for gearboxes and torque converters. The UK’s top-selling BEV is the Nissan Leaf with 20,000 units sold as of July 2017 (Nissan News 2017).
One of the biggest drawbacks of the BEV technology is the range limitation (Graham-Rowe et al. 2012); however, recent technological advances have nullified this problem. Wireless inductive charging is being introduced, thus reducing charging times for users. However, if this technology can be introduced on the roads, then it opens up an opportunity called dynamic charging, which is covered in more detail in section 2.3.2 of this chapter. BEVs are completely emission-free (except brake and tire wear) and perceived as more silent in operation. They are also becoming increasingly viable for organizations and businesses. CEP and pharmaceutics services typically deliver in regionally limited areas, with their average daily distance ranging below 140 km (Afroditi et al. 2014). Now, other businesses, such as FedEx and taxi companies, are also incorporating electric vehicles into their fleets, even though one major drawback is their cost-effectiveness when compared to conventional vehicles/trucks. Davis and Figliozzi (2013) conducted a study in the U.S. using three types of electric delivery trucks in order to examine their competitiveness to conventional trucks under varying scenarios. The study showed that electric trucks can be competitive in case the cost savings from the reduced operational cost are enough to overcome the significantly high purchase costs. However, the authors did not include in their study an important factor – namely, the charging cost infrastructure that will be needed to be installed in order to facilitate the extra demand on the charging network.

Figure 2.3. Conventional layouts for Hybrids Vehicles (Onewedge 2018). For a color version of this figure, see www.iste.co.uk/besbes/transport.zip
The parallel hybrid car (or conventional hybrid HEV), has an internal combustion engine as well as an electric motor, that are both connected to the wheels, proveding to be a good compromise for the range anxieties that arise from BEVs. In the conventional hybrid case, the electric battery is charged up using the internal combustion engine and regenerative braking; however, either the engine or both can be powering the wheels at one specific time. This can then be used for short-range electric driving before the internal combustion engine takes over. Optimizing time spent using this electric energy is a crucial way to improve efficiency in conventional hybrids. These vehicles benefit from regenerative braking, as well as weight savings over the BEVs which can play a large role in energy consumption. Due to the configuration and the fact that both engines can power the wheels, they can be equipped with smaller engines, thus increasing efficiency. Typically, HEVs have smaller battery packs, ranging from 5 kWh to 10 kWh, due to the fact that they need to be charged and discharged quickly and frequently. However, HEVs can also be complex, due to their nature of two systems constantly trying to cooperate and work together to provide the desired torque value.
The fuel cell electric vehicle or the FCEV is a popular topic among researchers at the moment, due to its potential benefits. They are predominantly powered by hydrogen with the only by-product of water vapor and warm air. Their basic layout can be shown in Figure 2.4. Similar to traditional combustion vehicles, they can be refilled in less than 10 minutes with a driving range of around 300 miles. They work in a similar way to that of the BEVs by using electricity to power an electric motor produced by a hydrogen fuel cell. A fuel cell is a device that directly takes stored chemical energy into electrical energy. The chemical energy that is stored between the fuels, such as hydrogen, methane and gasoline, is taken through two electrochemical reactions where it is converted directly into electricity. The major components of the fuel cell are the electrolyte, which also acts as a separator that keeps the reactants from mixing together. Next, the electrodes. These are catalysts made of graphite where the electrochemical reactions occur. These are contained within a bipolar plate (also known as a separator) that allows the current to be collected and voltage to be built from the cell. The most efficient fuel is hydrogen due to its ease of forming ions. The gas is highly combustible and has high energy content. However, hydrogen in its pure form is not readily available like conventional fossil fuels. Typically, their efficiencies are in the 60%–64% range (AEA 2008). There are cells which consume gasoline and convert them into hydrogen-rich streams to run fuel cells; however, the process is very complex and hence designers and technicians are less attracted. Due to hydrogen’s low density, the design of the onboard hydrogen storage systems is becoming a design challenge. The volume of the fuel cell is relatively large compared to the internal volume of a combustion engine, thus making its fitment inside a vehicle to be difficult, through technology for smaller packing of the fuel cell or more efficient packing. At room temperature and pressure, the equivalent energy contained in a petrol tank would require a hydrogen tank around 800 times the volume. In order to combat this, the hydrogen is pressurized up to 7,000 times than that of atmospheric pressure. At these pressures, cryogenic systems have to be incorporated in order to effectively cool and liquefy the hydrogen; metal-hydrides are also used. These metal alloys absorb the hydrogen under high pressures.

Figure 2.4. Layout of the Fuel-Cell Electric Vehicle (Onewedge 2018). For a color version of this figure, see www.iste.co.uk/besbes/transport.zip
2.3.1. Battery relevance
The batteries found in BEVs vary massively, according to the role that they need to fulfill and the environment in which they are used, and play a vital role in a BEV. Energy density is a key factor when considering battery types, as higher energy density allows more energy to be stored in a smaller battery, ultimately improving efficiencies. Battery energy densities are constantly improving, allowing longer ranges within electrically-powered vehicles. The most popular UK EV, the Nissan Leaf, uses Lithium-ion (Li-ion) manganese batteries, providing moderate to high energy density with relatively low internal resistance. The longer range and more expensive Tesla uses Li-ion cobalt batteries which take slightly longer time to charge, but typically – a higher energy density. The manganese-based Li-ion batteries chosen for the Nissan Leaf and other EVs have excellent lab results. Manufacturers also choose their batteries based on cost; some batteries are more suited for keeping the battery at high voltage and elevated temperatures than others. In some cases, as the CE tests reveal, these two conditions can cause more damage than cycling (Battery University 2016). Table 2.2 provides the reader with a comprehensive overview of the various types of batteries used by manufacturers today.
From Table 2.2, it can be seen not only how these energy densities vary from different battery types, but also a vast number of alternative factors that all have a key role in the decision on which to select for its purpose. Information such as that in Table 2.2 can be imported into transport systems for meeting the optimum conditions for various vehicles when modeling to ensure correct charging/running procedures. Just as engine maintenance is important for a combustion engine, battery health is of great importance for Li-ion batteries. Although maintenance is not required, they do have a limited lifecycle of around 500–1,000 charges before degradation can appear. The four suspected factors responsible for the capacity loss and the eventual end-of-life of the Li-ion battery are as follows.
- – Mechanical degradation of electrodes or loss of stack pressure in pouch-type cells. Careful cell design and correct electrolyte additives minimize this cause.
- – Growth of solid electrolyte interface (SEI) on the anode. A barrier forms that obstructs the interaction with graphite, resulting in an increase of internal resistance. SEI is seen as a cause for capacity loss in most graphite-based Li-ion when keeping the charge voltage below 3.92 V/cell. Electrolyte additives reduce some of the effects.
- – Formation of electrolyte oxidation at the cathode that may lead to a sudden capacity loss. Keeping the cells at a voltage above 4.10 V/cell and at an elevated temperature promotes this phenomenon.
- – Lithium-plating on the surface of the anode caused by high charging rates. (Elevated capacity loss at higher C-rates might be caused by this.)
Along with these factors of capacity loss, thermal management plays a key role in BEVs. As shown in Table 2.2 on the next page, batteries have a certain operating window when charging and discharging. Temperature has a large impact on the performance of EV batteries and should not be overlooked. At cold temperatures, battery performance is lower due to poor ion movement; viscosity changes result in slow electrochemistry (see Figure 2.5). Resistance, therefore, increases with temperature affecting the relative capacity. This has a substantial effect on the range and the acceleration when compared to conventional vehicles. Low temperature affects the charging, allowing for a possible increase in dendrite creation, and also has a profound effect when the heaters are used due to the smaller EV range the increase in energy.
Table 2.2. Battery specifications (Battery University 2018)
| Specifications | Lead acid | NiCd | NiMH | Li-ion | ||
| Cobalt | Manganese | Phosphate | ||||
| 30–50 | 45–80 | 60–120 | 150–190 | 100–135 | 90–120 | |
| Internal resistance (mΩ) | <100 | 100–200 | 200–300 | 150–300 | 25–75 | 25–50 |
| 12 V pack | 6 V pack | 6 V pack | 7.2 V | per cell | per cell | |
| Life cycle (80% discharge) | 200–300 | 1,000 | 300–500 | 500–1,000 | 500–1,000 | 1,000–2,000 |
| Fast-charge time | 8–16 h | 1 h typical | 2–4 h | 2–4 h | 1 h or less | 1 h or less |
| Overcharge tolerance | High | Moderate | Low | Low. Cannot tolerate trickle charge | ||
| Self-discharge/mont h (room temp) | 5% | 20% | 30% | <10% | ||
| Cell voltage (nominal) | 2 V | 1.2 V | 1.2 V | 3.6 V | 3.8 V | 3.3 V |
| Charge cut-off voltage(V/cell) | 2.4 | Full charge detection | 4.2 | 3.6 | ||
| Float 2.25 | By voltage signature | |||||
| Discharge cut-off voltage (V/cell, 1 C) | 1.75 | 1 | 2.50–3.00 | 2.8 | ||
| Peak load current | 5°C | 20°C | 5°C | >3°C | >30°C | >30°C |
| Best result | 0.2°C | 1°C | 0.5°C | <1°C | <10°C | <10°C |
| Charge temperature | −20°C to 50°C | 0°C–45°C | 0°C–45°C | |||
| −4°to 122°F | 32–113°F | 32–113°F | ||||
| Discharge temperature | −20°C to 50°C | −20°C to 65°C | −20°C to 60°C | |||
| −4 to 122°F | −4 to 149°F | −4 to 140°F | ||||
| Maintenance requirement | 3–6 months | 30–60 days | 60–90 days | Not required | ||
| (topping charge) | (discharge) | (discharge) | ||||
| Safety requirements | Thermally stable | Thermally stable, fuse protection common | Protection circuit mandatory | |||
| In use since | Late 1800s | 1950 | 1990 | 1991 | 1996 | 1999 |
| Toxicity | Very high | Very high | Low | Low | ||
output results in a higher energy loss compared to a conventional vehicle. For example, in cold weather conditions, the effect of the heater can nearly double the energy consumption and cut the range in half when using specific driving cycles. Table 2.3 provides the reader with the net power needed for common vehicle functions. With an already limited range, additional auxiliary functions can limit the range of BEVs further. As a result, they can have a seriously reduced range in cold/hot weathers when additional auxiliary functions such as cabin heaters or A/C are used.
Table 2.3. Impact of equipment on EV Performance (EV Auxiliary Systems Impact 2018)
| Accessory | Range impacts | Comments |
| Air conditioning | Up to 30% | Highly dependent on cabin temperature, ambient temperature and air volume |
| Heating | Up to 35% | Highly dependent on cabin temperature and ambient temperature |
| Power steering | Up to 5% | Necessity |
| Power brakes | Up to 5% | Necessity |
| Defroster | Up to 5% | Depending on the use |
| Other – lights, radio, phone, power-assisted seats, windows, locks, etc. | Up to 5% | Depending on the use |
It is therefore important that these factors need to be taken into account when planning electric vehicle routes, as they can affect the range by a large amount. Powertrain efficiencies of BEVs are higher compared to the engine-powered counterparts, making the accessory loads more significant for some driving styles.
One crucial aspect that needs highlighting is the hot climate environment. At hot temperatures, the battery can become in danger of degradation and, at extremely high temperatures, can cause serious harm with thermal runaway – a process in which a rise in battery temperature triggers reactions and additional heat, eventually leading to the battery exploding. Although manufacturers introduced strict thermal management practices within their production of their vehicles, EVs batteries still rise significantly during the charging process. The effect is more profound when fast charging; in order to minimize degradation, battery operating temperature should be kept between 15°C and 35°C. This can be monitored on all BEVs vehicles and often BEVs limit their charging speeds according to the battery temperature. Figure 2.5 shows a graph demonstrating the effect of thermal management on battery life in a reader-friendly format.

Figure 2.5. Thermal management for Li-ion batteries in an EV. (This graph was created based on data found here http://www.nrel.gov/docs/fy13osti/58145.pdf.) For a color version of this figure, see www.iste.co.uk/besbes/transport.zip
2.3.2. Charging implications
One main influencing factor on the temperature of the battery is charging. The speed at which a vehicle is charged is directly related to its temperature. Manufacturers that use large batteries often employ battery cooling techniques to allow the batteries to still charge at a fast rate without thermal management issues. Charging can also be negatively affected due to microscopic fibers of lithium, called “dendrites,” growing on the cathodes. Dendrite growth is progressively worse with the increase in the reacting surface area. The reaction process is accelerated by almost a factor of 10 in worse case scenarios at -20°. Future developments in the design of batteries show that we could be heading toward the use of ultracapacitors as well. Ultracapacitors can store significantly more charge than regular capacitors due to the effective material used in their production; they can also be charged more than 1 million times, meaning they could provide a viable solution to electric vehicle distance anxiety. Combining the two can protect from surges in the fuel cells proving excellent power and energy density (NASA 2010).
Charging Types – There are three main EV charger types that are currently in use:
- – Slow: these slow charging units provide up to 3 kW and are best suited for overnight charges, as a full charge on a typical vehicle can take anywhere between 6 and 8 hours.
- – Fast: these chargers provide between 7 and 22 kW of power which offers charging times between 3 and 4 hours.
- – Rapid: these charging units are the most powerful and provide 45–50 kW, capable of providing vehicles with an 80% charge in as little as 15–30 min. These charging points come in two different variants, alternating current (AC) and direct current (DC).
The number of charging points has been steadily increasing in the UK, with just over 9,000 points as of September 2015 and over 19,000 as of January 2019 (Zap-Map 2019), with many more planned to be installed by the UK government as the electric vehicle market increases. Slow chargers use (in most of the cases) a standard single phase 13 A three-pin plug, the very first charging points installed were of this type; however, they are now being replaced by Fast and Rapid charge points. Almost every vehicle can be slow charged with each vehicle provided with a standard three-pin plug at the charging point outlet and a Type-1 (J1772) or seven-pin Type 2 (Mennekes) connector for the vehicle inlet. Fast chargers reduce the rate of the slow charger times significantly; this is accomplished by doubling the available Amperes to 32 A or 7 kW for a single phase. This type of charger is the most commonly installed with over 5,500 installed in the UK as of September 2015. For larger commercial vehicles, such as trucks and buses, fast three-phase charging is available and capable of delivering 22 kW in total.
Rapid chargers, while growing in popularity, are relatively new. They come equipped with a tethered cable with a non-removable connector coupled with an inlet socket. The AC variants are the least popular since only a few UK EV models are designed to accept them. Rapid AC chargers are rated at 63 A, 43 kW (three-phase) using high-power AC supply and the Type 2 (Mennekes) connector. The DC rapid charge variant provides high-power DC supply at 125 A, 50 kW. These DC rapid chargers are fitted with either a JEVS (CHAdeMO) or a nine-pin CCS (combo) connector. Around 1,500 rapid chargers are currently installed in the UK (as of early 2016). As mentioned previously, due to the high amperage of this form of charging, the internal battery temperature increases dramatically; with frequent rapid charging/discharging, this has more bearing. When charged at a fast rate, dendrites appear from the surface of the lithium electrode and spread across the electrolyte until they reach the other electrode. An electrical current passing through these dendrites can possibly short-circuit the battery, causing it to rapidly overheat and in some instances catch fire. Efforts to solve this fairly new problem by inhibiting dendrite growth have been met with limited success (Li-ion roots).
Nissan is one of the leaders in electric vehicles and as two electric vehicles in the global market. One being the Nissan Leaf designed for public use, with the 2016 model providing an EPA-estimated 107 mile range (but a large 155-mile range according to the new European driving style), with the 2019 model anticipated to have an EPA range of over 225 miles. The other being the e-NV200, a short wheel-based commercial van, aimed at businesses with a similar range of 106 miles with 4.2 m3 of loading space and a loading bay of 2.04 m. Both vehicles use the same charging modes and require similar charging times: 8 hours on the slow 3-kW charger, 4 hours on the fast 7-kW chargers, and capable of an 80% charge in 30 minutes using the rapid charge. These rapid chargers mean that these electric vans can be viable solutions to logistic firms wanting to reduce their overall carbon footprint. The cost of charging cannot be written off, however, and as the infrastructure improves and more companies offer charging facilities, price variations in charging will occur. The current market leader for electric charging stations is Ecotricity, with the most comprehensive charging network in Europe (Ecotricity 2016). The price for a 30-minute rapid charge (43 kW AC up to 50 kW DC) is around £6, providing up to 80% charge, depending on battery capacity. However, for home/business use on personal electricity, the Society of Motor Manufacturers and Traders (SMMT) says that the typical cost of electricity to charge an EV is approximately 3 p/mile compared with the petrol/diesel costs of around 16 p/mile. This value was calculated when recharging times were considered to be at night when energy is largely subsidized (Schönewolf 2011). As mentioned before, the batteries themselves can suffer from degradation from overcharging. Bashash et al. (2011) provide an optimal charge pattern plan for plug-in hybrid vehicles; however, the premise can be carried across BEVs also. This paper focuses on the total cost of electricity and fuel, and the total battery degradation over a 24 hour period. Among the researchers, the common definition for the battery’s end-of-life is around 70%–80% of its original energy. However, researchers have found that this value can be significantly less in real-life situations, since most people do not drive more than 40 miles per day (Saxena et al. 2015). The authors suggest using an alternative metric of defining battery retirement when it no longer meets the daily travel needs of a driver. Botsford and Szczepanek (2009) investigate the issues facing widespread use of electric vehicles. The study shows an example of how limiting only slow charging can be and how rapid chargers could help with the adoption of EVs.
During charging, BEVs do not necessarily need to be fully charged before leaving the charging station. Goeke and Schneider (2014) use a full maximum charging system at a constant rate, in their electric vehicle routing problem with time windows and mixed fleet. The mixed fleet contains both combustion and electric vehicles. Keskin and Catay (2016) relax the full recharge restriction and allow partial recharging, which is more practical in the real world due to the shorter recharging duration. The results highlight that partial recharging may significantly improve routing decisions. Specifically, they modeled charging time as a function of the State of Charge (SOC) of the battery. Table 2.3 shows the results of running common EV functions. The results were based on the popular Nissan Leaf BEV. For full Leaf information, the reader is directed to Nissan Leaf Specs (2016).
Dynamic charging could allow electric vehicles to charge while they are driving. A localized electromagnetic field is created between the charging pad on the electric vehicle and the corresponding charging pad in the road and a current induced charging the battery. Although still in its infancy, the technology exists and would have worthy benefits in applications such as traffic queues and traffic lights. The use of Li-ion batteries will significantly minimize the emissions; however, there is a limited amount of lithium and the future of the BEVs could be unknown. Online electric vehicles (OLEVs) draw their power from electric coils that are underground wirelessly (Suh 2011). Su et al. (2015) look at how the infrastructure supports wireless inductive charging for OLEVs in Korea, analyzing the benefits of the dynamic charging with an economic model of the battery size and the required charging infrastructure. With dynamic charging, EVs can charge more often and thus smaller batteries can be used in operation (Lukic and Pantic 2013). Using real-life data, the authors found that although a larger initial cost for installation was needed for dynamic charging, more cost-saving can be accomplished by extending the battery life. Future steps within the electric vehicle routing problem could identify these dynamic chargers using a stochastic charging model. Another novel idea that is highly popular among the researchers is the possibility of battery swapping, where depleted batteries from electric vehicles can be exchanged for recharged ones on long trips (Brown et al. 2010; Yang and Sun 2015; Zheng et al. 2013). The success depends upon the infrastructure of the swapping stations and the ease of service.
2.3.3. Relevance of regenerative braking technology
EVs mostly employ regenerative braking technology. This allows the vehicles to convert kinetic energy into electrical energy, which can then be stored in the battery when slowing or traveling down a slope. The electric motor functions as a generator, supplying the battery with the electrical energy generated. Regenerative braking also brings with it additional benefits such as reduced brake wear and the ability to use one pedal when driving (also known as an e-pedal). Single pedal driving is a relatively new concept, although it allows regenerative braking to be used to its full potential. When the user fully releases the pedal, the vehicle is in the maximum regeneration mode. This acts just as normal combustion engine brakes would and stops the car with considerable force. When the user wishes to come to a gradual stop, the pedal is released partially and a percentage of regenerative braking force is used instead.
2.3.4. Emissions
For determining the emissions generated from a vehicle, a three-scope approach can be used. This is a widely accepted approach, which is used here, to identify and categorize emission-releasing activities into three groups known as scopes. Each activity is listed as either Scope 1, Scope 2, or Scope 3; More information on how the scopes are used, as well as all other aspects of reporting, can be found in the Greenhouse Gas Protocol Corporate Standard (GOV.UK).
- – Scope 1 (direct emissions): Emissions from activities owned or controlled by an organization. Examples of Scope 1 emissions include emissions from combustion in owned or controlled boilers, furnaces, and vehicles; emissions from chemical production in owned or controlled process equipment.
- – Scope 2 (energy indirect): Emissions released into the atmosphere associated with the consumption of purchased electricity, heat, steam, and cooling. These are indirect emissions that are a consequence of an organization’s energy use, but which occur at sources they do not own or control.
- – Scope 3 (other indirect): Emissions that are a consequence of your actions, which occur at sources that you do not own or control and which are not classed as Scope 2 emissions. Examples of Scope 3 emissions are business travel by means not owned or controlled by your organization, waste disposal which is not owned or controlled, or purchased materials or fuels. Deciding if emissions from a vehicle, office, or factory that you use is Scope 1 or Scope 3 may depend on how you define your operational boundaries. Scope 3 emissions can be from activities either upstream or downstream from an organization.
The generated emissions for scope 1 of various types of conventional vehicle can be found in Figure 2.6. Passenger cars conversion factors are related to the market segments specifically defined by SMMT (Society of Motor Manufacturers and Traders). The conversion factors are based on information generated from the department for transport, who regularly analyses the mix of cars on the road using number plate recognition. The CO2 emissions generated from these AFVs are significantly less than their diesel and petrol counterparts – 44% and 46%, respectively.
AFVs play a key role in the quest to reduce emissions. Traditional petroleum-based powered vehicles produce many emissions mainly at Scope 1. The emissions generated by these vehicles and their effects on humans are explained in detail within section 2.4 alongside the UK emissions. Scope 1 emissions from these petroleum-based vehicles are harmful not only to the environment, but also to the people. Direct tailpipe emissions can lead to air pollution; NO2 and PM exceedances in cities are becoming increasingly common. Congested traffic poses a real threat to air quality and it is well-known that road transport in the urban area is a major source of air pollution across the world. However, in Europe, all the vehicles have to comply with the EU emission standards. The emissions are tested using the legislated standard driving cycles. Unfortunately, these often do not represent real-world driving emissions. This is because, compared to the legislated driving cycle, real-world driving uses different engine power configurations, differing speeds, different acceleration rates, varying traffic congestion, continuously changing road gradients, different cold start conditions, and various numbers of stop/start events all occurring with varying weather conditions; the outcome will inevitably result in different emissions. The true emissions generated by these petroleum-based vehicles is actually very different than the emissions calculated on these driving cycle tests. It is therefore important that we must address air pollution in these urban areas. BEVs generate zero emissions and therefore make great candidates for heavily urban areas where traffic congestion is a major issue, and range is also less important due to reduced driving distances in cities, increased congestion and reduced speed limits. Although BEVs generate little to no emissions, indirect emissions must also be considered. The electric vehicle emissions are classified as mainly Scope 2 and are directly related to the fuel mix that is used to create the electricity. As mentioned previously, the UK’s Power Sector has reduced its emissions drastically and this is directly proportional to the emissions generated by BEVs. The emissions do, however, also depend on other factors, such as the type of day, where different combinations/mixes of power generation are used. With the previously mentioned recent technological advancements, such as autonomous vehicles, dynamic charging, and reduced charging times, it opens us a wider range of emission-reducing possibilities. With faster charging, the vehicles are suitable for long-range drivers, thus allowing minimal stopping times and appealing EV driving to a wider audience. With the introduction of dynamic charging, streets in cities that are normally filled with idling vehicles can now be replaced by electric vehicles that can be wirelessly charged during motion, thus leading to a significant reduction in urban air pollution. Autonomous electric vehicles help optimize the charging times and can charge themselves when the national grid is at its least demand, meaning just green energy. production is needed to meet demands. This, in turn, allows BEVs to charge at zero Scope 2 pollution; this aspect is covered in more detail in the following chapter.
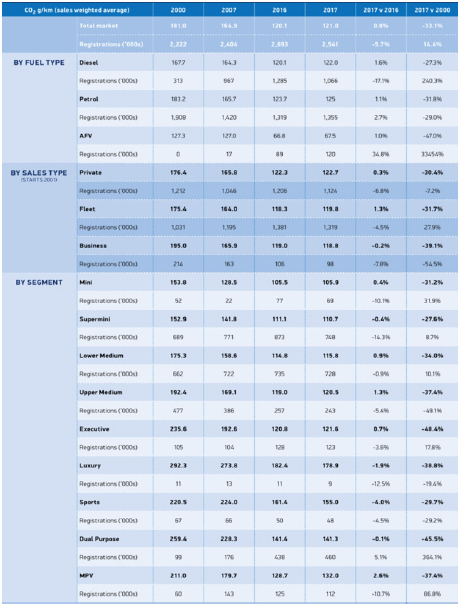
Figure 2.6. Average new car CO2 emissions and registrations (New Car CO2 Report 2018)
2.4. UK transport emissions and the impact of BEVs
All vehicles generate emissions whether directly or indirectly. With an increasing number of vehicles being registered each year within Britain advancements in engine technology and emission reduction hardware are critical. The UK government have their sights firmly on reducing transport pollution within Britain, focusing on urban areas such as London [Ultra Low Emission Zone (ULEZ) 2018]. The UK government has brought in a ban on all new petrol and diesel cars from the year 2040, which has recently been brought forward to 2030 by UK mayors (Sadiq 2018). Along with a £255 million fund to help councils tackle emissions, it is clear to see the emphasis the leading officials are placing on improving the air quality around our streets. British vehicles and LGVs and HGVs amassed a combined 60.9 billion miles in 2014, an increase of 5.5% and 2.0%, respectively (Great 2014). Using the average fuel consumption data from the Department for Statistics (LGV – 13.6 mpg, HGV – 7.9 mpg), this mileage equates to 5.32 billion gallons of fuel. This amounts to 64.8 million tons of CO2. This is a huge amount of potential pollution that is being created. The use of alternative methods of transport could reduce this amount with electric vehicles being a viable way forward.
With most goods vehicles currently in the market being diesel, in this section, we will focus on these combustion engine types, rather than petroleum-fueled combustion engines. We then go on to discuss future engines with electric vehicles and ultra-low emissions vehicles. Diesel vehicles are very common in medium-to-heavy goods vehicles, and also popular among the public due to their longer driving range, higher engine efficiency, low running costs, and durability when compared with their petrol counterparts. However, they have recently seen a big drop off in sales. March 2018 saw a 37% reduction with the previous year (New Vehicle Registrations 2018). Recent emissions scandals, whereby companies such as Volkswagen (VW) were found to be using emission cheating devices built into the engine control unit, have caused a lot of doubts around the actual emissions generated by these diesel engines (Autocar 2015; Mathiesen and Neslen 2015). The vehicle could sense when it was under test conditions and employ all of its available emissions reduction systems to reduce the emissions to below the required limit. When under normal driving conditions on the road, some of these systems were not working as effectively; this provided an enhanced driving experience with better performance, but increased the emissions. Running without the device, the vehicles were found to be producing around 40 times the allowed amount of nitrogen oxide in the US. The result of the scandal was dramatic: VW Group was issued a fine around £4.7 billion, with the possibility of a maximum fine of £13.7 billion; however, this figure does not include the cost of repairing the vehicles. As a result, the company’s shares dropped by 30% in the short period following the scandal. The increased emissions dramatically affect the environment with the vehicles in the US creating 10,392–41,571 tons of toxic gas into the air each year, rather than the expected 1,039 tons of NOx (Mathiesen and Neslen 2015). Recently, however, it has been found that other manufacturers including Mercedes have also been found guilty of having emission defeat devices fitted and are now recalling more than 770,000 vehicles (BBC News 2018). There are seven main Greenhouse Gases (GHGs) that contribute to climate change, as covered by the Kyoto Protocol: carbon dioxide (CO2), methane (CH4), nitrous oxide (N2O), hydrofluorocarbons (HFCs), perfluorocarbons (PFCs), sulfur hexafluoride (SF6), and nitrogen trifluoride (NF3). Different activities emit different gases. GHG emissions from transport have been fluctuating over the last two decades, although remained fairly stagnant over the last 4 years. The government aims to reduce CO2 levels by 80% by the year 2050 (ULEV in the UK 2015). Other than an increase in technology and advances in transport, the government adopts various policies to try and reduce the overall impact. Some research carried out by the government includes looking at various scenarios and how they will affect the GHG emissions within the transport sector. Figure 2.7 shows how these policies will affect emissions.
It can be seen that if only baseline policies were met, the estimated emission increases. The baseline reference is based on central estimates of economic growth and fossil fuel prices, and indicates further actions must be taken to reduce CO2 emission. As can be seen from the graph, fuel price has a vital role in the reduction of emissions. With a low fuel price, consumers are more likely to use their traditional combustion engine vehicle, thus resulting in increased pollution. On the other hand, a high fuel price can be the main factor in reducing emissions, this will drive people to AFVs and alternative means of transport. These alternative fuel vehicles must still be monitored carefully as they are not emission-free.
When diesel combusts, it emits many different pollutants of which several are very harmful. During the combustion process, fuel is injected at very high pressures, this is then put under immense compression during the combustion stroke of the engine, generating the required heat to cause the diesel fuel to ignite. In an ideal environment with exceptionally high combustion efficiencies, the by-product of the combustion would be only CO2 and H2O (Prasad and Bella 2010). However, factors such as combustion temperature, air-fuel ratio, and turbulence in the combustion chamber reduce the efficiency and a number of harmful products are generated such as CO, PM, NOx, SOx, and HC.
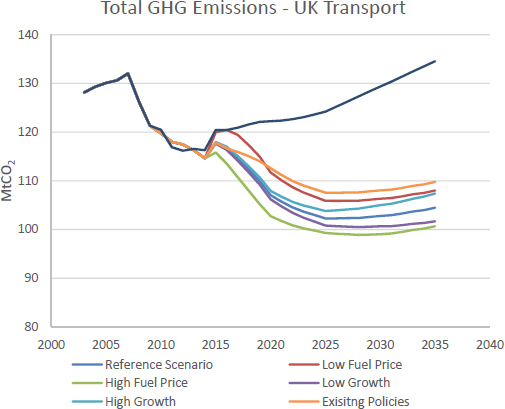
Figure 2.7. How policies will change the total GHG emissions (Road Transport and Environment 2016). For a color version of this figure, see www.iste.co.uk/besbes/transport.zip
- – Carbon Monoxide (CO) – produced by internal combustion engines and can lead to carbon monoxide poisoning, causing serious health issues and in severe cases death. (NHS 2019).
- – Particulate matter (PM) – consistently associated with respiratory and cardiovascular illness and increased mortality. Diesel engine exhaust has been classified as carcinogenic to humans by the World Health Organization. Secondary PM contributes to the acidification of ecosystems.
- – Nitrogen Oxides (NOx) – are harmful pollutants generated from diesel engines, which not only have detrimental effects on the environment but also cause most health problems. They can cause inflammation of the airways, and long-term exposure may affect lung function and respiratory symptoms. High levels can also have an adverse effect on vegetation. NOx contributes to acidification and/or eutrophication of habitats and to the formation of secondary particles and ground-level ozone, both of which are associated with ill-health effects. Actions are needed to reduce this health issue for both the workers and the general population (Sydborn et al. 2001).
- – Sulfur Oxides (SOx) – causes constriction of the airways of the lung. Involved in the formation of PM. This contributes to the acidification of terrestrial and aquatic ecosystems, damaging habitats, and leading to biodiversity loss.
- – Hydrocarbons (HC) – these are chemical compounds found on Earth and are the reason fossil fuels combust – extremely important in modern-day society. Diesel fuel contains larger hydrocarbon molecules with more carbon atoms than petroleum, and as such has a higher fuel density. Issues arise when incomplete combustion takes place, releasing emissions pollution into the atmosphere.
Diesel engines produce the highest level of these gases from their exhausts and have been shown to be linked to carcinogenetic effects which can lead to cancer of the lungs (Diesel Engine Exhaust Carcinogenic 2012). The study conducted by the IARC was mainly composed of workers exposed to diesel exhaust gas fumes. However, in the past carcinogens that have been shown to have high risk to heavily exposed groups were also found to be present to the general public. It has been estimated that 20%–70% of PM is attributed to the combustion-derived particles from traffic (Gong et al. 2005; Reis et al. 2018; Rückerl et al. 2007). Diesel emissions are linked to causing inflammation and tissue damage, and with chronic exposure harmful physiological changes can occur within multiple organ systems (Reis et al. 2018).
With the British transport industry currently making up 27% of all UK GHG emissions, it is of the utmost importance that we aim to reduce this negative effect. This could be achieved by identifying new technology and methods to improve air pollution levels. In 2017, diesel vehicles provided a 42% market share of new cars; on average, these diesel vehicles produce 122 CO2 g/km. By contrast, AFVs provide a smaller 5% market share emitting on average of just 67.5 CO2 g/km. These figures are measured at the tailpipe to evaluate in-use emissions performance. BEVs produce zero tailpipe emissions, and an increase in BEV sales will provide a crucial reduction in direct CO2 emissions and can have a beneficial impact on the dangerous emissions emitted by combustion engines for the public. However, BEVs are not completely emission-free, and they can still produce emissions indirectly. Accurately understanding the emissions generated by charging, the batteries can provide a further reduction in these indirect emissions.
Limited research has been carried out to calculate the emissions actually generated from ULEVs. Well-to-wheel emission is generally used where the emissions are calculated from how the fuel is produced and the way in which the vehicle is operated. In this study, the center of the focus is on BEVs; however, the information can easily be carried over to PHEVs as well. For more detailed information on the emissions of PHEVs, the reader is directed to (Jung and Li 2018).
When compared with internal combustion engines (ICEs), EVs have many advantages including (Fiori et al. 2016):
- – Greater energy efficiency through the use of onboard electric devices.
- – Regenerative braking, reducing driving emissions.
- – The possibility of obtaining greener fuel sources.
- – Zero tailpipe emissions.
- – Less noise pollution.
As already described in section 3.3, regenerative braking allows EVs to recover energy that is normally lost in the braking phase and convert it back into stored electrical energy. This is the opposite to the case of the traditional ICE vehicle where the energy generated from braking is lost as thermal losses. Several empirical studies have shown that EVs consume less energy while driving in urban areas and are able to recover energy while braking (De Gennaro et al. 2014; Rambaldi et al. 2011). Traditionally, the electric vehicle is thought of as an emission-free vehicle, due to zero tailpipe emissions while on the move. However, the electricity that is needed to power the engine creates emissions on production/generation.
The amount of emissions is generally down to the fuel mix from the country of origin. The following research has taken data from the government fuel disclosure mix 2015 and 2017. The Department for Environment, Food and Rural Affairs (DEFRA) quotes the figure as 0.527 kg/kWh of electricity generated. This figure is used by businesses to provide a carbon emission estimation, a requirement for Public Limited Companies (PLCs) The indigenous fuel mix for the year 2015 and 2017 is shown in Figure 2.8.
The shift away from coal as an energy source can be seen, reducing coal power generation share by 3% from 2015 to 2017. Bioenergy and waste as an energy source on the other hand has increased its power germination share by 2% from 2015 to 2017. This shift toward a greener electricity fuel mix provides a direct reduction in BEV emissions. However, due to the nature of electric vehicles, the emissions they create are entirely dependent on the fuel mix in the country where they are being used. In the combustion process of the different fuels of each fossil, fuels emit different amounts of CO2.

Figure 2.8. The Indigenous Fuel Mix for the UK in 2015 and 2017 (Energy Trends 2019). For a color version of this figure, see www.iste.co.uk/besbes/transport.zip
The Fuel Mix for the period April 01, 2014, to March 31, 2015, can be seen in Table 2.4, which includes the transmission loss factor of 1.12. Please note that this is the overall energy source including energy produced from other countries, hence obtaining varying values when compared to the indigenous mix as shown in Figure 2.8.
Using the information shown in Table 2.4, one can calculate the average weight (kg) of CO2 per kWh. This equates to 0.527 kgCO2/kWh at the time of data recording. This value represents an average emission factor of the electricity generated in the UK.
Table 2.4. The fuel mix of the UK with the estimated CO2 produced for each energy source (UK GOV 2017).
| Energy source | Residual (%) | UK (%) | CO2 (g/kWh) |
| Coal | 38.7 | 26.7 | 910 |
| Natural Gas | 36.2 | 29.7 | 380 |
| Nuclear | 14.2 | 22.2 | 0 (0.007 g/kWh) |
| Renewables | 4.6 | 19.3 | 0 |
| Other Fuels | 6.3 | 2.1 | 600 |
* high-level radioactive wastes
All conversion factors presented here are in units of CO2. CO2e is the universal unit of measurement to indicate global warming potential (GWP) of Green Houses Gases (GHGs), expressed in terms of the GWP of one unit of carbon dioxide. The residual percentage is nothing more than a grid emission factor. The residual mix incorporates the allocation of renewable energy by those who have purchased electricity tracking certificates such as guarantees of origins (GOs). As it can be seen from Table 2.5 on the next page, the emissions generated via coal and other fuels produce significantly more CO2 emissions per kWh than other sources of energy. However this is often the cheapest form and as such is favorable in terms of cost. However, long-term effects can bring serious detrimental environmental impacts. Other sources of fuel include pumped storage, as well as alternative sources of electricity generated abroad and distributed to the UK. Although nuclear energy does not produce CO2 emissions as a direct product, there is the production of radioactive material. This is a major problem with nuclear energy and there is yet to be a viable solution to this waste problem. The UK government has introduced new planning regimes for its power generation recently. These include the installation of new nuclear reactors, large wind farms, reservoirs and railways (World Nuclear 2018). However, as this study is focused on the current fuel mix, the aforementioned issues are beyond the scope of this work. The fuel mix varies dramatically over the course of a day. Peak and off-peak grid times involve a different combination of power sources, resulting in varying emissions and evidently different prices.
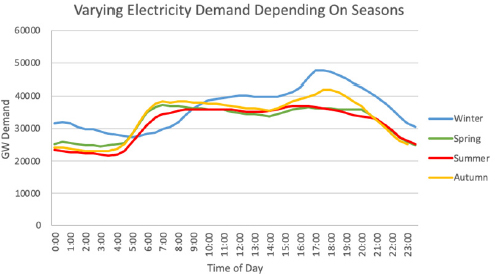
Figure 2.9. Varying energy demand throughout the day dependent on seasons. For a color version of this figure, see www.iste.co.uk/besbes/transport.zip
Figure 2.9 demonstrates how much these peak loads change over the course of the day. The values are calculated from Gridwatch (2019) using past history for the year 2015. Each data series represents the average Wednesday electricity demand during the middle of each season. Wednesday was chosen as it is halfway through the normal working week and provided a good estimate on the demands when routing commercial vehicles during working hours. The peak hours can be seen to be around 16:00 to 19:00, with more being generated in winter. This is due to people arriving back from work and using appliances within their homes and the need for heating in winter. As electricity demands change throughout the day, so does the energy source used to create electricity. A more detailed breakdown can be found at the Renewable Energy Foundation (REF 2019), where the changes to the fuel mix during peak and low grid times can be seen. By examining the past data, predictive models can be created to forecast the amount of emissions generated at certain times of the day, while generating accurate predictive emissions models for EV charging. Using this information on varying power demand as shown in Figure 2.9 and linking to the UK fuel mix in Table 2.5 and emissions of those power sources, an accurate emission evaluation can be achieved. We have implemented a simple breakdown of the results in Table 2.5 and provided the emission cost for charging an EV with a 30 kWh capacity at different times of a day.
Table 2.5. Emissions generated to charge a 30 kWh EV during different times throughout the day
| Season | Time of day to recharge | Emissions generated kgCO2 for 30 kWh |
| Winter | 7:00 | 11.04 |
| Summer | 7:00 | 7.52 |
| Winter | 12:00 | 11.44 |
| Summer | 12:00 | 7.46 |
| Winter | 17:00 | 11.84 |
| Summer | 17:00 | 7.44 |
| Winter | 00:00 | 8.92 |
| Summer | 00:00 | 7.04 |
One can clearly see the benefits of scheduled charging when looking at the emissions generated at different periods throughout the day for the UK. The two days selected were January 30, 2019, for the winter comparison and August 1, 2019, for the summer. During winter months, energy consumption is much higher as can be seen in Figure 2.9; this has a direct effect on emission when charging EVs. In the case presented earlier, the difference of charging your 30 kWh EV at 17:00 and 00:00 in winter is a staggering 2.5 kg. When looking at summer fluctuations, the differences are noticeably less, and the benefits drop to 0.5 kg when charging at night. This case as mentioned is for the UK where renewable energy sources make up around 20% of the fuel mix. As this percentage is increased and electricity becomes greener, the importance of charging times increases.
2.5. Cost implications
The cost of the various AFVs varies according to their type. Costs are a large influence when considering what vehicle to purchase and can often put consumers off EVs. While important to the general consumer, fleet owners are heavily influenced by vehicle prices as it is their main cost alongside fuel. In the UK, the government is providing incentives for EVs in a bid to make them more financially viable.
- – PHEV – As the PHEV combines both conventional combustions engines with electric motors, the cost is substantially more compared to its counterpart. The most popular PHEV in the UK is the Mitsubishi Outlander PHEV (Mitsubishi 2016) with an average retail price of £37,000 after grants. A similar spec Mitsubishi Outlander conventional combustion engine is around £30,000 (Mitsubishi 2016). The increase in cost is mainly down to the battery, the additional research and design, and the electronics needed in the production of the vehicle. The battery alone costs in the region of £230 per kWh (Nykvist and Nilsson 2015) and while PHEV’s batteries tend to be smaller than BEV, the costs still add up as the capacity in the Outlander PHEV is 12 kWh. Servicing costs are typically higher as well, as specialist tools are needed.
- – E-REV – E-REVs are typically less common than PHEVs or BEVs. Several manufacturers add in-range extenders as an additional option on standard BEVs such as in the BMW i3 which costs an additional £2,900 to the base models £34,070 price tag (Car Buyer 2018). Current prices are difficult to find accurately, due to the current lack of available models.
- – BEV – BEVs are increasing in popularity. This is a result of a rise in eco-consciousness and also due to the reduction in cost, thanks to lower battery production costs. Nykvist and Nilsson found that battery prices in 2015 were already below the target for 2017 (Nykvist and Nilsson 2015). A typical BEV (Nissan Leaf 30 kWh 2016) costs in the region of £25,000, whereas a comparable spec combustion vehicle Nissan Pulsar 2016 is around £19,000. These costs are potentially offset in the future due to the running costs compared between the two types over a certain number of miles and the government grant provided for the EV (Nissan UK 2016).
- – HEV – HEVs have been around for a while now and as such their value is considerably less. They were introduced before the mainstream BEVs and since the increase in range allowance PHEVs are becoming increasingly uncommon. Batteries are guaranteed for 8 years and operate at 30%–80% SOC to reduce stress and large voltage changes. However, they provide a high-cost low-density solution, nearly, all today use nickel-metal hydride batteries (Battery University 2016; Zhou et al. 2013).
- – FCEV – FCEVs are relatively new technology and as a result, their cost is typically very high. They are not readily available in most markets with the majority used currently in testing.
Many countries are offering incentives for electric vehicles in a bid to make them more appealing to the consumers. Jin et al. (2014) suggest that these incentives are important factors when trying to promote electric car sales. Outside the UK, countries such as China employs tax incentives when purchasing an EV. Exemption from acquisition and excise taxes can range from £4500 to £7500. In European countries, other examples of cost incentives such as in Norway include BEVs being exempt from VAT (Mock and Yang 2014). The UK government provides up to £4,500 for cars and this increases up to £8,000 for commercial vehicles (UK GOV 2016). The costs of batteries are a major reason why in general electric vehicles are more expensive than their traditional internal combustion engine counterparts. Battery prices have recently hit their lowest cost for the last 9 years, and it is expected that as technology increases, these costs will continue to drop. In 2013, the International Energy Agency (IEA) estimated that, by the year 2020, battery prices will fall low enough so that electric vehicle match conventional vehicles with a cost of £220/kWh of capacity. However, the current cost has already met this target with a current price of just £200/kWh a fall of 73% since 2007 when the price was £760/kWh (International Energy Agency 2019; US Department of Energy 2016). This information provides encouraging signs on the possibility of manufacturer batteries at low prices enabling EVs to be readily available to consumers at good prices.
2.6. Conclusion
The chapter sheds light on various options and features of the green technology-based vehicles in terms of emissions related to the transport industry. It is perceived that the range of AFVs is very diverse, carrying with them both advantages and disadvantages. As technology flourished consequently these characteristics may change, incorporating them within transport systems can not only provide better accuracy when developing transport routing strategies, but they can also provide companies and policy-makers with alternatives that can have a positive impact on the environment. In our view, they have a key role to play in the UK’s transport network and combined with a robust infrastructure can make a positive impact toward reducing the emissions. The incorporation of a structured EV network is key when looking toward a greener future; examples demonstrated in this chapter highlight the importance of charging times and the recent advancements in technology. Combining the two can help reduce air pollution and help fight climate change. The study in this chapter is also meant to trigger further research on fleet management, modeling investigating features and options that are not incorporated in the previously developed relevant models.
2.7. References
AEA. (2008). Assessment with respect to long term CO2 emission targets for passenger cars and vans [Online]. https://ec.europa.eu/clima/sites/clima/files/transport/vehicles/docs/2009_co2_car_vans_en.pdf. Accessed January 23, 2019.
Afroditi, A., Boile, M., Theofanis, S., Sdoukopoulos, E., and Margaritis, D. (2014). Electric vehicle routing problem with industry constraints: trends and insights for future research. Transportation Research Procedia, 3, 452–459.
Arslan, O., Yildiz, B., and Karasan, O. E. (2015). Minimum cost path problem for plug-in hybrid electric vehicles. Transportation Research Part E: Logistics and Transportation Review, 80, 123–141.
Autocar. (2015). Report [Online]. https://www.autocar.co.uk/car-news/industry/vw-emissions-scandal-nine-vw-vehicles-have-false-co2-ratings. Accessed June 24, 2018.
Bashash, S., Moura, S. J., Forman, J. C., and Fathy, H. K. (2011). Plug-in hybrid electric vehicle charge pattern optimization for energy cost and battery longevity. Journal of Power Sources, 196, 541–549.
Battery University. (2016). Hybrid electric vehicles and the battery [Online]. http://batteryuniversity.com/learn/article/hybrid_electric_vehicles_and_the_battery. Accessed November 5, 2016.
Battery University. (2018). Battery specifications [Online]. https://batteryuniversity.com/learn/article/secondary_batteries. Accessed January 30, 2019.
BBC News. (2018). Mercedes defeat devices. Report [Online]. https://www.bbc.co.uk/news/business-44444361. Accessed June 18, 2018.
Botsford, C. and Szczepanek, A. (2009). Fast charging vs. slow charging: pros and cons for the new age of electric vehicles. Proceedings of 24th International Battery Hybrid Fuel Cell Electric Vehicle Symposium, Stavanger, Norway.
Brown, S., Pyke, D., and Steenhof, P. (2010). Electric vehicles: the role and importance of standards in an emerging market. Energy Policy, 38(7), 3797–3806.
Capstone Turbines Technology. (2017). Capstone turbines [Online]. http://www.capstoneturbine.com. Accessed March 12, 2017.
Car Buyer. (2018). Car Buyer News [Online]. https://www.carbuyer.co.uk/news/160068/bmw-i3-updated-with-new-batteries-and-options.
Climate Change Act. (2008). UK Government Legislation [Online]. https://www.legislation.gov.uk/ukpga/2008/27/contents. Accessed January 30, 2019.
Davis, B. and Figliozzi, M. (2013). A methodology to evaluate the competitiveness of electric delivery trucks. Transportation Research Part E: Logistics and Transportation Review, 49(1), 8–23.
De Gennaro, M., Paffumi, E., Martini, G., and Scholz, H. (2014). A pilot study to address the travel behaviour and the usability of electric vehicles in two Italian provinces. Case Studies on Transport Policy, 2(3), 116–141.
Diesel Engine Exhaust Carcinogenic. (2012). International Agency for Research on Cancer. Report [Online]. https://www.iarc.fr/wp-content/uploads/2018/07/pr213_E.pdf. Accessed January 31, 2019.
Ecotricity. (2016). Ecotricity Charging Stations [Online]. https://www.ecotricity.co.uk/for-the-road. Accessed January 15, 2017.
Electric Car Market Statistics. (2018). Plug in hybrid guide [Online]. https://www.nextgreencar.com/plugin-hybrid-cars/buying-guide/. Accessed January 15, 2019.
Energy Trends. (2019). UK Government. Report [Online]. https://www.gov.uk/government/statistics/total-energy-section-1-energy-trends. Accessed January 31, 2019.
EV Auxiliary Systems Impact. (2018). EV Auxiliary Systems Impact. Report, Idaho National Laboratory, Clean Energy & Transportation [Online]. https://avt.inl.gov/sites/default/files/pdf/fsev/auxiliary.pdf. Accessed March 10, 2019.
Fiori, C, Ahn, K., and Rakha, H. (2016). Power-based electric vehicle energy consumption model: model development and validation. Applied Energy, 168, 257–268.
Goeke, D. and Schneider, M. (2014). Routing a mixed fleet of electric and conventional vehicles. Technical Report, Darmstadt Technical University, Department of Business Administration, Economics and Law, Institute for Business Studies (BWL).
Gong, H., Linn, W., Clark, K., Anderson, K., Geller, M., and Sioutas, C. (2005). Respiratory responses to exposures with fine particulates and nitrogen dioxide in the elderly with and without COPD. Inhalation Toxicology, 17(3) 123–132.
Graham-Rowe, E., Gardner, B., Abraham, C., Skippon, S., Dittmar, H., Hutchins, R., and Stannard, J. (2012). Mainstream consumers driving plug-in battery-electric and plug-in hybrid electric cars: a quantitative analysis of responses and evaluations. Transportation Research Part A: Policy and Practice, 46(1), 140–153.
Great, B. (2014). Road traffic estimates. Report, UK Government [Online]. https://www.gov.uk/government/statistics/road-traffic-estimates-in-great-britain-2014. Accessed June 4, 2016.
Gridwatch. (2019). G.B. National Grid Status [Online]. https://www.gridwatch.templar.co.uk. Accessed March 6, 2017.
International Energy Agency. (2017). CO2 emissions from fuel combustion [Online]. https://www.iea.org/publications/freepublications/publication/CO2EmissionsfromFuelCombustionHighlights2017.pdf. Accessed January 30, 2019.
International Energy Agency. (2019). Energy storage [Online]. https://www.iea.org/tcep/energyintegration/energystorage/. Accessed January 30, 2019.
JEC. (2011). Well-to-wheels, Appendix 2, WTW GHG Emissions of Externally Chargeable Electric Vehicles. Report, JEC (Joint Research Centre – EUCAR – CONCAWE Collaboration) [Online]. http://iet.jrc.ec.europa.eu/about-jec/sites/iet.jrc.ec.europa.eu.aboutjec/files/documents/wtw3_wtw_appendix2_eurformat.pdf. Accessed October 20, 2018.
Jin, L., Searle, S., and Lutsey, N. (2014). Evaluation of state-level US electric vehicle incentives. Report, The International Council on Clean Transportation.
Jung, H. and Li, C. (2018). Emissions from plug-in hybrid electric vehicle (PHEV) during real world driving under various conditions. Report, University of California, Riverside, Centre for Environmental Research and Technology.
Khan, S. (2018). Strategy for the future of London’s transport. Report. UK Government [Online]. https://www.london.gov.uk/press-releases/mayoral/strategy-for-the-future-of-londons-transport. Accessed November 16, 2018.
Keskin, M. and Catay, B. (2016). Partial recharge strategies for the electric vehicle routing problem with time windows. Transportation Research Part C: Emerging Technologies, 65, 111–127.
Lukic, S. and Pantic, Z. (2013). Cutting the cord: static and dynamic inductive wireless charging of electric vehicles. IEEE Electrification Magazine, 1(1), 57–64.
Mathiesen, K. and Neslen, A. (2015). VW scandal caused nearly 1m tonnes of extra pollution, analysis shows [Online]. https://www.theguardian.com/business/2015/sep/22/vw-scandal-caused-nearly-1m-tonnes-of-extra-pollution-analysis-shows. Accessed August 15, 2016.
Mitsubishi. (2016). Mitsubishi UK. Report [Online]. https://www.mitsubishi-cars.co.uk/new-cars/outlander/phev/. Accessed July 17, 2017.
Mock, P. and Yang, Z. (2014). Driving electrification. A global comparison of fiscal incentive policy for electric vehicles. Report, International Council on Clean Transportation.
NASA. (2010). Ultracapacitors technology [Online]. https://technology.nasa.gov/patent/MFS-TOPS-76. Accessed December 21, 2018.
New Car CO2 Report. (2018). Society of Motor Manufacturers and Traders. Report [Online]. https://www.smmt.co.uk/wp-content/uploads/sites/2/SMMT-New-Car-Co2-Report-2018-artwork.pdf. Accessed January 31, 2019.
New Vehicle Registrations. (2018). Society of motor manufacturers and traders [Online]. https://www.smmt.co.uk/category/news/registrations/. Accessed January 15, 2019.
NHS. (2019). Carbon monoxide poisoning. Report [Online]. https://www.nhs.uk/conditions/carbon-monoxide-poisoning/. Accessed January 31, 2019.
Nissan Leaf Specs. (2016). Argonne National Laboratory [Online]. http://www.anl.gov/energy-systems/group/downloadable-dynamometer-database/electric-vehicles/2012-nissan-leaf. Accessed July 9, 2016.
Nissan News. (2017). Nissan [Online]. https://uk.nissannews.com/en-GB/releases/release-426191418. Accessed November 30, 2019.
Nissan UK. (2016). New vehicle pricings [Online]. https://www.nissan.co.uk. Accessed October 30, 2016.
Nykvist, B. and Nilsson, M. (2015). The EV paradox – a multilevel study of why Stockholm is not a leader in electric vehicles. Environmental Innovation and Societal Transitions, 14, 26–44.
Onewedge. (2018). An EV taxonomy [Online]. https://onewedge.com/2018/02/19/an-ev-taxonomy/. Accessed January 30, 2019.
Prasad, R. and Bella, V. R. (2010). A review on diesel soot emission, its effect and control. Bulletin of Chemical Reaction Engineering & Catalysis, 5(2), 69–86.
2018 Progress Report to Parliament Committee on Climate Change. (2018). Reducing UK emissions – 2018 progress report to Parliament. Report, Committee on Climate Change [Online]. https://www.theccc.org.uk/comingup/ccc-report-2018-progress-report-parliament. Accessed February 3, 2019.
Rambaldi, L., Bocci, E., and Orecchini, F. (2011). Preliminary experimental evaluation of a four wheel motors, batteries plus ultracapacitors and series hybrid powertrain. Applied Energy, 88(2), 442–448.
Renewable Energy Foundation (REF) (2019). [Online]. https://www.ref.org.uk/energy-data. Accessed March 20, 2019.
Reis, H., Reis, C., Sharip, A., Reis, W., Zhao, Y., Sinclair, R., and Beeson, L. (2018). Diesel exhaust exposure, its multi-system effects, and the effect of new technology diesel exhaust. Environment International, 114, 252–265.
Road Transport and Environment. (2016). UK Government. Report [Online]. https://www.gov.uk/transport/road-transport-and-the-environment. Accessed February 16, 2017.
Rückerl, R., Greven, S., Ljungman, P., Aalto, P., Antoniades, C., Bellander, T., Berglind, N., Chrysohoou, C., Forastiere, F., Jacquemin, B., von Klot, S., Koenig, W., Küchenhoff, H., Lanki, T., Pekkanen, J., Perucci, C. A., Schneider, A., Sunyer, J., and Peters, A. (2007). Air pollution and inflammation (interleukin-6, C-reactive protein, fibrinogen) in myocardial infarction survivors. Environmental Health Perspectives, 115(7), 1072–1080.
Saxena, S., Le Floch, C., MacDonald, J., and Moura, S. (2015). Quantifying EV battery end-of-life through analysis of travel needs with vehicle powertrain models. Journal of Power Sources, 282, 265–276.
Schönewolf, W. (2011, October 25). E-City-Logistik. Status-Seminar Elektromobilität BerlinBrandenburg, Berlin.
Su, Y. C., Beom, W. G., Seog, Y. J., and Chun, T. R. (2015). Advances in wireless power transfer systems for roadway-powered electric vehicles. IEEE Journal of Emerging and Selected Topics in Power Electronics, 3(1), 18–36.
Suh, I. S. (2011). Intelligent wireless EV fast charging with SMFIR technology. Journal of Integrated Design and Process Science, 15(3), 3–12.
Sumper, A. and Baggini, A. (2012). Electrical Energy Efficiency: Technologies and Applications. ISTE Ltd, London and Wiley, New York.
Sydborn, A., Blomberg, A., Parnia, S., Stenfors, N., Sandstrom, T., and Dahien, S.-E. (2001). Health effects of diesel exhaust emissions. European Respiratory Journal, 17, 733–746.
Ultra Low Emission Zone (ULEZ). (2018). Report. Transport for London [Online]. https://tfl.gov.uk/modes/driving/ultra-low-emission-zone. Accessed December 4, 2018.
ULEV in the UK. (2015). UK Government [Online]. https://assets.publishing.service.gov.uk/government/uploads/system/uploads/attachment_data/file/464763/uptake-of-ulev-uk.pdf. Accessed January 10, 2019.
UK GOV. (2016). Government provisional emission statistics. Report, UK Government [Online]. https://www.gov.uk/government/publications/2010-to-2015government-policy-greenhouse-gas-emissions/2010-to-2015-government-policygreenhouse-gas-emissions. Accessed December 2, 2016.
UK GOV. (2017). Fuel mix disclosure tables. Report, UK Government [Online]. https://www.gov.uk/government/collections/fuel-mix-disclosure-data-tables. Accessed February 5, 2019.
US Department of Energy. (2016). Cost and price metrics for automotive lithium-ion batteries. Report, US Department of Energy [Online]. https://www.energy.gov/sites/prod/files/2017/02/f34/67089%20EERE%20LIB%20cost%20vs%20price%20metrics%20r9.pdf. Accessed May 24, 2017.
World Nuclear. (2018). Nuclear power in the UK [Online]. http://www.world-nuclear.org/information-library/country-profiles/countries-t-z/united-kingdom.aspx. Accessed January 20, 2019.
Yang, J. and Sun, H. (2015). Battery swap station location-routing problem with capacitated electric vehicles. Computers & Operations Research, 55, 217–232.
Zap-Map. (2019). Charging location statistics [Online]. https://www.zap-map.com/statistics/#region. Accessed January 10, 2019.
Zheng, Y., Dong, Z. Y., Xu, Y., Meng, K., Zhao, J. H., and Qiu, J. (2013). Electric vehicle battery charging/swap stations in distribution systems: comparison study and optimal planning. IEEE Transactions on Power Systems, 29(1), 221–229.
Zhou, X., Young, K., West, J., Regalado, J., and Cherisol, K. (2013). Degradation mechanisms of high-energy bipolar nickel metal hydride battery with AB5 and A2B7 alloys. Journal of Alloys and Compounds, 580, S373–S377.
Chapter written by Niaz WASSAN, Angus FURNEAUX and Said SALHI.