
7.2 HRTF parameterization
The parameterization method that is outlined below employs several novel concepts. First, instead of processing existing HRTFs phase or magnitude spectra, a parameter-based analysis and synthesis approach is pursued using perceptually relevant transformation. Second, the proposed method enables modification of the amount of parameters to represent HRTFs in an adaptive fashion. Third, it is based on inter-aural phase relationships only, while completely discarding the absolute phase characteristic of HRTFs. Fourth, a comparison can be made between spectrally smooth and step-wise approximations.
7.2.1 HRTF analysis
The HRTF analysis step extracts parameters from an head-related impulse response (HRIR) pair of a specific spatial position. In a first step, the HRIR impulse responses hl(n), hr(n) are converted to frequency domain HRTFs using an M-point FFT, resulting in frequency-domain HRTFs Hl(m), Hr(m). Subsequently, the parameters are extracted that characterize the HRTFs by a set of perceptually motivated basis functions. The basis functions form a set of bandpass filters that mimic the known (spectral) limitations of the human auditory system. Given their bandpass characteristic, the basis functions are referred to as parameter bands. Each parameter band (or basis function) has an associated parameter band index b (b = 0,..., B − 1). The parameter band basis functions are specified in a matrix Q that has M rows and B columns. Each column (i.e. each parameter band index) specifies the parameter band filter characteristic (i.e. the form of the basis function) along FFT bin (frequency) index m. For example, a certain parameter band b may comprise a certain limited range of FFT bin indexes m = mb,...,mb+1 − 1. In that case, all values of Q in row b are zero, except for the columns m = mb,...,mb+1 − 1, which are set to nonzero values (for example +1). Two examples of parameter band basis functions are given in Figure 7.1. The entries Q(m, b) of the matrix Q are given for parameter bands b− 1, b and b+ 1 (only nonzero values are shown for clarity). The horizontal axes denotes the FFT-bin index m; the vertical axis represents the value Q(m, b). The top panel shows Q(m, b) for nonoverlapping parameter bands, i.e. each FFT index is associated with one unique parameter band b. In this case, due to the absence of any (spectral) overlap of parameter bands, the parameter band basis functions are orthogonal. The lower panel demonstrates overlapping parameter bands. In that case, the values Q(m, b) comprise discretely sampled triangular shapes that are centered on the center frequency (or center FFT-bin) of a parameter band. The sum of all values Q(m, b) across parameter bands b equals +1. Furthermore, it can be observed that the parameter bandwidth is different for the three parameter bands (b − 1, b, b + 1).
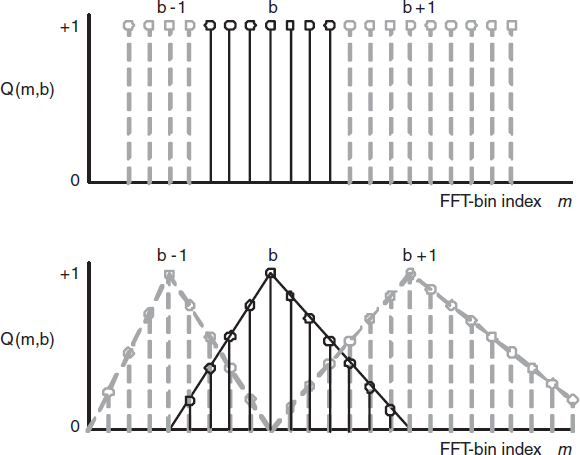
Figure 7.1 Parameter band basis functions for nonoverlapping bands (top panel) and overlapping bands (lower panel). Only nonzero values are shown for clarity.
The center frequencies fc(b) (in Hz) of each parameter band b are spaced according to a warped ERB scale:
![]()
with w the warp factor. For w = + 1, the parameter bandwidths and center frequencies fc of each parameter band b exactly follow the ERB scale [98]. For larger values of w, the center frequencies are spaced wider and consequently, the parameter bandwidths become wider with a factor w, and the number of parameter band basis functions B decreases.
For a given warp factor w and a given FFT length M, the ERB-scale frequencies fc for each parameter band b are converted to FFT-bin indices mb (using the nearest integer index, while at the same time ensuring a minimum ‘width’ of 1 FFT bin for each band b).
In the next step, the various parameter band basis functions are used to model the spectral envelope of each HRTF, as well as the inter-aural phase characteristic. For example, the power phi,b of HRTF Hi can be extracted for each parameter band b:
![]()
where matrix Q+ is the pseudo-inverse of the parameter band matrix:
![]()
In a similar fashion, the IPD ϕhlhr,b for parameter band b can be extracted using:
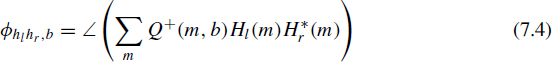
A comparison between original HRTF spectra and extracted parameters is shown in Fig 7.2. The top panels represent the magnitude spectra of the left ear (top left panel) and right ear (top right panel); the lower panel represents the interaural phase angle. The solid lines are the magnitude spectra from the original HRTF (subject ‘3’ from the CIPIC database [2], for an elevation of 0 and azimuth of 65° to the left), the circles represent the parameter values and are given as a function of the center frequency of the respective basis function. The parameters were extracted using overlapping parameter bands and w = 2.0 (resulting in B = 20 bands). As can be observed from the top panels, the parameter frequencies are approximately linearly spaced on a logarithmic axis. Furthermore, the match between parameter values and magnitude spectra is quite accurate for low frequencies, while at high frequencies, some fine-structure details in the magnitude spectra are not represented by the coarsely sampled parameter values.
7.2.2 HRTF synthesis
The reconstructed complex-valued HRTF spectra Ĥl, Ĥr are obtained by reinstating the extracted parameters (phl,b,phr,b, and ϕhlhr,b) on (the spectrum of) a Dirac impulse using the basis functions Q. If during analysis stage, overlapping bands were employed, the same overlapping bands were used during HRTF reconstruction.
In principle, IC parameters should be extracted as well, but given the high IC values for the HRTF set under test, the IC parameters were assumed to be sufficiently close to +1 and hence no dedicated HRTF decorrelation procedure was required. It should be noted however that this can not be generalized to arbitrary HRTF sets. More detailed information on HRTF parameter extraction and synthesis can be found in [202].
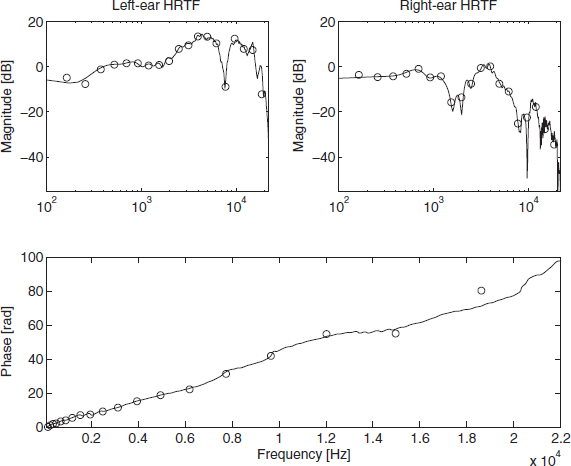
Figure 7.2 Comparison between original HRTF spectra (solid lines) and extracted parameters (circles) for the left-ear magnitude spectrum (top left panel), the right-ear magnitude spectrum (top right panel) and the interaural phase (bottom panel).
Two examples of reconstructed magnitude spectra are shown in Figure 7.3. The original (dotted line) and the reconstructed (solid line) HRTF magnitude spectra for the left ear are shown using overlapping bands (top panel) or nonoverlapping bands (lower panel). Comparison of the two panels in Figure 7.3 clearly reveals the step-wise approach of the nonoverlapping bands, while the overlapping bands give a smooth (interpolated) magnitude spectrum.