
7.3 Sound source position dependencies
7.3.1 Experimental procedure
In a first experiment, the aim was to determine the minimum number of parameter band basis functions required to represent the left and right HRTFs for a specified position to obtain a fully transparent representation of an HRTF pair.
As outlined in Section 7.2, Equation (7.1), the warp factor w directly influences the number of parameter bands used for describing the parameterized HRTF spectra. With an increase of w, the number of parameter bands decreases and hence the error or difference between original HRTF spectra and parameterized HRTF spectra will increase. In this subjective evaluation, the parameterized HRTF pair was compared with the original HRTF pair for the same location. During the experiment, the value of w was changed adaptively to determine a threshold value. This experiment was performed for both overlapping as well as nonoverlapping parameter bands.
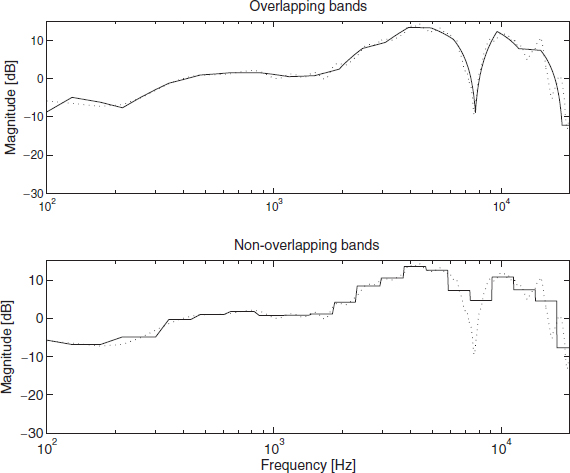
Figure 7.3 Reconstructed (solid line) HRTF magnitude spectra (left-ear only) using overlapping parameter bands (top panel) or nonoverlapping bands (lower panel). The dotted lines indicate the original HRTF magnitude spectra.
Table 7.1 Elevation and azimuth (in degrees) for the nine positions under test.
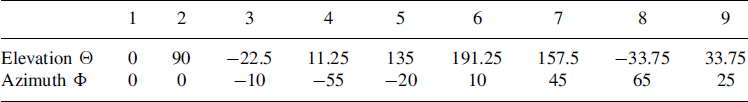
A set of nine different spatial positions were selected. These nine selected sound source locations are listed in Table 7.1. The horizontal polar coordinate system was employed to indicate azimuth Φ and elevation. Θ publicly available HRTF database was used (CIPIC, [2]).
For each subject, thresholds were determined for each of the nine positions and for both parameterization methods (overlapping and nonoverlapping). The stimulus was a 300 ms burst of pink noise, followed by 200 ms of silence. Within each trial, the same noise realization was used for each of the three intervals. A new noise realization was generated for each trial.
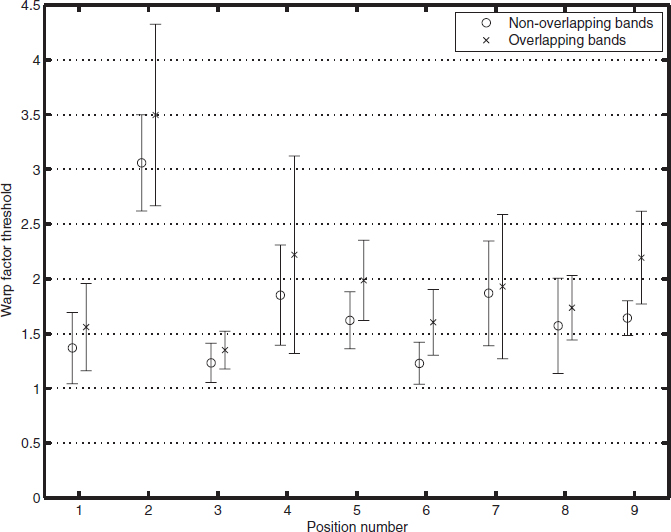
Figure 7.4 Thresholds (y-axis) of the warp factor w as a function of the nine sound source locations (x-axis). Different symbols indicate different parameterization methods (see text). Error bars denote the standard deviation of the results across subjects and trials.
7.3.2 Results and discussion
The results of the listening test are shown in Figure 7.4. The thresholds of the warp factor w are shown as a function of the sound source position, with the numbers 1 to 9 referring to the positions given in Table 7.1. The results are averaged across subjects and repetitions; the error bars denote the standard deviations of the results across all respective trials. The circles indicate results for the nonoverlapping parameterization method, while the crosses represent results for overlapping (triangular) parameter bands.
As can be observed from Figure 7.4, position number 2 gives a remarkably higher threshold value (between 3 and 3.5) than the other positions, which vary between 1.2 and 2.2. Both parameterization methods show a very similar trend, although the threshold values for the overlapping parameter method are up to about 0.5 ERB higher than for the nonoverlapping method. Interestingly, none of the average threshold values is below 1.0 ERB.
The averaged threshold that was observed in the experiments has a value that is larger than +1, for all positions and both methods. Moreover, values below +1 were only observed for the nonoverlapping parameterization method. This result strongly supports our hypothesis that a 1-ERB spectral resolution is sufficient to represent HRTFs without any perceptual degradation.
The threshold for the warp factor w also depends on the position of the sound source. For position number 2(Θ = 90°, Φ = 0°), the average threshold was found to be higher than for all other positions in the test. The smallest w values were found for positions 1 (Θ = 0°, Φ = 0°), 3 (Θ = −22.5°, Φ = −10°) and 6 (Θ = 191.25°, ϕ = 10 °). These positions are all close to the median plane. A possible explanation for this result is that the spectral shape of the HRTFs for these positions seems to have more pronounced details, resulting in a higher number of parameter bands to fully describe all perceptually relevant attributes. For position 2, on the other hand, the HRTF spectra are relatively smooth and can hence be modeled with a relatively limited set of parameters (resulting in a high threshold value).
Finally, there exists a systematic difference between the two parameterization methods. The triangular, overlapping parameter bands consistently result in higher thresholds (2.02 on average) than the orthogonal, rectangular parameter bands (w = 1.69, i.e., the latter requires more parameter bands for a perceptually identical representation). The reason for this finding might be related to the step-wise approximation of the HRTF spectrum for the nonoverlapping method compared to a much more smooth HRTF approximation for the overlapping parameter bands. Possibly the actual error between approximated and actual HRTF spectrum is larger for the nonoverlapping parameterization method, or subjects could use the sharp spectral edges as cues to detect stimuli resulting from the nonoverlapping parameterization method more easily.