
For your convenience, here you will find:
Checklists to assess the risk of new customizations;
Pre- and post-release checklists for new customizations;
Gauges to monitor email sending and receiving activity;
Charts to monitor and pinpoint performance issues.
Risk assessment
To determine the risk associated with a new change to ServiceNow consider the following questions:
Is the change documented in ServiceNow’s official online documentation (e.g., a property setting, enabling of a plugin, or a Useful script)?
Does the new change modify code used to process incoming emails or outgoing notifications?
Does the change involve server-side scripting, such as in a business rule or a script include?
Does the change modify how users are matched between your directory server and ServiceNow ?
Will the change affect all users or just those of a particular application (e.g., Asset Management)?
Does the change mass update records at once (e.g., through a background script or scheduled job)?
Will the change be deployed using update sets which can be rolled back or will it be performed in the instance?
The riskier the change the more careful you will want to be with testing and monitoring post-release.
You also want to make sure you have a fallback plan with stakeholders (e.g., temporarily stop emails redirected to ServiceNow) in case you end up needing some extra time.
Checks before deployment to Production
Before you commit your changes to the production instance it helps to set expectations with your stakeholders. Verify if:
A ticket has been logged in ServiceNow describing the new feature or change;
Stakeholders have been informed about the change and its potential impact on their use of ServiceNow;
Training and documentation have been provided for how the new feature works (if necessary);
The change has been made in a non-production environment similar to your production instance;
There is testing evidence of the change working as expected;
The change is consistent in behavior and usability with existing modules of the application;
Possible side effects of the changes have been considered and tested (e.g., no duplicate emails are now generated).
Checks after deployment
After you deploy, and depending on what areas of the application were affected, you may want to test and monitor that:
The new features work as expected in the live instance;
All emails sent and received from ServiceNow after the change have a record attached to them and no error message;
The number of emails sent for ticket updates after the change is consistent with your expectations;
There are no new errors at the scheduled synchronization of users between your directory servers and ServiceNow;
New tickets have been logged in successfully since the change and older ones have been updated with no issues.
Special checks
Depending on which modules you use in ServiceNow, you will normally want to inquire and carefully test changes that affect any of the following:
Inbound email actions
Email notifications
LDAP sync settings
Business rules
Inbound email actions
Inbound email actions are perhaps the most critical component of your ServiceNow application as it’s responsible for processing incoming emails to your instance.
You want to avoid and minimize changes to such a central and impactful module in your application by making sure for example that your inbound email action scripts contain only code strictly related to the processing of emails and that it may be rarely changed.
If a change is made to an inbound email action script or a script include referenced from an inbound email action then you need to test and monitor the correct processing of incoming emails after the change is made. In particular, you should test that:
New incoming emails create new tickets correctly;
Replies to existing ticket emails update the correct ticket.
To be even surer and quickly uncover unexpected issues, you can also monitor emails processed since the changes were deployed. Monitor the following things in particular:
Error logs generated from the email processing scripts;
Incoming emails with an ignored status in ServiceNow or without an associated target record; That is, it didn’t update any ticket (Figure A-1)

Figure A-1. Monitor incoming email logs for non-empty error messages and emails that updated no ticket.
Incoming emails monitor
You can create a gauge to monitor incoming emails that have not yet been matched with any ticket (Figure A-2).
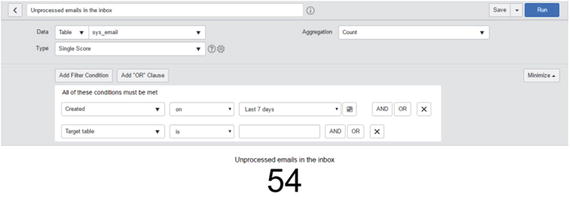
Figure A-2. Create a report that you can pin to the home page to keep track of incoming email activity and possible issues.
If the number fluctuates it means that you are receiving emails, they are processed and matched with tickets, and the cycle repeats.
If instead the number remains stagnant you may have a problem processing emails (or you receive too few emails and they are processed very quickly).
In a busy instance, the number of unprocessed emails may not go down to zero as some emails are intentionally received and ignored. Clicking on the number you can preview the kind of emails that are unprocessed and confirm if there is an issue or not.
Outgoing emails monitor
Because it can happen that emails get stuck in ServiceNow and are not processed or that emails remain in the outbox queues but are not sent for hours add a gauge indicative of email activity to the home page of your Servicedesk (as in Figure A-3 or A-4).

Figure A-3. Gauge to keep track in real time of the number of emails in send-ready state.
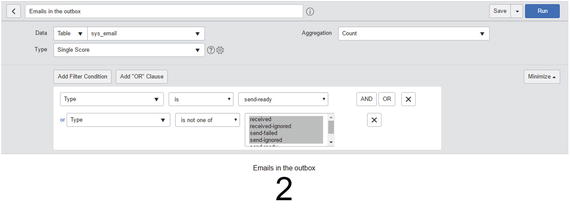
Figure A-4. Counter to keep track in real time of the number of emails in send-ready state.
The gauges displays how many emails there are in send-ready state. If the number keeps fluctuating (going up and down), it means the instance is successfully generating new emails to send and sending them.
However if the number remains the same for a while or keeps going up only then you have a problem. There may be an issue sending emails through the email server (check connectivity with SMTP servers) or with email notifications not being generated (in case the number is always zero).
When setting the gauges you also want to track emails that are not of an unknown email types because that’s likely to be an error state.
Email notifications
Email notifications settings in ServiceNow directly affect what your end users will receive or not receive from your instance. Tread carefully when changing, adding, or removing email notifications.
If you make changes to email notifications be sure to count and monitor how many emails are sent out about the same ticket at the same time. Changes to email notifications in ServiceNow can easily result in duplicate notifications being sent to the same people.
Your email notifications will also contain links, for example the link to preview the ticket in a web browser. Test those links after release as they may be broken or point to your non-development instance.
LDAP sync settings
Changes to your LDAP sync settings may result in the duplicate import of users from Active Directory or a failure to import new ones. After making changes, it is important to run a synchronization between the two and cross-check that:
The number of imported and updated users is consistent with your expectations;
There are no new errors in the LDAP logs.
Business rules
Business rules in ServiceNow basically define things that happen to the ticket on the server. For example assigning the ticket to a certain group based on the location of the caller.
Because the update happens after the user completes his action business rules can lead to unexpected behavior contrary to the user’s will. For this reason you want to be careful with the introduction or edit of business rules and in particular check that:
The business rule doesn’t silently overwrite a value the user had set on the form. If the value entered by the user is not what you want it to be, prevent the ticket from being submitted erroneously, or at least let the business rule inform the user.
In some cases your business rule makes changes such as rounding time fields. In such case, let it also inform the user of the change.
the business rule doesn’t conflict with other business rules that may also run on the same update.
Charts to measure slowness
If your users are complaining about slowness you can use a chart to crystallize who experienced slowness and when as well as compare the slowness to other time periods of the day or of the week (Figure A-5).

Figure A-5. Bar chart showing how many times users had to wait every day of the week.
Besides the satisfaction and sense of control that those charts provide you with they can also be very useful when reporting performance issues to ServiceNow.
In the chart settings you can control the sensitivity of wait time. In the settings shown below in Figure A-6 for example, we report on all user transactions in which the user had to wait more than 10 seconds. You can change the sensitivity of wait time as you see fit.

Figure A-6. The Trend chart counts how many times in the day users had to wait more than 10 seconds at once.
The colors staked in the bars of Figure A-5 represent the users that had to wait; if you click on each color you will be taken to the user transaction that took so long to execute as shown in Figure A-7.
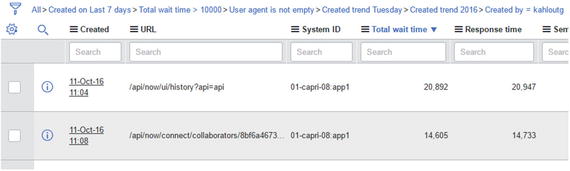
Figure A-7. From the chart you can drill and see details of the longest-running user transactions.
The above chart in Figure A-5 is good to keep an eye on the application performance and quickly identify if performance seems to have suddenly worsened recently.
When you determine that slowness is indeed being experienced across the application you can check a few more charts like those in Figure A-8 to better understand the impact of the slowness and if there is any bottleneck.

Figure A-8. On a troubling day you can preview in which hours slowness was most experienced and compare if it coincided with long-running system transactions
The chart above on the left shows users’ wait time hour by hour during the day. The chart on the right shows all long-running transactions in ServiceNow also hour by hour during the day. Putting them next to each other you could identify if there are long-running system transactions that severely influenced user transactions wait time as well.
Finally on performance, day of the week comparisons of user wait times give you a good indication if performance is good on the day relative to other days of the week. But to get a better picture of your application performance in general you can extend the charts to a longer period of time as shown in Figures A-9 and A-10 below and see if things are relatively stable, improving, or worsening.
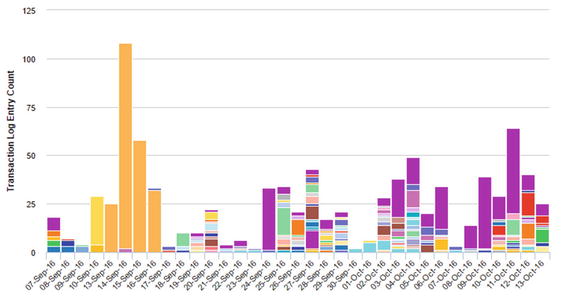
Figure A-9. Compare wait times over the past month to get a sense if performance is relatively stable, worsening, or improving.
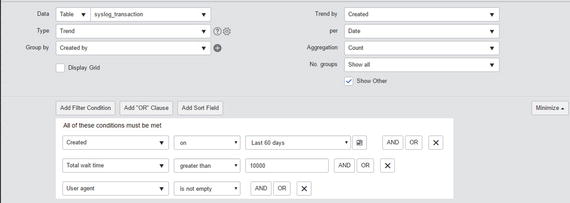
Figure A-10. To compare performance over a longer period of time, create a Trend report trending by date.
Note that there are other charts and monitors mentioned in Chapters 3 and 11.