
With the statistics Pivot complete, let's visualize the data:
- Select the Area Chart visualization tool in the left menu bar, as shown in the following screenshot:

The next page will show you an array of options that you can choose from to change the way your area chart behaves, side by side with the chart. Depending on how long you have been running Splunk on your machine, you should see a stacked area chart similar to the following screenshot:

- Here are some additional steps to improve the chart. In the X-Axis (Time) section, choose to hide the Label. This will remove the _time label on the x axis:

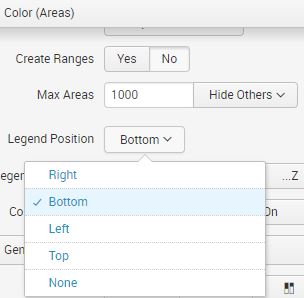
- Scroll down in the chart settings area to the Color (Areas) section, and move the Legend Position to the bottom, as shown in this screenshot:
- Your area chart is now ready to be saved as a Dashboard panel. Click on the Save As button and select Dashboard Panel.
- Let's create a new dashboard called Summary Dashboard.
- Change the permission to Shared in App.
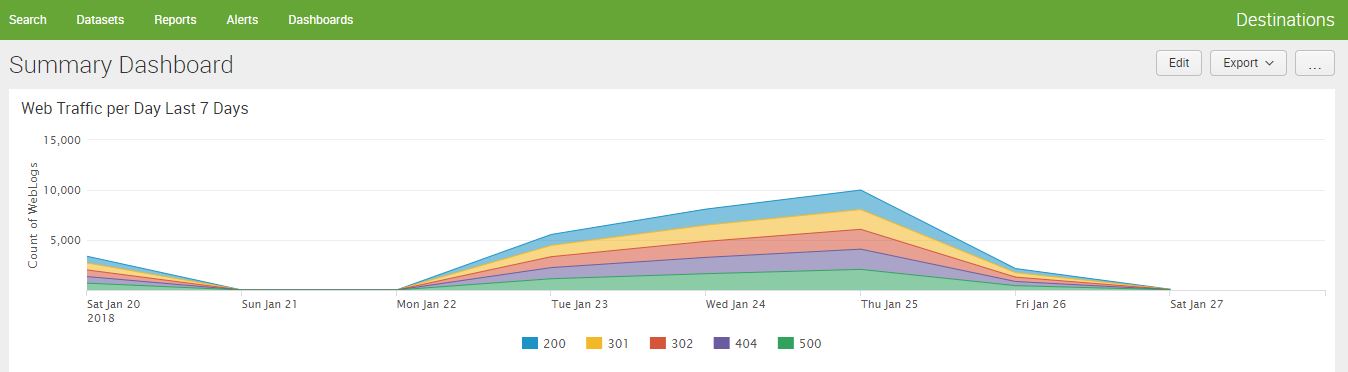
- Finally, change the Panel Title to Web Traffic per Day Last 7 Days.
- Click on Save to finish and click on View Dashboard. Use the following screenshot as a guide:

You now have a single-panel dashboard that is driven by the data model that you just created. It should look similar to what is shown here:
We will now add more Pivot-driven analytics to this dashboard.