
In this section, we will learn how to alter the look of our panels and create visualizations.
Go to the edit dashboard mode by clicking on the Edit button.
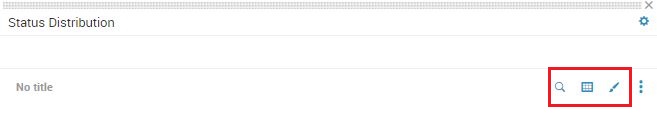
Each dashboard panel will have three setting options to work with: edit search, select visualization, and visualization format options. They are represented by three drop-down icons:
The Edit Search window allows you to modify the search string, change the time modifier for the search, add auto-refresh and progress bar options, as well as convert the panel into a report:

The Select Visualization dropdown allows you to change the type of visualization to use for the panel, as shown in the following screenshot:

Finally, the Visualization Options dropdown will give you the ability to fine-tune your visualization. These options will change depending on the visualization you select. For a normal statistics table, this is how it will look:
