CHAPTER 13
Fundamental analysis
So far, we have discussed some of the mechanics of buying and selling shares, and covered some of the reasons for developing an investment strategy when creating a diversified portfolio. For those investors who like to undertake their own analysis or want a better understanding of how their adviser may make an individual share recommendation, this chapter and the next one will introduce two broad approaches to share analysis: fundamental analysis and technical analysis.
Fundamental analysis is the study of the various factors that affect a company’s earnings and dividends, as well as the impact on the relative safety of an investment in a certain company due to the relationship between its share price and the various elements of its financial position and performance.
Fundamental analysis also involves a detailed examination of the company’s competitors, the industry or sector it is within, and perhaps the domestic and global economic climate. Fundamental analysts may examine the growth prospects for the sector. Future levels of general economic activity are also used to help determine whether a company’s prospects are improving or not.
Fundamental analysis can be quantitative, which involves looking at the hard numbers and either developing benchmarks or hurdles for the individual company to exceed or ranking companies by the resultant ratios. Fundamental analysis can also be qualitative. Qualitative analysis is more subjective — for example, it may be a discussion with the directors of the company about their growth prospects or it could be a conversation with that company’s customers or competitors.
Fundamental analysis is forward-looking even though the data used is by and large historical. This raises an important limitation of fundamental analysis, as we will see.
Intrinsic value
Intrinsic value is the actual value or book price of a security, as opposed to its current market value. The measurement of intrinsic value is subjective because it depends on the valuation method employed.
Fundamental analysis is used to determine what the company should be worth, its ‘intrinsic value’, and/or its growth prospects. This intrinsic value can then be compared to the current value of the company as measured by the share price and market capitalisation. If the shares are trading at less than the intrinsic value, they may be seen as good value or as offering a cheap ‘entry’ price. If, however, the intrinsic value calculated by the fundamental analyst is lower than the current share price, the analyst may place a sell recommendation on the shares or, at best, a hold recommendation.
It is essential to gain a sound understanding of how to value shares and measure the efficiency and profitability of a business and its management.
One aspect of fundamental analysis that we will be examining more closely is ratio analysis and the importance of some of the many ratios. We will also look at the limitations of this analysis.
What are you trying to learn about the company?
Share investors must be clear about what knowledge they are seeking. There are some basic principles that should be remembered and questions that should be asked. When you are about to review the financials, current and historical, keep these points in the back of your mind:
- Historical costs give a poor approximation of real values.
- Don’t draw conclusions from a single financial item in isolation.
- Companies are multidimensional. For example, debt funding may have increased dramatically. While this may initially be perceived as a negative if there are no sales to help generate cash to pay the interest, it could be a positive if used correctly. Indeed, not enough debt can also be viewed as sub-optimal.
- Check where the projected growth is going to come from.
- Consolidated statements could be hiding poor results in a particular sector of the group.
When you start drilling into the detail, ask yourself:
- Is the growth in turnover being achieved organically or through acquisition? (If acquired, will turnover remain the same once fully integrated into the company?)
- To what extent do current profits reflect one-off events?
- Will the profits and growth rates be sustainable over the longer term? This depends on industry structural issues (how many competitors) as well as the economy. What is the company’s pricing power? Are there natural barriers to entry that may prevent a competitor from entering and reducing prices?
In fundamental analysis, in-depth research into a company is compiled. Several statements are examined. These include the company’s:
- balance sheet
- profit and loss statement
- cash flow statement
- letter to shareholders.
Value investing
We will now look at an example of a fundamental-analysis approach that attempts to rank companies according to whether they represent good ‘value’. This is an example of a possible strategy only and you should obtain advice from a professional adviser prior to making any investment decisions.
Value-based investing is a style where investments are only held as long as they represent good value. The approach can be applied at each stage of the investing process. Even top-down managers, who begin the investment selection process by looking at countries, markets and sectors before looking at the individual company, may determine that country A represents better value than country B; that industry A represents better value than industry B; and, finally, that company A represents better value than company B. For both top-down managers and bottom-up managers, who start by investigating individual companies, selection is usually based on certain value criteria such as price to earnings, dividend yield, price to cash flow and price to net tangible assets.
Value investing is essentially contrarian in nature. We know that from time to time markets can misprice companies. This mispricing is often the result of emotions — when emotions are extremely enthusiastic or depressed, prices for companies do not accurately reflect the long-term fundamentals of the company. When the majority of investors do not favour particular companies despite ‘good fundamentals’, these stocks can become ‘good value’. There is a large number of value managers in Australia, including those regarded as deep value managers. The philosophy of deep value managers is quite simple and this in turn makes adherence to the proposed strategy easier. Deep value managers look for shares that are out of favour with the market but which are predicted to regain favour once the market recognises their ‘true value’.
The investment process
The investment process for value investing starts by confining the share ‘universe’ to a certain number of the largest and most liquid Australian shares that are trading in the most volume, as these are the most readily tradable shares. The shares are then compared on a like-for-like basis, looking at measures such as projected balance sheets, profit and loss and cash flows, and valuing the forecast earnings. The managers then forecast a value for the shares at a specified time in the future, calculate the expected investment returns and then rank all the shares on a daily basis.
Filters are then applied to select a certain number of shares. This number varies depending on the strategy of the manager.
From the strategies of value managers, a process of share selection that is simple and that lends itself well to emulation can be developed. An example is set out below. This technique is something that an investor may use as a starting point to determine its suitability:
- Select the most frequently traded 100 companies from the S&P/ASX 200, using trading volume figures.
- Determine a three-year forecast of intrinsic ‘fair value’ based on P/E ratio, EPS growth and dividends using historical data.
- Rank shares according to best relative value.
- Select the top 25 to 35 for the portfolio.
- Monitor the investments regularly to ensure they continue to meet requirements and standards.
- Sell off investments that no longer meet the criteria.
A simpler approach
An example of a simpler approach to value investing is the Australian version of the ‘Dogs of the Dow’ strategy, originally developed by Michael O’Higgins in the United States.
The steps are:
- Start with the top 50 industrial companies by market capitalisation.
- Rank them in descending order by dividend yield.
- Buy equal dollar amounts of the top-10 ranked companies.
- Hold for one or two years and repeat the process.
Before you conduct any investment activity, you should speak with your financial adviser and determine the suitability of this strategy to your needs.
Market ratios
Some investors live and breathe market ratios. All their assessments are based on the numbers. Others take a more qualitative view to assessing companies and others again use a mixture of both.
When dealing with ratios there is no avoiding the numbers! But you do not need to memorise how all these ratios are calculated here and now. However, the further you travel on your investment journey and the more you read analysts’ reports and the financial press, the more familiar these ratios will become to you. So even if you do not study this section now, it would be advisable to read it so that you know what’s available. Then, perhaps you can revisit this section at a later time when you need to.
A step towards successful investing is to relate a company’s performance to the price of its shares. By calculating ‘per share’ data we can compare earnings, corporate health and even debt to a company’s share price.
How earnings affect share prices
In his model for reflexivity, one of the world’s most infamous speculators, George Soros, explains that a strong driver of share price is a company’s earnings. As earnings rise and are retained by the company, the value of the shares to the shareholder rises and so the price of the shares also rises as investors, keen to gain access to the higher earnings, become increasingly willing to pay the higher prices.
Soros’s model is shown in figure 13.1. In the model, it is evident that as the earnings rise, the share price also rises. Just as the share price starts to rise, however, you will notice some divergence. See how the share price is falling even though the earnings are still rising? What is happening here? Has the market got it wrong? On the contrary — the market is looking ahead. The market believes the high share price has factored in or taken into account the very best the company could produce and the market is now looking ahead. The market perhaps expects future declines in earnings and sell-offs in anticipation of this future decline. Investors who have held the share for some time perhaps believe this is all they are going to get, and taking profits becomes an important objective.
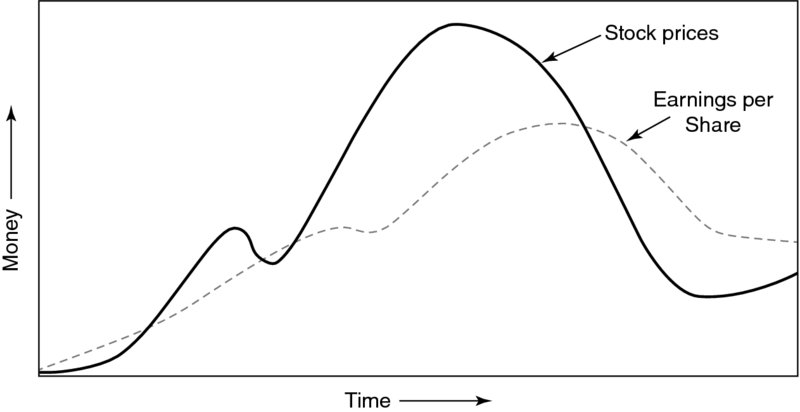
Figure 13.1: Soros’s model of reflexivity
Source: Alchemy of Finance by George Soros © 1994 by George Soros. Reprinted with permission of John Wiley & Sons, Inc.
However, when earnings continue to rise, more buyers enter the market and more favourable reports are published in the media. This enthusiasm pushes the share price above earnings per share. With time, however, the over-optimistic bias is recognised as such and expectations lower, causing prices to plummet to a point below earnings. The underlying earnings trend reverses, which reinforces the drop in prices. Finally, the pessimism of the market stabilises and the cycle moves back to its starting point.
With that understanding of how supply, demand and expectations regarding earnings affect share prices, we will now look at a number of important market ratios.
Earnings per share
The earnings per share (EPS) of a company are found using the formula below.
An EPS figure on its own means very little. It could include non-recurring items, so it is important that the analyst looks at net profit after tax but before any of the non-recurring items referred to as ‘abnormal items’. Further, the company may not necessarily pay this amount out as a dividend.
For the successful share investor, it is important to check whether the EPS has been rising or at least has been relatively stable. While this requirement will be dependent on the strategy selected, the criterion of a stable or rising earnings stream over many years may help to prevent investment in companies that are later liquidated and delisted at a loss to the investor.
From the formula, it is easy to see that there are only two ways EPS can fall — either profits decline or the number of shares increases. For the active investor, too much of either is not a good thing. A lower profit means the investor earns less, and a larger number of shareholders to share the profit with also means lower profits.
After determining the current EPS, look for trends. Has EPS been growing or falling, and how much profit is from operations rather than one-off events? If EPS is the same as last year, has there been an increase in the shares on issue? Remember — EPS does not lend itself to the determination of ‘quality’. In bear markets, analysts look much more closely at the quality of earnings and quickly dismiss one-off items. During good times, analysis may be a little more relaxed and less conservative.
Price/earnings ratio
The price/earnings ratio (P/E ratio) shows how many times, in years, it will take for your purchase to be covered by earnings. It is determined by using the formula below.
This is one of the easiest ratios to use. The P/E ratio provides an immediate comparison tool. Investors must realise, however, that P/E ratios are often based on historical earnings and therefore may be of little real use in determining a share’s value. It may be more important and more useful to use prospective earnings in the P/E ratio calculation.
The P/E ratio reflects the market’s view of the earnings potential of the company.
A low P/E ratio compared to the average P/E of the sector that the company belongs to could indicate one of three things:
- The share is underpriced.
- The share is correctly priced due to the quality (or lack thereof) of the earnings.
- The share is overpriced because the entire sector has become fashionable and the earnings are unsustainable.
Some P/Es have been shown to be based more on faith (or hype) than on substance, but solidly performing growth-oriented companies tend to have consistently higher P/E ratios. On its own, however, the P/E ratio does not really say very much. It is much more effective when used in conjunction with other measures, such as return on equity, which is discussed later in this chapter.
Dividend per share
Dividend per share (DPS) is simply the earnings payout received in your hand in cents per share, as shown below.
A thorough analyst does not merely observe consistent dividend payment over many years and then determine the investment to be ‘safe’ or the company a ‘blue chip’. It is essential to check whether the dividends were paid from the current year’s earnings or from retained earnings of previous years.
To do that, you can check the payout ratio or dividends/earnings, which shows what percentage of earnings was paid out as a dividend. The reciprocal is earnings/dividends, which is the dividend cover ratio. If the dividend cover ratio is less than one, the dividends must have been paid out of retained earnings.
Sometimes paying out all the earnings as dividends is not a good thing — for example, perhaps an above-average rate of return could be gained from using the money to fund expansion or an acquisition instead of paying dividends. At other times, if the company cannot do anything with the earnings, it will pay out a special dividend or announce a return of capital. For shareholders in good-quality companies, it may be an advantage for the company and the remaining shareholders if funds were used in a share buyback.
Dividend yield
The dividend yield is the dividend expressed as a percentage of the share price, as shown in the formula below.
This is the rate that can be used to compare the income generated from one investment to that from another. Later we will see that, due to the benefits of franking, a dividend yield of 5 per cent may be more beneficial than earning interest of 5 per cent.
High dividend yields are attractive, but even if a company is showing a dividend yield of 11 per cent and every other company in the same sector is showing a dividend yield of 5 per cent, it may not mean that the company under investigation is going to pay a high dividend. The above formula for determining the dividend yield shows there are two components that determine the yield — last year’s dividend and the current price. A high dividend yield may have been driven by a lower share price, and, given that the dividend yield is based on last year’s dividend, the lower price may indicate that the market expects next year’s dividend to be lower. Nevertheless, as we will see later, market participants regularly panic, driving prices down in expectation of significantly lower dividends, only to find later that their pessimism was unfounded.
Dividend cover ratio
The dividend cover ratio is how many times current earnings cover the dividend paid.
Cash flow per share
The formula for cash flow per share is shown below.
In the formula to determine cash flow per share, you will note that most analysts add back the depreciation because it is a non-cash expense. By adding back the depreciation (and other non-cash expenses), we arrive at a proxy for the cash earnings of the business.
Cash is an extremely important part of evaluating a company, and it becomes even more important when the economy slows and company earnings are being examined with more scrutiny. The ‘cash is king’ adage is rarely considered during periods of boom when momentum investing and growth strategies take the fore. At the first hint of slowing growth or the first mention of the word ‘recession’ professionals in the market begin touting the benefits of defensive strategies.
‘Defensive’ can mean a number of things — it can mean finding companies with earnings that are shielded from the slowing economy or ones that are derived predominantly from a country that is not subject to the slowdown. It can also mean finding companies with either a large proportion of their earnings in cash or large cash reserves. Companies with large amounts of cash or cash earnings are considered good options with defensive strategies because they are able to weather the storm and continue to pay out cash dividends or pay down some of their debt. For these reasons, focusing on cash may be a worthwhile endeavour.
Capital ratios
Capital ratios measure management’s efficiency in the use of a company’s capital and are an important indicator of a company’s long-term stability. The most important capital ratios for our purposes are the debt-to-equity ratios, which indicate the company’s level of gearing. The formulas for these ratios are shown in these equations.

There are principally two sources of funding for a company — debt and equity. The question for the company is, ‘What is the right mix?’ A company with a high proportion of debt is said to be highly leveraged or geared. Should the entity borrow more money or raise capital through the issue of shares? Doctorates have been devoted, and chairs endowed, to the pursuit of finding the right mix. Measures such as the weighted average cost of capital have been devised, and many academics and investors swear by this and the other various models that have been developed to determine both the correct mix and which source of funding to use for a given project.
Generally, debt is regarded as a cheaper source of funds than equity and so the higher the debt levels the better the return on the equity. Too high a debt level, though, and the margin of safety for a company begins to erode, so while it is important that debt is used, the company should not overextend itself. Nevertheless, if equity levels are too high compared to debt, the return to shareholders will be lower.
There are other disadvantages of too much debt. Credit ratings can be compromised and the cost of funding the debt can rise if interest rates increase. During times of low interest rates, this is often not a concern; however, if interest rates rise the cost of funding the debt could become onerous. For these reasons it is important that management strikes an appropriate balance.
To assess the correct level we need to ask ‘what if’ questions — for example, how would cash flows be affected if a recession were to transpire or if interest rates went up?
Profitability ratios
Profitability ratios are the basic test of a company’s profit performance. Three important profitability ratios are return on equity, return on assets and profit margin, as shown in these equations.
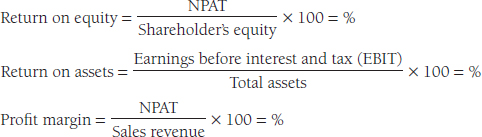
Profitability ratios measure a company’s ability to earn solid, high, sustainable and/or non-volatile profits. They measure the return the company is making on funds or other resources it has at its disposal. The return generated here, however, is not the same as that which the shareholders receive, as not all the earnings generated are paid out as dividends. Indeed, sometimes no dividends are paid out at all and the profits are reinvested by the company.
The numbers generated by these profitability ratios reflect how clever the company has been in earning money on the funds invested by the shareholders. The ability of a company to earn a decent return means it can attract future funding, perhaps at more desirable rates, and management may also gain favour with the investment community.
The results are generally an indication of a company’s financial wellbeing. The greater the amount of money that a company can generate, the more it can grow, and, as we mentioned earlier, it is growth that is necessary for sustained price increases.
Importantly, investors should remember that profitability is different from absolute profits. Profitability is the rate of return over some other part of the business — such as what the investors have entrusted to management (equity), the total resources at management’s disposal (assets) or the sales that the company generates.
As a shareholder you are an owner, and as such it is you who takes on the risk of whether a company can earn a sustainable profit over a number of years. The value of the shares you hold depends firstly on the profit-making record of the entity. So these numbers produce some of the most important indications of the quality of the business you own or are considering owning a part of.
Also worth mentioning is that it is through these ratios that most of the adjustments are made and numbers are tinkered with by analysts. For example:
- Extraordinary and/or abnormal items can be taken out to better reflect true recurring after-tax profits, meaning the figure used is often net profit after tax but before abnormal items.
- Share issues and various classes of shares (such as bonus issues and rights issues, and company options) are adjusted for, to more accurately reflect the return to ordinary shareholders. The profit figures given after these adjustments are called ‘fully diluted earnings’.
Liquidity ratios
Liquidity ratios show a company’s ability to pay its short-term debt and the amount that shareholders would receive should the company be liquidated. Three important liquidity ratios are the current ratio, the quick ratio and net tangible asset (NTA) backing. The formulas for these are shown in these equations.

Appropriate numbers for the liquidity ratios are crucial to the survival of a business, particularly during times of adversity. If short-term assets are less than short-term liabilities the company may be insolvent, and under corporations law operating while insolvent is an offence. Failure to pay down debts on time can also hurt a company’s credit ratings and future cost of funds, and even threaten its existence.
The current ratio is also known as the working capital ratio. It measures the excess of current assets over current liabilities and so, in turn, it measures short-term liquidity of the company and its ability to meet short-term debt obligations.
The general rule of thumb for a current ratio is 2 to 1 — that is, $2 of current assets for every $1 of current liabilities. Importantly, this general rule will not change, regardless of the strategy employed.
Each industry’s activity cycle, however, has a different length. The activity cycle is the time that elapses between money being paid out for the purchase of raw materials or goods and the revenue being received upon sale of the company’s products. Longer activity cycles suggest a company will take longer to be paid, and this must be supported by a higher current ratio.
There are plenty of hurdles prior to the revenue-generation stage and receipt of funds. Processing of raw materials, construction, drying, shipping, importing and exporting are all steps in the activity cycle for various industries. If interest is owed in the short term, cash flow must be carefully managed and a buffer of current assets — particularly cash and its equivalents — must be available to meet payments when they fall due.
The quick ratio, or acid test ratio, is similar to the current ratio described above; however, the quick ratio removes inventory and looks at what assets can contribute to cash in the next month or two to help meet liabilities due for payment during that period. With the quick ratio we can assess what the implications for short-term debt facilitation may be if a company suffers slowing inventory sales.
Another ratio that falls under the liquidity banner is interest cover. Interest cover describes how many times the interest expense can be covered by the profits (before interest and tax) of the business. Generally, a higher ratio is better; however, it could also indicate that the company could expand with the use of leverage.
Use of fundamental ratio analysis
Before we move on from the topic of ratio analysis, it is perhaps worth remembering that, as with all analysis, there are limitations to the effectiveness of ratio analysis. Some of the difficulties arise because there is simply too much data, the data is imperfect, or it may have already been factored in by other market participants, rendering it somewhat less than useful for a timely signal to act. Perhaps it will make matters clearer if we say that fundamentals may help to determine what, not when, to buy.
Having an understanding of fundamental ratios is essential to successful long-term investing. For example, there is a high correlation between changes in a company’s earnings over more than 10 years and that company’s share price. Understanding the ratios alone, however, is not sufficient for investment success. The successful share trader must be able to demonstrate a method of utilising the information provided by the ratios in a logical, consistent and disciplined manner.
The strategies we discuss in this book are all focused on finding long-term investment opportunities. As such, the strategies may be subject to the short-term volatility of the market. The strategies you develop may fall under several categories — growth, value, contrarian or momentum, or a hybrid of some description. Indeed, for the purposes of diversification it may make perfect sense to run several strategies simultaneously.
A strategy is simply a set of carefully researched and selected rules, established by the individual investor, regarding which ratios to use, how to combine them and when to use them. The rules, however, form only part of the strategy. The investor will also require rules that cover when to sell (if at all), how to weight the portfolio, how to re-weight the portfolio and when and how to add to the portfolio. Every contingency must be covered.
What should you do if one of the companies you purchased is the target of a takeover? Will you automatically accept the first bid? What will you do with the funds? What will you do with income received from dividends? Will you hold those dividends in cash until some future re-weighting date or will you automatically reinvest? All of these questions require an answer or your strategy can’t be described as ‘carefully planned’.
* * *
Few investors would make decisions to buy or sell without looking at the share price chart of a company’s performance. A common view is that fundamental analysis assists in the decision of what to buy or sell and technical analysis helps to decide when. Chapter 14 explains technical analysis and the most frequently used charts.