We don’t like volatility. Nobody likes volatility.
—Lionel Guerdoux Managing Partner,
Capricorn Venture Partners
Uncertainty is something organizations struggle to deal with. A few examples of devices organizations use to cope with uncertainty include pro formas, which are prepared for a variety of contingencies; forecasts that are created with confidence intervals to assess the magnitude of uncertainties; production planning, which often involves an attempt to predict the range of unpredictable possibilities that render the plan obsolete on a nearly daily basis; and order quantities that include safety stock.
Statistical process control (SPC) is defined by the American Society for Quality as “the application of statistical techniques to control a process.”1 Properly employed, SPC can be a significant factor in the control and minimization of variation and the resulting uncertainty in the manufacture of products and the delivery of services. It can greatly reduce the time it takes to recognize problems and provide useful information for the identification of root causes of those problems. The result often is better quality and lower costs.
SPC is also useful in demonstrating that a process is capable of consistently delivering what the customer wants. For this reason, some organizations require their suppliers to use SPC in order to become preferred suppliers. SPC also can provide conclusive evidence for the effectiveness of continuous process improvement programs (Figure 1.1).
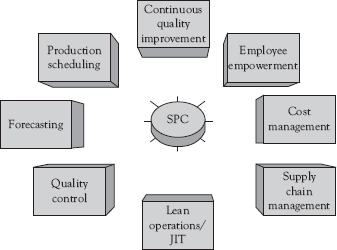
Figure 1.1 SPC adds value to business processes
From Chaos to Control
Often the first step in implementing SPC for a process is to construct a control chart for the process as it currently exists. Frequently, this base line control chart will show the process to be chaotic and unpredictable or, to use SPC terminology, out of control. While this might come as a surprise to management, it often is not surprising to those charged with running the process, scheduling the process, and evaluating the quality of the products and services resulting from the process. However, the real issue is that prior to constructing the chart, the state of control of the process was unknown. How can one possibly make forecasts, schedules, or predictions about quality based on the unknown?
The control charts used by SPC to assess the state of control of a process should be created when the process is performing as designed. The team responsible for implementing SPC should assure that the equipment is in good working order, is being operated by trained personnel, the settings are correct, and the raw materials meet specifications. The resulting control chart is an empirical statistical model of how the process can be expected to perform so long as it is operating as designed. The control chart reflects the expected level of variation for the process and we say that the process is operating in control. When other sources of variation occur, such as a defective lot of raw material, a machine malfunction, an incorrect setting, or a poorly trained operator, the control chart typically provides a signal indicating that the process is no longer performing as designed and we say the process is operating out of control.
SPC is designed to be used in real time. This means that samples (often referred to as subgroups) are taken from the process as the product is being produced, the samples are inspected, the data plotted on a control chart, and the state of control of the process assessed within as short a time span as possible. The same process is used when applying SPC to services. Samples should be taken as close to the time of delivery of services as possible. Timely sampling is necessary since a stable, predictable, in-control process can drift out of control. However, with real-time SPC, the length of time it takes to identify this condition and correct the problem can be minimized. So, with SPC, we work with predictable processes and monitor those processes in real time to ensure that they remain in control. In this way, SPC significantly minimizes the uncertainty associated with those processes.
SPC and Production Scheduling
During the sales and operations planning process, production plans are created to meet sales forecasts and other organizational objectives. Production schedules are created to meet the production plans and are often based on standards contained in manufacturing master files. While these standards are sometimes based on historical averages, they are most often based on engineering assessments of the effective capacity—that is, the sustainable production rate with allowances for personal time and maintenance2—for the process. Creating production schedules from standards based on effective capacity assumes the process is behaving as it was when the production rates were set. Production schedules based on historical averages assume the process is currently performing as it has done in the past. Both assumptions are simply acts of faith (and often vain hopes) when the state of control of the process is unknown. The only way to systematically monitor and assess whether these assumptions are valid is through the use of SPC.
A process proven to be in control through the use of SPC is predictable. A process shown to be out of control using SPC is unpredictable. A process running without SPC is an unknown quantity. So it should not be surprising that production schedules for processes whose state of control is unknown often are “not worth the paper they are printed on,” as one production supervisor put it. Without the predictability that SPC provides, there is more chaos and uncertainty, more stress, extra meetings, missed schedules, and additional overtime, which contribute to increased cost, reduced productivity, excessive built-in allowances for uncertainty, and impaired employee satisfaction. Additionally, employee confidence in management and those ultimately responsible for drafting unrealistic production schedules may be affected.
SPC will not assure that a process always operates in a state of control and thus be predictable. However, SPC is designed to be run in real time, which will be discussed in more detail later in this chapter. This ensures that out of control conditions are detected in a timely manner and current information is made available to troubleshooters who are assigned to find and correct the problems that SPC indicates are present. Timely detection coupled with effective and timely troubleshooting and problem correction can prevent the out of control condition from persisting for long periods of time.
SPC and Forecasts
Forecasts are essential to organizational planning and decision making and, the more accurate the forecasts, the more accurate the plans and decisions. Inaccurate forecasts of revenue and profit can result in significant loss of stock value for a corporation. Inaccurate production and labor forecasts can cause significant disruptions within operations. The inaccuracies in operations forecasts can ultimately contribute to inaccuracies in forecasts of revenues and profits. If we fail to produce what we forecast, revenues will suffer. If we fail to produce at the cost we forecast, profits will suffer.
Forecasts based on time series analysis of past data assume that the causal system that created variation in the value of what is being forecast will continue to do so in the same way in the future. While SPC cannot affect the external influences that can alter the causal system (e.g., changes in consumer taste, availability of new technologies), it can increase the accuracy of forecasts by decreasing the variation in processes upon which the forecasts are based. When the causal system underlying a forecast is comprised of processes that are out of control, forecast accuracy is greatly diminished. Indeed, a term used to describe such forecasts is not worth the paper they are written on. How can a forecast based on unpredictable processes be anything but inaccurate?
Example 1.1
Why are We Always Missing Deadlines?
Once again the question arises in the staff meeting: Why are we late on so many shipments? The forecast called for the production of 100 products per hour by the process. Production records indicate this forecast was met. Yet, the product is not ready to ship. Investigation shows that much of the product produced is either awaiting inspection or has been rejected and is awaiting rework.
One problem is that the forecast was based on standard production rates, which assume and account for some standard defect rate. However, since the process is in an unknown state of control, there is considerable variation in defect rates, resulting in considerable variation in the rate of production of acceptable product ready to ship. In this case, considerably more defective product was produced than the forecast allowed for.
Late deliveries can be a source of customer dissatisfaction as well as hurting the profit and loss (P&L). Often the answer is that the product was produced on time according to the schedule based on the forecast. But instead of being in the finished goods warehouse ready to ship, some or all of the products are awaiting inspection by quality control (QC) or have been rejected and are awaiting rework. Worse yet, the process may be shut down while engineering and maintenance technicians try to determine why so many defective products have been produced. No wonder the production forecast wasn’t worth the paper it was written on, and the actual P&L is worse than the pro forma.3
Process instability and poor capability of the process to consistently produce products that meet specifications can result in considerable variation in product quality. Variations in the lag time between production and inspection can make troubleshooting process problems more difficult. Implementation of SPC brings processes into control and can provide reliable estimates about the state of the processes. The result will be more reliable standard production rates that can support more accurate production forecasts. When combined with continuous improvement activities, SPC can help minimize process variation and increase the capability of the process to meet specifications resulting in an increased ability to meet forecasts and shipment commitments. More importantly, customers will be happier and the P&L will look more like the pro forma.
When SPC is used to bring the causal system processes into control, forecast accuracy will typically increase as well. Because common cause variation is still present in an in-control process, it is impossible to provide perfect input to forecasting models. Perfection, while desirable as a goal, can never be achieved in a forecasting model. However, perfection in a forecast is seldom necessary to achieve the objectives of the forecast. Most would agree that an accurate but imperfect forecast provides a much better basis for decision making than one not worth the paper it is printed on.
SPC and Quality Control
The output of processes must be assessed for quality in some way. Typical end-of-line inspection processes where the output is collected into lots and assessed using some form of acceptance sampling suffer from several flaws. The first flaw is the delay between the time a product was produced until the time the inspection occurs. I have observed cases where the lag period between production and inspection was measured in days. So, if a problem is detected in a lot, the process that produced the lot may have run in much the same way producing defective products throughout the entire lag period. This can result in a considerable quantity of potentially defective material, which must be subjected to more extensive inspection, possible rework, downgrade, or scrap. I have observed plants where a great deal of space is occupied by pallets of material awaiting inspection. Frequently, these plants have large rework departments to sort through rejected lots of material and correct defects where possible. This excess inventory and non–value-adding operations are the result of uncontrolled processes and significant lag time between production and inspection.
A second flaw is that acceptance sampling plans simply provide a lot disposition (accept or reject) and, unlike SPC, cannot provide evidence about the state of control of the process that produced the lot. SPC, unlike acceptance sampling, controls the quality of the output by providing information to allow control of the process. SPC provides the means to develop capable and in-control processes that produce product that is more uniform and predictable in quality.
SPC and Lean Operations or Just-in-Time
ASQ defines lean as “producing the maximum sellable products or services at the lowest operational cost while optimizing inventory levels” and just-in-time (JIT) as “an optimal material requirement planning system for a manufacturing process in which there is little or no manufacturing material inventory on hand at the manufacturing site and little or no incoming inspection.”4 These definitions make it clear that variation can be the enemy of both lean and JIT.5 In the words of quality expert W. Edwards Deming, JIT “is sheer nonsense unless the process is stable. Unless it is stable (in statistical control), nobody knows who is going to need what or when he will need it.”6
Excess inventory leads to increased cost. In order to understand the effect of SPC on lean and JIT, we must understand some of the reasons why inventories are required.
Buffer stocks are needed to provide a decoupling between processes so that variation in one process does not adversely affect the succeeding processes. Decreasing variation in the processes through the use of SPC decreases the need for buffer stocks.
Safety stocks are needed, in part, to protect against forecast errors and variation in demand for parts by internal processes. We have previously discussed the improvement in forecast accuracy as a result of using SPC. However, if we use an accurate demand forecast to set procurement quantities, we must consider what variation exists in demand for the parts by the internal processes. If the standard scrap rate for a part is 2 percent, but the variation in this scrap rate is highly variable due to out of control processes, procurement of the forecast amount plus 2 percent will often lead to stock-outs. To prevent this, excess safety stock is maintained and excess inventory in a lean production system is considered to be a waste. Using SPC to bring processes into control can reduce the need for these excess safety stocks.
SPC and Supply Chain Management
Safety stock is also used to provide protection against late delivery and receipt of defective materials from suppliers. In a supply chain, there are usually multiple upstream members in series for each purchased product. Variation in your direct supplier’s processes creates variation in lead time, on-time delivery, and quality. Variation in each upstream supplier’s processes has the same effect on their direct downstream customer. By the time the product gets to your organization, it has been subjected to multiple layers of variation creating the need for excessive safety stock. Extra safety stock means extra cost.
When each member of the supply chain uses SPC to monitor and control processes, the total variation observed from end to end in the supply chain is diminished, overall costs are reduced, quality is less variable, and deliveries are more likely to arrive on time. Frequently, incoming inspection can be significantly reduced when suppliers submit evidence that their processes are in control and capable. All of these benefits of SPC can increase customer satisfaction both for internal customers to the supply chain and to the ultimate customer. Because of this, a number of top manufacturing companies have mandated that their preferred suppliers implement and use SPC. This mandate should only be imposed after your company has implemented SPC for its own processes and is in a position to provide technical expertise and advice to suppliers as they work to comply with the mandate.
SPC and Costs
Implementing and operating a SPC program are not free. Resources must be invested in training, software acquisition, and projects to implement SPC, and processes whose base line control chart shows they are not in control must be brought into a state of control. This involves examining the entire process and correcting any problems that are found. Often parts that are worn, but have not yet catastrophically failed, must be replaced. Sometimes obsolete control systems must be updated. Greater consistency between lots of raw material might be needed necessitating negotiating with the current suppliers or developing new suppliers. Designed experiments may be required to optimize process settings. Additional operator training may be required. All of these activities require resources.
Example 1.2
Total Molded Products 1
An injection molding facility was just beginning implementation of SPC in their processes. They had identified part weight as the key quality indicator to measure. Their initial, base line evaluation of the process found that part weight varied significantly over time. Thorough examination of the process identified several areas for improvement, but the one that most affected part weight was the mechanical component that controlled the amount of plastic that was injected into the mold. The current component was a limit switch, and it was found to shift due to a variety of factors including loose or stripped set screw, vibration, accidental bumping, and the presence of foreign matter.
In order to reduce this source of variation, the process engineers determined that the limit switches should be replaced with linear potentiometers. This upgrade was not included in the budget, so the engineers had to make the case to management to allocate funds for the upgrade. The initial control charts helped the engineers prove their case. Once the upgrade was complete, the engineers used control charts to help document a substantial return on investment (ROI) for the expenditure due to cost savings associated with significant reduction in part weight variation and fewer rejected parts from the improved and now in-control process.
These and other issues must be addressed to bring the process into a state of control and all require resources and equipment downtime. However, these costs should be considered to be investments. Done properly as a part of the SPC implementation project, there will be a positive return on investment (ROI) derived from the reduction in variation in the process, fewer unplanned disruptions, less rework, and more consistent production output.
Near-Real-Time System
Several years ago I was assisting a client evaluate potential suppliers for aluminum extrusions. Using publically available information I was able to narrow the list of possible suppliers to three. I contacted each supplier and requested that they send me a copy of their quality manuals. The best candidate stated that they used SPC to control their processes and took necessary corrective action to investigate out of control conditions.
While on a site visit to the candidate’s facility I asked the quality manager about the company’s use of SPC. He took me to an operator station on one of the extrusion lines where I observed the operator periodically taking samples from the process, making measurements, and recording the measurements on a sheet of paper, which listed the specifications for the part being manufactured at the time. Upon further questioning, the quality manager said that once a week or so he gathered all of the data from the operators’ stations and plotted it on control charts. He offered to show me the charts in his office. I asked what use the company made of the charts. The quality manager said that copies were sent to customers who asked for them. Otherwise he kept them in a file in his office for several months before discarding them.
I did not recommend this company to my client because they were not really using SPC. They were plotting outdated data on control charts to satisfy specific customers. The charts played no role in monitoring and controlling the processes.
When operators or technicians take samples, make measurements in a timely fashion, and then plot them on a control chart manually or via computer, they have the information necessary to make a near-real time decision about the state of control of the process. When the chart shows that the process is in control, they know that no adjustment is necessary. When the chart shows that the process is out of control, they can take timely action to ascertain the nature of the problem and take the appropriate corrective action. When the data are not plotted in a timely fashion, long periods can elapse with the process running out of control. When this condition is recognized days or weeks after the assignable cause occurred, it is more difficult to trouble shoot the problem.
SPC and CQI Work Together
The successful implementation of SPC represents a significant improvement to quality and operations. Once implemented, SPC can be of significant value in identifying opportunities for continued improvement as well as providing a measure of the effectiveness of the continuous improvement projects. As the following example shows, it can also document the ineffectiveness of continuous quality improvement (CQI) programs.
Example 1.3
A Tale of Two Hospitals
Hospital A uses SPC to monitor and control patient satisfaction with meal service. While the control chart showed the process to be in control and predictable, the average level of dissatisfaction with meals was considered to be excessive and represented an opportunity for improvement. After collecting information from patients, dieticians, and nursing staff, the hospital instituted a program designed to improve patient satisfaction with meals. The control chart clearly indicated a significant reduction in the proportion of patients not delighted with their meals beginning at the period in which the improved process was launched. The chart documented more than a 30 percent reduction (from more than 10 percent to about 7 percent) in the proportion of patients not delighted with their meals. This is a case of an out of control signal on a control chart being a good thing because it confirms that the process was improved as the result of planned action. And not only does the chart clearly document the effectiveness of the improvement, but it provides a means of monitoring the process to assure that the gain is sustained.
Hospital B boasts that it has practiced CQI for a number of years. They also use SPC to monitor and control a number of processes in the hospital. However, the control chart used in the hospital to monitor overall patient satisfaction with the hospital shows that over the entire three-year time period covered by the control chart, the process has been stable. The hospital had initiated several quality improvement projects designed to improve patient satisfaction—the parameter plotted on the control chart. In this case, the control chart provides evidence that none of the improvements were effective. In the presence of a CQI program designed to improve a process, a stable control chart is an indicator that something is wrong with the CQI program.
The control chart for Hospital A is included in Figure 8.2.
Control and Minimization of Variation
SPC is designed to control and minimize variation in processes. As previously discussed, unpredictable processes can increase the need for inventory, increase variation in quality, reduce forecast accuracy, and increase costs. However, there are other reasons to be concerned about the control and minimization of process variation. The most important of these is that process variation creates variation in the quality of the product produced by the process. The more variation in the process, the more variation in the quality of the product.
Even when process variation does not result in the production of a significant amount of product that is out of specification, the part-to-part and lot-to-lot variation within the specification can be troublesome to customers. Genichi Taguchi famously developed what is called the Taguchi loss function,7 which quantifies the losses incurred by producing products that are not exactly at the specification target value. He showed that often unidentified losses are incurred when products are within specification but not exactly on target. The way to produce more products on target is to utilize SPC to appropriately center the process on the target value, reduce process variation, and monitor and control the process to keep it operating as designed.
Example 1.4
Total Molded Products 2
An injection molding facility began implementation of SPC in their processes. One process produced plastic panels for electronics enclosures. The engineers determined that part weight was a good proxy for the overall quality of the molded part. They began with a pilot study that showed the process to be out of control and yielded the following statistics:8
Mean part weight |
43.86 |
Standard deviation |
3.06 |
After completing the process of implementing SPC, the process was in control and yielded the following statistics:
Mean part weight |
43.69 |
Standard deviation |
1.21 |
The plant found that the production efficiency for this process increased as a result of the production of fewer defective parts and decreased downtime to troubleshoot problems.
The plant’s customer for this product was delighted with the reduction in the standard deviation, which documented a substantial reduction in variation in the part. The customer employed an automated assembly process and the reduction in panel variation resulted in fewer jams of its assembly equipment and better fit and finish of the finished product.
SPC and Employee Empowerment
An unexpected benefit to a properly implemented SPC program is improved employee attitudes. SPC can be considered as a participative approach to QC when employees are trained to collect the samples, make the measurements, enter, or plot the data, assess the state of control of the process, and take appropriate action when they detect an out of control signal. Employees are empowered by SPC and experience a greater degree of control over their work environment.
One study9 found some support for employees’ greater feeling of control over quality and an improved attitude toward management. During implementation at the study facility, employees received training in SPC including sampling and measurement procedures, control charting, problem identification, problem solving, and they assisted in the development of standard operating procedures (SOP) for actions to take when out of control signals were detected. Employees also participated with management in developing SOPs for setting up and operating the process in order to reduce process variation caused by operator-to-operator differences. After SPC implementation, management emphasized the importance of operating the process according to the jointly developed SOPs. With SPC implemented in this way, it is not at all surprising that employees feel more empowered and have an improved attitude toward management.
Other studies have reported mixed results, but this is probably due to the method of implementation of SPC. An SPC program that is implemented with little production employee involvement is unlikely to have any effect on employee attitudes. However, one study10 did find a number of effects associated with successful SPC implementations including increased number of production employees inspecting their own work, reduced production employee absenteeism, increased production employee efficiency, increased teamwork among employees, and increased employee participation in decision making.
Success in SPC implementations requires more than just technical skill. It requires an understanding of the change management process because you simply cannot superimpose SPC on top of the existing “way we do things.” SPC requires that changes be made and the natural instinct of humans is to resist change.11 How well change is managed can be the most critical factor in the success or failure of an SPC implementation.
• SPC is not just a statistical tool. Its use can help organizations move from chaos to control. SPC can also be a solid partner with other organizational management approaches.
• SPC can increase the accuracy of production schedules and production forecasts.
• SPC is a powerful tool to help decrease process variation, product quality variation, and thereby improve overall quality.
• SPC is an essential partner to lean and JIT.
• Integrated throughout, SPC can dramatically reduce variation in lead time, on-time delivery, and product quality in supply chains.
• SPC can help identify targets for improvement and document the effectiveness of CQI programs.
• When used on-line and in real-time, SPC provides an opportunity to empower employees and give them more control over the quality of their work. Empowerment has been shown to improve employee attitude toward management.
Questions You Should be Asking About Your Work Environment
• What activities in your organization would benefit most from decreased uncertainty that SPC can provide?
• Can SPC help jump start existing quality and efficiency improvement programs in your organization?
• Would your supply chain benefit from a reduction in variation?
• Could SPC increase your organization’s ability to document the effectiveness of improvement projects?