About This Chapter
In this chapter, we address the question raised in Chapter 1: “What did it cost?” As observed in the previous chapter, “cost” is a slippery term. You will find that the more precisely you identify the cost you are interested in, the more useful will be the information for analysis. You may be seeking the cost of materials used in the production for a certain period of time, the cost of conducting a laser surgery operation, the cost of making a part of a product compared to buying in, or the cost of being the defense team in a major fraud trial.
This range of activities leads us to the question of what is being “costed.” In other words, you want to know the cost of conducting the laser operation or the cost of making one can of paint. These are very different activities, and we therefore need some system of classifying “costs” into useful categories. We also need to recognize that these very different activities will require different methods to assemble our costs. In this chapter, we commence by considering different methods of classifying costs, based on both the nature of the cost and the way it accumulates.
The largest part of this chapter explains how you calculate the total cost of a particular product or activity. There are two primary methods for calculating the total cost of a product or service: full costing and activity-based costing (ABC). How each of these two methods is applied will depend on whether you are working for an organization that has a specific order of operations or one that has continuous operations. The importance of the difference in these operations is discussed later.
You will appreciate that this chapter explains concepts and methods individually. In a large organization, there may be both production and service activities of varying natures. Not only is an array of costing methods and techniques used, but also the classification of costs is determined by the nature of those specific activities.
The Nature of Costs
Cost Classification
Classifications are used in all walks of life. For example, you can take a group of people and classify them by gender, age, and weight. Depending on your purposes, you may then want to draw up subclassifications such as a subgroup of males over the age of 50 years and weighing less than 85 kg.
The same principles are used when we are classifying “cost.” The classification we use will be determined by the reason for requiring the information. For example, a purchasing manager may be interested in the cost of raw materials; a sales manager in the costs of running the sales department; the production manager in the total cost in one unit of production; and the security manager in the hourly cost of offering 24-hour security. In Table 2.1, we illustrate the basic types of cost classification, a brief explanation of that classification, and in the third column some examples.
You will note that these broad classifications can be merged to provide a more useful description of the type of cost. For example, raw materials can usually be identified with a cost object, which means that they are direct costs, and as such, they are variable. In other words, the more cost units you make, the greater in total, will be the cost of raw materials.
In this chapter, we conduct a thorough examination of direct and indirect costs. This enables us to explain how we can calculate the total cost of a particular service or product. Note that costs can also be classified as either controllable or uncontrollable depending on whether the manager has discretion to control the costs. For example, if an organization has the authority to hire part-time or temporary staff when needed, then these wages are controllable costs. For budgetary planning and control purposes, standard costs are compared with actual costs in order to calculate variances. Budgets and variance analysis are discussed in Chapter 4. Not only do managers find that the classification of fixed and variable costs are extremely useful in decision making, but they also need to understand the concept of opportunity costs and sunk costs. These are explored further under relevant costing or incremental analysis in Chapter 5.
Table 2.1 Cost classification

Although cost classifications are often explained in a manufacturing context, this is only for simplicity. Managers in all types of organizations, including financial services, “need to be cognizant of the myriad of definitions that surround the word cost.”1
Direct Costs
In a manufacturing organization, materials that can be identified directly with the product are likely to be significant. The increasing use of mechanization and robotics has, in some industries, reduced the amount of direct labor required. But be cautious: in some industries, where skilled labor is an essential part of the manufacturing process, the cost can be high. Generally, in service industries direct labor will be high and material low or even insignificant. An accounting firm doing a major audit will have high direct labor costs but practically zero direct material costs. Direct material costs will normally have the following characteristics:
•Detectable. This will often mean that they are visible, although with some direct materials, such as gases, this may not be the case and special equipment may be needed to detect them.
•Measurable. This can be by weight, volume, time, or another appropriate method.
•Relatively valuable. Some costs are of small value, and it is not useful to maintain records to calculate the costs to a specific cost object. For example, in manufacturing, the costs of such items as glues, thread, and screws are so minor that ordinary physical controls are sufficient, such as allowing a certain quantity for a specific level of production.
•Traceable. A system must be in operation to be able to record the quantity of materials for the specific product or service.
Calculating the cost of direct materials to specific cost objects can cause difficulties. These fall under two headings: the practical and the price. On a practical basis, good records and work procedures are essential to ensure that materials are correctly received from the suppliers, stored in safe and secure conditions, and only issued when required by production. This usually safeguards the processing of the correct quantity of materials, but the problem of pricing, or determining the costs, remains.
The delivery of materials may take place over a period of time, and this does not necessarily synchronize with the quantities being issued to production. Prices will therefore vary over that period of time due to
•inflation or deflation giving rise to price changes
•variations in exchange rates if materials are purchased overseas
•shortages in the supply of materials, leading to price increases
•temporary reductions due to special offers, discounts, and so on
There are several methods used for determining the price of the materials issued to production. Of course, the method chosen for issues to production also affects the value of the closing inventory. This amount will be shown on the financial statements, and financial accounting standards determine which methods are acceptable. Most companies will select a method that meets the requirements of the financial accounting standard and also establishes a cost that is useful for management. Whatever method is used, the overriding requirement is that inventory should be valued at less than the cost and the net realizable value (i.e., the amount it could be sold for less than the cost of selling).
The cost of direct labor is usually based on the remuneration system used in the company. It is essential that a sound record system is in place to charge the correct cost of labor to the appropriate activity. For example, in a manufacturing organization, piecework tickets or swipe cards may be used to record the times of different types of labor at various stages of the production process on a job. Time sheets are widely used in manufacturing and service industries. For example, employees in accounting or law firms will record their billable hours for each client’s job.
Indirect Costs (Overheads)
In addition to those direct costs that can be identified with the production or service activity, there are also indirect costs, which in many organizations can be higher than the direct costs. Usually these overheads can be grouped under the following headings:
•Administration overheads
•Selling overheads
Depending on the nature of the organization’s activities, there may also be distribution overheads and research and development overheads. In some organizations, the distribution cost of a particular product can be significant and identified directly with the job. Research costs are usually regarded as overheads but for a large project may be considered direct.
In a service organization, the overheads can be substantial. If you stay in a hotel, the costs of cleaning your room and the complimentary breakfast are insignificant. It is the property tax for the hotel site, the depreciation charge on fixtures, furniture and equipment, lighting and heating, and the hotel staff you see, such as the staff at the front desk. These are the costs of running the hotel.
If we wish to know the total cost of a cost object, we need to ascertain the following:
•Direct material costs
•Direct labor costs
•Overhead costs
Whether we are establishing the costs of building a bridge, manufacturing and installing a computerized system, conducting a surgical operation, or defending a client on a murder charge, there will be records of the direct costs incurred if the amount involved is worth recording.
The critical issue is how we share the total overheads for the organization over the various activities and the cost objects generated within one financial period. You want to know how much it costs for you to run your department, repair a car for a client, transport 100 m of steel over 50 km, or set up an emergency hospital in a disaster area. In some instances, the indirect costs may not be of overwhelming importance, but usually they are.
There are two main methods for ascertaining total cost: traditional (full) costing and ABC. Both try to resolve the same problem of sharing overheads over cost objects and activities. Before discussing these two methods, we will look at some of the stages involved in allocating costs and explain the technical terms.
Cost Pools and Cost Allocation
An activity cost pool is a set of costs which are incurred when certain operations are performed within the organization. Sometimes the term cost center is used. By accounting for all the costs incurred in a specific activity within a pool, it is simpler to assign those costs to products and get an accurate estimate of production costs. Activity cost pool is an aggregate of all the costs required to perform a task such as production.
The best example of where activity costs are tracked and studied is in manufacturing. Given a plant which produces many different products, financial managers are tasked with the problem of how to accurately assign production costs to each product.
Cost allocation involves identifying the costs of different cost objects. A cost object is an item for which a business wishes to separately estimate cost. This could be a special project, a department, a branch, a customer, and so on. It involves identifying the cost object, and assigning all the costs caused by that cost object to it. Cost allocation is important because it is the process through which costs incurred in producing a certain product or providing a service is calculated.
If a company is using strategic cost analysis, costs must be accurately calculated and allocated. If the cost of a product or service is not correctly allocated, it may be offering products or services at a price that is too high and therefore not marketable or too low and a loss is being made.
Cost pools are an excellent method for collecting costs for a particular activity that the manager responsible can use for decision making. There is a downside to this. Mastilak2 has argued that the cost pool classification choices not only determine the information managers receive, but can also adversely affect their interpretation and use of that information. In other words, the manager has only a partial picture and there may be significant data gathered in other cost pools that the manager does not receive but may be important for decision making.
A cost driver is any variable that affects a cost. If increase or decrease in a variable causes an increase or decrease in a cost, that variable is a cost driver for that cost. For example, the number of purchase orders made could be a cost driver for the cost of the purchasing department. The more orders are made, the higher the costs of the purchase department.
Ascertaining the Total Cost
Full Costing or Absorption Costing
We start this section by stating what we do not mean by full costing. In the last few decades, there have been attempts to calculate the full costs of an organization’s activities by including social, environmental, and economic costs. The traditional accounting approach is therefore expanded to include costs that make up what is referred to as the triple bottom line, a term introduced by John Elkington.3
In our explanations, we restrict the use of the term “full costing,” also known as absorption costing or traditional costing, as a cost accounting method designed to identify the material, labor, and overhead costs incurred to provide a product or service. The method was developed in the manufacturing sector and reflects the priorities of production facilities, although the technique is widely used in other sectors. The purpose of the technique is to find the total cost, including overheads, of the cost object.
Full costing seeks to provide answers to two practical problems:
•How to share the total overheads of the organization over the various production cost centers.
•How to share the overheads for a particular production cost center over the various products passing through it.
Some overheads can be identified directly with a cost center because the activities of that center necessarily incurred the cost, such as the insurance on some highly specialized equipment used only in one department. The second group of overheads cannot be identified with a single cost center, but must be shared over all the cost centers benefiting from them. For example, the costs of cleaning, lighting, heating, insurance, and property tax for an organization need to be charged in some way to each production department. The second step is to charge a share of that department’s overhead to each cost object passing through it.
The stages of sharing organizational overheads are summarized as follows:
•Charge those overheads to the department that causes them.
•Share the remaining overheads over the departments by preparing an overhead analysis statement.
•Charge a share of the departmental overhead to each cost object passing through it to give the total production cost of each cost object.
In this chapter, we give an example of using allocation costing both for a company that does work for specific customers and for an organization where there is continuous output. At this point, we give a simple example to demonstrate the stages of sharing organizational overheads. Remember that we are only concerned with indirect costs and not direct materials and direct labor.
Example of Overhead Analysis Statement and Allocation Rate
In this example, we assume that there are just two production departments in the factory, and the production goes first to Department 1 and is completed in Department 2. Table 2.2 shows the characteristics of the company.
Table 2.3 shows the amount of overhead that has been budgeted for the financial period, and how it has been allocated over the two departments. From this very simple example, you can see that of the total overhead of $110,000, Department 1 is allocated with $85,000 and Department 2 is allocated with $25,000. We allocated the rent of the factory on the basis of the area occupied by each department. The salary of the supervisors is more controversial.
Table 2.2 Company characteristics
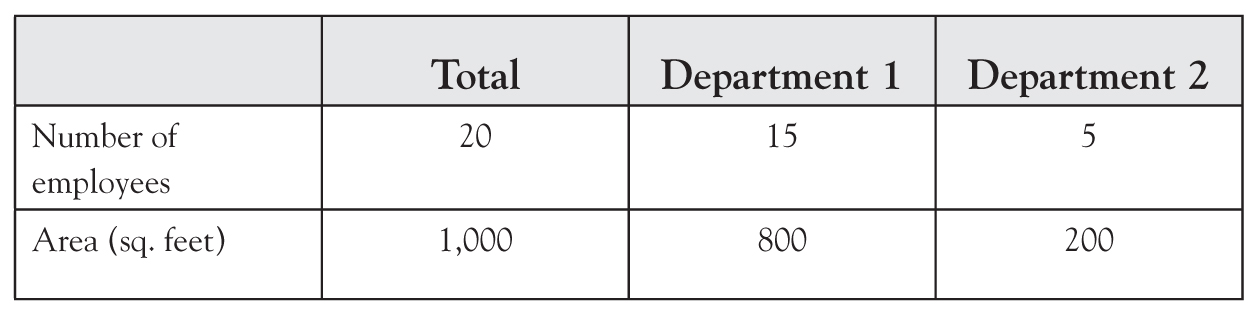
Table 2.3 Overhead analysis
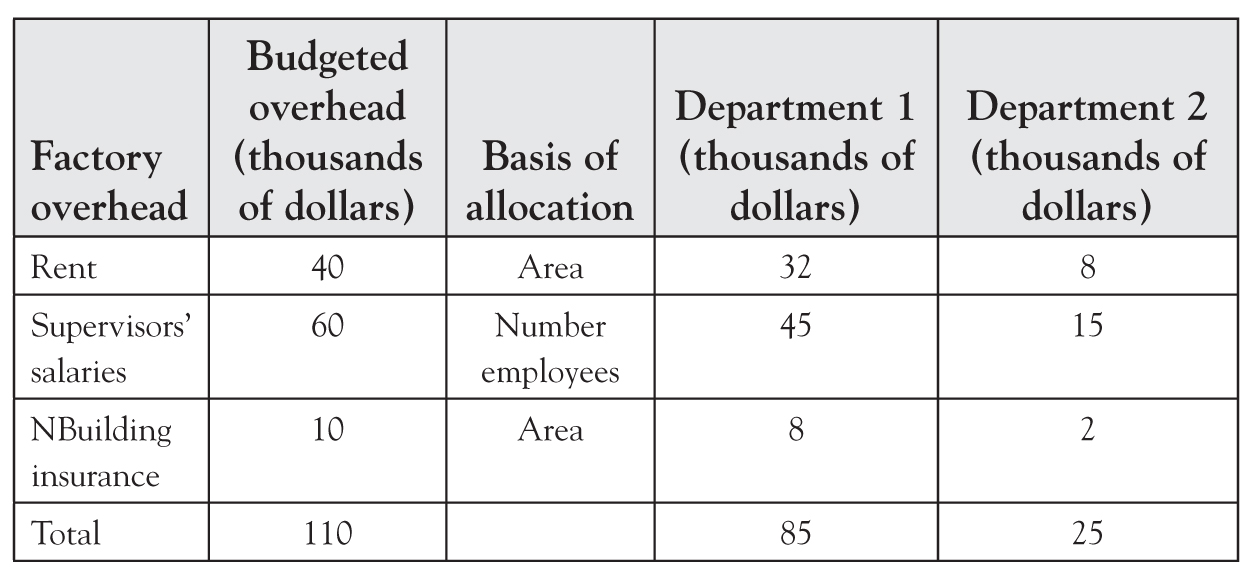
We used the number of employees on the basis that it is related to the amount of supervision required. This may not be the case, and the employees in Department 2 may be working as a team with little supervision. However, in the absence of any more information, the basis we used seems reasonable with the data available.
One way you can interpret the departmental overhead is to regard it as the cost of the resources required for that department to carry out its part of the production process. In other words, we calculated the cost of running a department regardless of the level of activity.
We shared the overheads on a basis that is normally used in practice, but we are certain you will agree that it is very arbitrary. In defense of this approach, we argue that it is cost efficient and sensible to use a basis in which we already have the information available without incurring further costs to obtain additional cost data. It could be argued that the approach is reasonable and, by and large, will reflect the departments’ uses of the resources.
The overheads for the entire factory have now been “shared,” but now we need to charge an appropriate amount to the cost object. We should already have a record of the direct materials and labor required to make the product, and by now adding the share of the overheads, we will know the total production cost of the cost object. Other overheads such as selling, distribution, and administration will be discussed later.
There are several ways in which we can allocate the relevant portion of the overhead to the cost object. The choice of the allocation rate depends on the nature of the product and the resources we consider are being used. There are three methods you are most likely to find in practice.
The Cost Object
If all the units we produce are homogeneous, such as cans of paint, then we can merely divide the department overheads by the number of units going through that department to give us an average overhead cost per unit. This is added to the direct material and direct labor cost to give the total cost per unit. You will find a worked example of this when we discuss process costing towards the end of this chapter.
Labor Hour Rate
If you consider that the costs of running the department are largely incurred to provide labor to work on the cost objects, then you can use labor hours. In the previous example, the overhead costs for Department 1 were $85,000. If management has determined that 10,000 hours of work is carried out in that time, the overhead labor rate is $85,000/10,000 = $8.50 per labor hour. If a cost object required 3 labor hours, then the share of overheads for the object is $8.5 × 3 = $25.50. Note that this is not the direct labor cost but the share of overheads cost and is added to the direct costs to give the total production cost.
Machine Hour Rate
You may work in an organization where the production process is highly mechanized in particular departments. If that is the case, then you would charge the overheads to the cost object on the basis of the machine hours incurred. For example, the overhead for Department 2 is $25,000 for a set period of time. Management may have determined that this will provide a capacity of 12,500 machine hours. The machine hour rate is $25,000/12,500 = $2.00 per machine hour. If a job were to take 100 machine hours to complete, then the cost of the overhead would be 100 × $2.00 = $200.
There are other methods for allocating overheads, such as a percentage of the labor cost or the material cost. These have the advantage of the information already being available but are prone to fluctuations due to changes in labor rates and material prices.
There are three key facts you need to remember:
•Allocation rates are calculated for each department, and different departments can have a different method of allocation.
•The overhead charge is added to the direct costs to obtain the total production cost.
•A cost object will be charged overheads for every department that it passes through.
Service Centers
So far, we have considered only production cost centers. However, most businesses also have cost centers based in the factory that provide services to other cost centers. Examples of service cost centers include departments associated with the production areas, such as maintenance and quality control. We will leave consideration of cost centers such as administration and marketing until later in the chapter.
In a small organization where the services provided are not substantial, the costs may be allocated directly to the production cost centers. In a larger organization, the Overhead Analysis Statement will have columns for the service cost centers, and a share of the factory overheads will be allocated to them. The columns are subtotaled, and the subtotal of the service cost centers are allocated to the production cost centers on a fair but arbitrary basis. A useful article by Meeting and Harvey4 discusses the various approaches that could be used by health care providers in the United States.
Activity-Based Costing
You will have concluded, most likely, from our explanations in the first section that full costing involves considerable arbitrary decision making, and in some circumstances, the nature of the organization’s activities and the data available would make it difficult to apply. Observing these problems, academics and consultants commenced investigating alternative methods.
The first explanation of ABC as a valid alternative to full costing appeared in 19875. The authors demonstrated the value of the technique in the manufacturing sector where the proportion of the direct costs was falling, and the indirect costs were increasing in importance. Since that date, the use of the technique has spread with adherents in both the manufacturing and service sectors.
It is impossible to assess the extent of usage of ABC by companies. Dugdale and Jones6 conducted a small telephone survey and concluded that evidence from a prior questionnaire study overestimated the extent of usage. This was because the responses to the questionnaire were either mistaken, exaggerated, or ambiguous.
In a late study, White, Anistal, and Anistal7 referred to the ABC Paradox. Although they found that the adoption of ABC is promising in developing nations and in some American and European business sectors, there is a gap between the claims made on behalf of the method and the actual rate of adoption.
One potential answer to the issue of identifying the rate of adoption of ABC is that companies devise, structure, and implement any costing system to meet their own strategic needs. In the following paragraphs, we explain the essence of ABC. In practice, you may find many variations and adoptions of the technique.
In studying ABC, you should bear in mind that the treatment of direct costs is exactly the same as full costing. It is the way that we treat the overheads. With both methods, we are using predetermined overheads. These will be the budgeted total costs for rent, insurance, electricity, power, and other indirect costs.
The purpose of ABC is to ascertain the total cost of a product, service, or activity, but the approach it adopts differs from full costing. Instead of being based on functional departments or responsibility centers, ABC uses the concept of “cost pools.” We explained these terms earlier in the chapter and we repeat these terms to demonstrate their application. Instead of allocation rates to charge overheads to the products, cost drivers are identified. Let us look at these two main stages separately.
The main activities in the organization are classified into activity centers or cost pools. These need not be based on an existing functional department. For example, a hospital spends a significant amount of money on medical supplies. As part of this process, orders have to be placed, and this activity consumes resources.
Cost Drivers
Cost drivers must be identified with each activity cost pool. Using our hospital example, it could be the number of orders placed for medical supplies. For a medical emergency service, it could be the number of patients admitted. Table 2.4 gives examples of cost pools and drivers.
A cost-driver rate is then calculated by dividing the costs of the particular cost pool by the unit of activity. In our hospital example, it would be the number of orders placed, or the number of patients admitted in an accident and emergency ward.
The final stage is assigning the costs of the cost pool to the product or service being provided. If the cost-driver rate for orders for medical supplies is calculated at $10 per order, and in a financial period 500 orders are placed for supplies for heart patients, the total cost is $5,000.
ABC is a more sophisticated system than full costing and, it is claimed, should provide information about costs that is more comprehensive, reliable, and useful than that provided by full costing. The method incorporates all relevant overheads and generates information that enables managers to make better decisions about the management of those activities and the possibilities of cost reduction.
You may be wondering why every business has not changed to ABC, if it is such a good system. One of the main reasons is the question of cost and the problems associated with organizational change. There is little inducement to undertake the substantial changes required to introduce a new system if the business already produces product costing information that meets their needs. Even if the business is not entirely satisfied with its present system, the cost of implementing and managing a new system may seem too burdensome to make it worthwhile.
Table 2.4 Examples of cost pools and drivers

ABC is probably best suited for organizations where traditional full costing will not provide the information required. This can be due to the complex structure of the organization and the nature of the activities conducted. The method seems to have been particularly beneficial in the service industries and has been implemented by financial institutions and hospitals. There is also some evidence that it is a better method than full costing in the hospitality sector.8
The emphasis in ABC on activities has generated an interest in investigating the efficiency in the use of the available capacity. Organizations have committed resources and need to assess the costs and management issues of unused capacity. Capacity cost can be defined as a fixed cost that is essential for the continuing activities of an organization. These costs tend not to vary from month to month, and if capacity is not used fully, there may be opportunities for management to reduce these resources and thus decrease the amount of overhead.
As with full costing, there are weaknesses in ABC not always understood by the nonfinancial manager. This may be particularly evident in ABC where a large component of the cost may be fixed although there are changing activity levels. ABC, like full costing, relies on the accuracy of the predictions concerning the amount of the overhead and the level of the activity. For example, if an organization calculates that the overhead is $10,000 for a financial period with 1,000 cost drivers, the application rate will be $10 per driver. However, if the actual activity level falls to 700 cost drivers, the actual cost will be $14.30, which is a significant difference in the cost.
A further issue is the nature of the cost drivers. These are usually “transactional” cost drivers where the number of times an activity has been carried out is important, such as the number of machine setups or the number of purchase orders raised. This assumes that the activities are homogeneous: All machine setups take the same time to carry out. Further analysis may show that there are differences in the time taken for setups, and we may improve our cost information if that is built into our model.
Table 2.5 Comparison of full costing and ABC

As ABC becomes more widely practiced, we can expect to see further modifications and refinements. This may also relate back to full costing and different methods of allocating overheads. However, the essence of the two approaches is shown in Table 2.5. With ABC and other techniques, the claims by companies that they use them may not be completely accurate. Companies adopt costing techniques to meet their own information needs and the nature of their activities. The result may be a system that does not match the description found in text books. Evidence that ABC is refined to meet particular needs can be found in articles that detail its use in different industries such as a reinforcing steel bar manufacturer9 and a farm in Australia.10
These discussions on the use or non-use of ABC and its application in companies support the statement we made in Chapter 1. Financial accounting is strongly regulated and companies follow these regulations. Cost accounting is not regulated and it is companies’ decisions that shape the system they use.
Kaplan, Anderson, and Stevens11 recognized the weaknesses of ABC. One issue has been that the compilation of the time taken by various activities in an organization has been derived from interviews and surveys with individuals undertaking those activities. In a large organization, this can be very time-consuming and expensive. It is also an exercise that organizations would not wish to repeat frequently so the original estimates become outdated. One could also question the credibility of the data. There could be an understandable tendency for individuals to overestimate the time to demonstrate how hard they work!
The authors also questioned whether traditional ABC was suitable for complex operations. They pointed out that even shipping products could require a range of different approaches that could not be captured by a constant cost per order distributed.
Their proposed model simplifies ABC in two ways. First, managers are required to estimate on resources by each product, transaction, or customer. Two estimates are required: the cost per time unit of supplying resource capacity and the unit time of resource capacity consumption by each product, transaction, or customer. This provides the additional information on how many minutes that staff members spend on activities in a particular time period.
The authors have given guidance on how managers may best estimate these figures and then calculate the cost-driver rates. Time-driven ABC overcomes the difficulties and costs of implementing and maintaining a traditional ABC system and provides managers with cost and profit information quickly and inexpensively.
There have been several articles on variations of time-driven ABC and examples of organizations that have implanted it successfully. The proponents of the method write strongly in its favor, but we would not take this as encouragement for all organizations to adopt it. As we observed in Chapter 1, it is for the organization to decide which system best meets its needs. In doing so, it will change and shape the system so that it fits the organization and not for the organization to fit the system.
The evidence that is available suggests that TDABC is more appropriate and easier for companies operating in the service sector to implement than manufacturing companies. This is because capacities are generally measured in labor time and this could be easier in service companies because the capacities are generally measured in terms of labor time.
Predetermined Overheads
In the previous discussions on both full and ABC, we referred to the indirect costs without specifying the period of time in question. Upon reflection, you will realize that an organization cannot wait until the end of a financial period when the actual overhead amount is known. To do so would delay decision making and even the timely invoicing customers.
For this reason, overhead costs for the financial period, usually for a year, are predicted through a budgetary control system that we discuss in chapters 3 and 4. Using these predictions of the overhead costs, the allocation rate, whether machine hour or any other basis, is calculated and applied using the predicted figures.
Unfortunately, no matter how carefully budgets are determined, our financial predictions based on our strategy may not be completely valid. Also, we can expect that some of our predictions will not be 100 percent accurate. If that is the case, the overhead we are charging to the products and services we provide will be incorrect, and we will be in one of two situations.
In one situation, the amount of overhead we charge will be too high. This is technically known as overabsorption of overhead. The consequences can be dramatic. It is likely that the prices of products and services will be set too high, which will make the organization noncompetitive, and efforts will be made on cost reduction but will be misdirected.
In the other situation, the amount of overhead will be too low. Technically this is known as underabsorption, and the consequences are the reverse of the first situation. The organization may underprice its products and services and be operating at a loss.
To avoid the peril of these situations, the accountants keep a close eye on the overheads that were budgeted and those that are actually incurred. Adjustments can be made to correct the situation as the financial period progresses.
Job Costing for Manufacturing and Service Organizations
Identifying the Job
The type of work an organization chooses to undertake is the key component of its strategy. The purpose of job costing, also known as specific order costing, is to identify the cost of the job, whether it involves a tangible product or a particular service for a client.
You may have some preconceptions on what is a job. The following are examples:
•Your local garage servicing your car
•Workers building a bridge across a river
•A clinic conducting cosmetic surgery
•Guards providing security at an international meeting of politicians
A job has the following characteristics:
•It is an identifiable piece of work.
•It is carried out to a customer’s specific requirements.
•Direct costs such as materials and labor can be identified with the job.
We will omit long-term jobs from our discussions, such as building a bridge, as these are also affected by financial accounting regulations and have their own characteristics. We will concern ourselves with work that is of short duration, normally under a year. In these circumstances, each separate job is recognized as the cost object.
We have already explained the principles of full costing. This involves identifying the direct material and direct labor cost with the job. To this is added the share of the overheads. As each job is specific to the customer and the period of time the job takes is crucial, either the direct hours or machine hours taken for the job are used as the allocation rate.
One example of job costing you may be familiar with is taking your car to the garage for a service. Usually you receive an invoice that lists the parts fitted (direct materials) and also the time taken by the mechanic (direct labor). You will find that the rate charged for the mechanic’s time is well above the actual pay rate. This is because it includes the allocation rate for the overhead. Garages usually use a labor hour rate to charge overheads to the job.
Calculating the Total Cost
Following is a worked example that illustrates all the stages in arriving at the full cost of a product. Once again, we simplified the calculations so you can concentrate on the principles used.
Danau Security Systems
This is a small company that designs and installs security systems for commercial enterprises. It pays all the direct labor $10 per hour. The company uses full costing and has three production departments. With any job it does, the company adds 10 percent to the production cost of the job to cover the administration and selling of overheads and then adds a 5 percent markup to allow for profit. The data in Table 2.6 are available for the next financial year. These data will be used to share the factory overhead over the three departments using an arbitrary but reasonable basis.
Table 2.6 Data for Danau security systems

Table 2.7 Overhead analysis statement

The company decides to use the machine hour rate in the fabrication department and the labor hour rate in the other two departments. According to Table 2.7, the machine hour rate in the fabrication department is $48,000/12,000 hours = $4.00 per hour. The labor hour rate in the assembly department is $61,500/7,500 hours = $8.20 and in the installation department, $31,500/4,000 hours = $7.875.
Let us assume that a client, Global Sports, has agreed with DSS on the type of security system it requires and has asked for a quote for the job. DSS will draw up a job specification, and Table 2.8 shows a typical example. We have given you the amounts for the direct materials and labor so that the basis for charging the overheads can be clearly displayed. You should have little difficulty with the calculations if you remember our explanation in the first part of the chapter. This job passes through the three departments, and therefore the actual labor cost in each department must be charged at the rate of $10.00 per hour. In addition, a charge must be made for the overheads. In the fabrication department, machine hours are considered most important and the overhead is calculated using the machine hour allocation rate. In the other two departments, labor hours are deemed to be most important, but remember that the labor hour allocation rate for overheads must be used, not the pay rate.
There are two important points that need to be made on the managerial aspect of the statement as follows:
•It is both a plan and a control document. If Danau Security Systems (DSS) wins this job, it will use the job specification to control the progress of the job.
•The figures are predictions, but there is little scope for error. If the overheads are incorrectly predetermined, the profit could quickly turn into a loss.
Danau could have used a “blanket” rate for factory overheads instead of the departmental rate. This would mean that the total overheads of $141,000 would be divided by the total predicted labor hours of 15,000 to give an overhead recovery rate of $9.40. If you multiply this rate by the total labor hours, the result is an overhead charge of 2,660 × $9.40. This gives an overhead charge for the job of $25,004 compared to the amount on the job specification of $23,979.
Table 2.8 Global sports quote

Which one is right? The answer is that both are “right” within the logic of the method you are using, but you will find that a departmental rate is likely to give you more precise information for control and decision making than a blanket rate.
This returns us to the theme raised in Chapter 1, which is the cost of costing. Strategic cost information can be extremely detailed and precise. But to contribute to the organization, it must be available by the time required and should not be more expensive to generate than the perceived value it contributes. In Chapter 6, we examine more comprehensive strategic cost techniques. With each of these, the question needs to be asked whether it is a value-added activity.
In some industries, it is sometimes possible to negotiate the price of a job on a cost plus policy. The final selling price is calculated by adding an agreed fixed-profit margin to the cost of the job. This approach has a number of weaknesses, as there is no incentive to control the cost of the job. It ignores market conditions, and the total costs are dependent on the method of overhead recovery. If a client does enter into such a contract, it is essential that the job specification is agreed in minute detail.
Where the jobs are specifically designed for one customer, job costing can provide managerial advantages. In discussing job costing in the landscaping industry, Stewart12 lists the following benefits:
•Crews have clear and measurable goals—if there is no plan to compare with actual progress, there may be no urgency to get the work completed.
•The manager can evaluate how close the estimated cost is to the actual cost.
•There is a record that can be used to train new estimators and fix consistent mistakes.
As a final note on specific order operations, remember the nature of the activity being undertaken. In some industries, certain jobs are so repetitive and financially minor that the company does not need to cost each job. Everyday examples are oil changes for your car, visits to the dental hygienist, or printing business cards. Although there is a customer (yourself) and the job is specifically for you, the service provider usually has a standard price based on previous experience. This “average” cost is deemed sufficiently precise to determine strategy.
Costing in the Services Sector
Defining the Service Sector
There is difficulty in defining the service sector. Does it include your local dentist who may conduct a dozen extractions each day? Is it your local cinema that has hundreds of customers a day? Is it your local authority that is servicing the needs of a large city? Is it an organization where the individual pays for the service or does it receive government funding?
A review of the literature by Terzioglu and Chan13 captures the complexity in understanding costing in the service sector and the reluctance of academics to provide guidance. Frequently text books will refer to “service costing” as if it is a separate method used from those that we have discussed in this chapter. In our opinion, there is presently no specific method of costing devised just for service activities. To support this, we give the following quote from Rezzae14: banks, like manufacturing firms, use either standard or actual cost systems. The two basic costing methods used by banks are unit costs and cost allocations. Ironically, these are the tools of any cost accounting system and the basics are not unique to banking.
However, there are certain attributes of service operations that emphasize specific features of the basic costing method applied. Even a brief examination will identify the following features.
•The organizations are frequently national or international operations with a complicated management structure.
•A range of services may be offered, sometimes very different in nature.
•Products may be manufactured in addition to the services provision.
At a more detailed level, Modell15 extracted from the relevant literature the following characteristics that differ in service organizations from manufacturing.
•As service organizations usually have little inventory, the distinction between product and period costs are not relevant.
•It is difficult to separate service organization’s costs into their fixed and variable elements.
•Specific costs are not easily traceable to certain revenue or output items.
•A substantial share of the costs is overheads.
As for the last point, it has been estimated that between 60 percent and 85 percent of total costs in U.S. health care institutions are classified as fixed, with a substantial proportion of that being labor costs.16
Determining the Cost Object
Some of the aspects of service operations that should be taken into account when identifying the cost object are:
•the insignificance of cost of materials
•the significance of direct labor.
Allocation of overheads is far more complicated than in a manufacturing organization.
It may be difficult to define the cost object, and hypothetical ones must be generated. For example, a hotel may decide on an occupied bed night or a transport company on a hybrid measure combining weight and distance mile.
Because of these features, some trends have emerged in recent years, and articles have been published that give a guide to practices in the service sector. If we consider the two methods to identify the total cost of an activity, both full costing and ABC are used. In service organizations where a sensible cost object can be devised or where there are identifiable jobs, the procedures we have explained in this chapter can be applied for the allocation of overheads and the calculation of an allocation rate. But given the differing characteristics of service organizations, it is not surprising that new costing techniques, such as ABC, aimed at allocating costs to various activities are attracting significant interest and application.
Process Costing in Manufacturing
The Issues
Key Definition
Process costing is used where there are continuous operations in manufacturing, and a stream of homogeneous products flow from one process to the next until the production is complete.
The costing method is used where the production process is carried out in a series of separate stages with identifiable inputs and outputs at each stage. The finished output at one stage of production becomes the input for the next stage. Each stage or process can usually be clearly identified and is often contained in a separate department.
At each separate stage, both direct and indirect costs are calculated. Direct costs for a particular process can be identified from the accounting records. Overheads will be allocated to the separate processes in the way we described under full costing. The average cost of each cost object can be calculated at each stage by simply dividing the total cost of that process for a period of time by the number of cost objects produced in that period. The costs for the cost objects are aggregated to give the final total cost for all the processes that production goes through.
If you refer back to our discussion on overhead allocation, you will see that we are using the basis of dividing total costs for a period of time by the number of cost objects produced. Alternative methods such as machine hours or labor hours would not be relevant.
Simple as this method of costing is, there is an additional problem that occurs at the end of each financial period. We know the number of units completed during the financial period and transferred as inputs to the next process. A number of cost objects are not completed by the end of the financial period for each of the separate processes. We need to know the cost of these incomplete units.
You will find that some accounting textbooks devote considerable space in demonstrating the calculations in detail. This is essentially to provide the required information for financial accounts, and the usefulness of these calculations for the management of processes is doubtful.
In our explanation of process costing, we therefore use a simplified approach that demonstrates fully the principles without becoming entangled in the detail. In the following example, we are assuming that a company has two separate processes in the production flow. The completed outputs from Process 1 are transferred to Process 2 as the inputs for that process. For each process, the direct materials, direct labor, and a share of the overheads for that financial period are identified.
If there was not the problem of incomplete units at the end of the financial period, the calculations are easy. Assume that in the month of January, a company that has two processes has the following information for Process 1:

The number of completed units transferred to Process 2 during the period was 80,000.
There were no incomplete units in Process 1 at the end of the period.
Average cost per completed unit for the period $20,000/80,000 = $0.25
Let us now introduce the problem of incomplete units and the concept of “equivalent units.” If a unit is not complete at the end of the financial period, it will not be transferred to Process 2 but will remain in Process 1 to be completed. This will incur additional costs in the next financial period to complete the units. What we need to know is how much it has cost us in January in Process 1 to produce these incomplete units: the work in process (WIP).
The answer to finding their cost is to use the concept of equivalent units. If at the end of January there were 5,000 units that had been only 50 percent completed, we would say that these were the equivalent of 2,500 completed units. We have calculated that the cost of a completed unit is $0.25, so the cost of our 5,000 incomplete units is 2,500 × $0.25 = $625.
You most likely have several comments on this calculation. The first will be on the somewhat imprecise nature of the calculation. We could, with time and effort, obtain a more accurate figure, but it is highly doubtful that information would improve your control of operations and your decision making.
Your second comment may be on the assumption that 50 percent completion of the unit means that 50 percent of the cost has been incurred. We address that issue in the next example, where we look at Process 2 for the same company for the month of February.
Resolving the Issues
The information we use to construct Table 2.9 is as follows:
•The 80,000 completed cost objects have been transferred from Process 1 at the end of January.
•At the end of February, there are 78,000 units completed, and there are 2,000 units incomplete that form WIP.
•With the 2,000 units that form WIP, obviously all the costs are complete for Process 1, otherwise the units would not have been transferred.
•Direct material cost for Process 2 has been completed.
•The cost objects are 50 percent complete as far as direct labor and overheads are concerned.
Table 2.9 Process 2: Costs for February

1.Previous process costs are always complete if products are transferred to the next process. Incomplete units will not be transferred to the next process.
2.The average cost per unit in column 6 is calculated by dividing the total cost per item (column 2) by the number of effective units (column 5).
3.Process 2 has 78,000 completed units at the end of the financial period. Of the remaining 2,000, the costs are complete from Process 1 and for materials but only 50 percent complete for direct labor and overheads. This gives us the value of WIP.
4.Abnormal losses or gains should not be included in the costs of the products.
5.Where the output from one process is developed into two or more different products, the technique of joint process costing will be applied.
The method of costing for processes is fairly straightforward, and the attention given to it in some textbooks is misapplied. It is not as important for strategic costing as you may think. It is important for financial accounting where it is essential to identify the full cost of the products and the value of inventory. In support of this contention, we refer to a study of three companies that discovered the process costing practices were different from that described in management texts. In fact, the companies paid considerable effort on developing accurate standard input costs and volumes rather than the information from process costing to help manage business operations efficiently and effectively.17 We explain standard costing in the following chapter.
Process costing is useful to record the costs of the manufacturing activity, but it is essential to view it in the context of other methods and techniques which companies use as part of their strategic costing management.
Conclusions
This chapter has considered different approaches to calculate what a product or service costs. The first step is to determine the classification of costs. The main types discussed in this chapter are direct costs and indirect costs. Charging direct costs to what is being costed is merely a matter of having good procedures and record keeping. The indirect costs or overheads cause a problem, and the two different solutions are full (absorption costing) and ABC, whether traditional or time-driven.
Full costing, as demonstrated in our explanations of job costing and process costing, has two features:
•The predetermined overheads of the financial period are shared over the production departments in a fair but arbitrary manner.
•The overheads for that production department are charged to the units passing through it using mainly number of cost units, machine hours, or labor hours.
ABC has emerged as an alternative to absorption costing because of changes in manufacturing operations and the growth of the service sector. The greater application of technology, the use of techniques such as JIT, and the reduction and change in the nature of direct labor have meant that traditional costing methods are not providing sufficiently accurate information for decision-making purposes.
ABC is a costing system in which costs are first assigned to pools, and then cost drivers are used to calculate the total cost of specified activities. ABC offers the advantage of more accurate information than absorption costing because it looks for a closer relationship between overheads and the cause of these indirect costs. However, it suffers from the disadvantage that it is costly to implement and operate. The procedure for ABC is to identify the following:
•Cost pools which are identifiable activity centers that perform an operation that uses resources.
•Cost drivers that cause a change in the activities of the cost pool.
•Cost-driver rates by dividing the costs of the cost pool by the units of activities.
Because of the difficulties and cost of implementing traditional ABC, a simplified method known as time-driven ABC has been devised, and advocates claim that it offers several advantages.
We argued in this chapter that there are no specific costing methods for service organizations, but there are certain features that need to be addressed:
•The organizations are frequently national or international operations with a complicated management structure.
•A range of services may be offered, sometimes very different in nature.
•Products may be manufactured in addition to the services provision.
•It is sometimes difficult to identify the cost object.
The evidence available suggests that ABC is most useful in service organizations where complexity of operations and the cost object are not assessed successfully by full costing. As with all costing methods and techniques, you need to ask whether it provides the cost information you require to construct and successfully achieve the corporate strategy.
Notes
1.Compton and Brinker (2005, p. 16).
2.Mastilak (2015).
3.Elkington (1997).
4.Meeting and Harvey (1998).
5.Kaplan and Bruns (1987).
6.Dugdale and Jones (1997).
7.White, Anitsal, and Anitsal (2015).
8.Vaughn, Raab, and Nelson (2010).
9.Chen and Wang (2016).
10.Lu, Sridharan, and Tse (2016).
11.Kaplan, Anderson, and Stevens (2004).
12.Stewart (2016).
13.Terzioglu and Chan (2013).
14.Rezaee (2005).
15.Modell (1996).
16.Tipgos and Crum (1982).
17.Dosch and Wilson (2010).