
17. Metrics and Measures
As the saying goes, “If you don’t measure something, you can’t manage (or improve) it.” This was never truer than in the supply chain and logistics management field. As discussed throughout this book, an assortment of tradeoffs exist in a supply chain (for example, cost versus service), which must be counterbalanced against each other to be successful for the long term.
It is important to match your supply chain performance measures to fit your company’s mission and strategy, keeping in mind that performance measures can affect the behavior of managers and employees.
It is also vital to target and measure supply chain performance to meet customer expectations, improve supply chain capability, improve asset performance, motivate the workforce, and provide stakeholders with a satisfactory return on their investment.
Although technology today makes it much easier to gather and analyze data, there is a lot more of it available, making it all the more important to measure only the right things and to avoid wasted effort; otherwise, you might fall under the dreaded phenomena of paralysis by analysis. The results of analysis should be used effectively.
Measurement and Control Methods
To have an efficient and effective supply chain requires a set of standards to compare to actual performance. These standards are referred to as metrics.
There are a variety of established metrics for the supply chain, such as those defined by the SCOR model mentioned in Chapter 1, “Introduction,” but determining the appropriate metrics for your organization can be a complex problem.
Selecting and measuring the wrong set of metrics can lead your company to follow the wrong goals because metrics tend to drive behavior.
In supply chain and logistics management, cost metrics need to focus on the entire extended supply chain (internal and external), not on just one function or one link.
The Evolution of Metrics
Historically, businesses would focus on manufacturing costs as a measure of efficiency. That was eventually extended to transportation costs in the 1970s. In the 1980s and 1990s, this view was expanded to look at the broader performance of distribution and logistics costs, which were supplemented with more meaningful performance indicators such as the delivery rate and percentage of order fulfillment as a more customer-based focus emerged.
The advent of the global supply chain, the Internet, and enterprise resource planning (ERP) systems allowed organizations to take an even broader view of both their extended supply chains and more easily gather, measure, and analyze cost and service information.
Today, relying on traditional supply chain execution systems is becoming increasingly more difficult, with a mix of global operating systems, pricing pressures, and ever-increasing customer expectations. There are also recent economic impacts such as rising fuel costs, the global recession, supplier bases that have shrunk or moved offshore, as well as increased competition from low-cost outsourcers. All of these challenges potentially create waste in your supply chain. That’s where data analytics comes in.
Data Analytics
Data analytics is the science of examining raw data to help draw conclusions about information. When applied to the supply chain, it is often described as supply chain analytics. It is used in many industries to allow companies and organization to drive insight, make better business decisions and actions, as well as the sciences to verify (or disprove) existing models or theories.
One way to look at data analytics is to break it into four categories:
![]() Descriptive analytics: Uses historical data to describe a business; also described as business intelligence (BI) systems. In supply chain, descriptive analytics help to better understand historical demand patterns, to understand how product flows through your supply chain, and to understand when a shipment might be late.
Descriptive analytics: Uses historical data to describe a business; also described as business intelligence (BI) systems. In supply chain, descriptive analytics help to better understand historical demand patterns, to understand how product flows through your supply chain, and to understand when a shipment might be late.
![]() Diagnostic analytics: Once problems occur in the supply chain, an analysis needs to be made of the source of the problem. Often this can involve analysis of the data in the systems to see why the company was missing certain components or what went wrong that caused the problem.
Diagnostic analytics: Once problems occur in the supply chain, an analysis needs to be made of the source of the problem. Often this can involve analysis of the data in the systems to see why the company was missing certain components or what went wrong that caused the problem.
![]() Predictive analytics: Uses data to predict trends and patterns; often associated with statistics. In the supply chain, predictive analytics could be used to forecast future demand or to forecast the price of a product.
Predictive analytics: Uses data to predict trends and patterns; often associated with statistics. In the supply chain, predictive analytics could be used to forecast future demand or to forecast the price of a product.
![]() Prescriptive analytics: Using data to select an optimal solution. In the supply chain, you might use prescriptive analytics to determine the optimal number and location of distribution centers, set your inventory levels, or schedule production.
Prescriptive analytics: Using data to select an optimal solution. In the supply chain, you might use prescriptive analytics to determine the optimal number and location of distribution centers, set your inventory levels, or schedule production.
Traditional measures tend to be based on historical data and not focused on the future, do not relate to strategic, nonfinancial performance goals such as customer service and product quality, and do not directly tie to operational effectiveness and efficiency.
Measurement Methods
A number of measurement methods have been developed or enhanced in recent times, including the following:
![]() The balanced scorecard: A strategic planning and management system that aligns business activities to the vision and strategy of the organization, improves internal and external communications, and monitors organization performance against strategic goals. It adds strategic nonfinancial performance measures to traditional financial metrics to give managers and executives a more balanced view of organizational performance.
The balanced scorecard: A strategic planning and management system that aligns business activities to the vision and strategy of the organization, improves internal and external communications, and monitors organization performance against strategic goals. It adds strategic nonfinancial performance measures to traditional financial metrics to give managers and executives a more balanced view of organizational performance.
![]() The Supply Chain Council’s SCOR model: Metrics in this model provide a foundation for measuring performance and identifying priorities in supply chain operations.
The Supply Chain Council’s SCOR model: Metrics in this model provide a foundation for measuring performance and identifying priorities in supply chain operations.
![]() Activity-based costing (ABC): A costing and monitoring methodology that identifies activities in an organization and assigns the cost of each activity with resources to all products and services according to actual consumption by each product and service.
Activity-based costing (ABC): A costing and monitoring methodology that identifies activities in an organization and assigns the cost of each activity with resources to all products and services according to actual consumption by each product and service.
![]() Economic value analysis (EVA): The value created by an enterprise, basing it on operating profits in excess of capital utilized (through debt and equity financing). These types of metrics can be used to measure an enterprise’s value-added contributions within a supply chain (not as useful for detailed supply chain measurements).
Economic value analysis (EVA): The value created by an enterprise, basing it on operating profits in excess of capital utilized (through debt and equity financing). These types of metrics can be used to measure an enterprise’s value-added contributions within a supply chain (not as useful for detailed supply chain measurements).
No matter, which method you use, it is a good idea that the metrics are consistent with overall corporate strategy, focused on customer needs, and that expectations are prioritized and focused on processes and not functions.
Furthermore, metrics should be implemented consistently throughout the supply chain, with actions and rationale communicated to everyone.
It is also a good idea to use some kind of balanced approach when selecting and developing metrics, using precise costs to measure improvement (in detail and in the aggregate), which can be greatly aided by the use of technology.
Measurement Categories
Each method has its own specifics, but it is important to at least include the measurement categories of time, quality, and cost in one form or another:
![]() Time: Includes on-time delivery and receipt, order cycle time, and variability and response time.
Time: Includes on-time delivery and receipt, order cycle time, and variability and response time.
![]() Quality: Measures customer satisfaction, processing and fulfillment accuracy, including on-time, complete, and damage-free order delivery, as well as accurate invoicing. Also includes planning (including forecasting) and scheduling accuracy.
Quality: Measures customer satisfaction, processing and fulfillment accuracy, including on-time, complete, and damage-free order delivery, as well as accurate invoicing. Also includes planning (including forecasting) and scheduling accuracy.
![]() Cost: This category includes financial measurements such as inventory turns, order-to-cash cycle time, and total delivered costs broken up by cost of goods, transportation, carrying, and material handling costs.
Cost: This category includes financial measurements such as inventory turns, order-to-cash cycle time, and total delivered costs broken up by cost of goods, transportation, carrying, and material handling costs.
Another way of looking at supply chain measurement categories is in terms of where they will be applied:
![]() Strategic level: Measures include lead time against industry norm (that is, benchmarking, as discussed later in this chapter), quality level, cost-saving initiatives, and supplier pricing against market.
Strategic level: Measures include lead time against industry norm (that is, benchmarking, as discussed later in this chapter), quality level, cost-saving initiatives, and supplier pricing against market.
![]() Tactical level: Measures include the efficiency of purchase order cycle time, booking-in procedures, cash flow, quality assurance methodology, and capacity flexibility.
Tactical level: Measures include the efficiency of purchase order cycle time, booking-in procedures, cash flow, quality assurance methodology, and capacity flexibility.
![]() Operational level: Measures include ability in day-to-day technical representation, adherence to developed schedule, ability to avoid complaints, and achievement of defect-free deliveries.
Operational level: Measures include ability in day-to-day technical representation, adherence to developed schedule, ability to avoid complaints, and achievement of defect-free deliveries.
Now let’s look at several of the major models for measuring the supply chain: the balance scorecard approach and the SCOR model.
Balanced Scorecard Approach
When using the balanced scorecard approach to the supply chain, you need to consider it from four different perspectives:
![]() Customer perspective: How do customers see us?
Customer perspective: How do customers see us?
![]() Internal business perspective: What must we excel at?
Internal business perspective: What must we excel at?
![]() Financial perspective: How do we look to shareholders?
Financial perspective: How do we look to shareholders?
![]() Innovation and learning perspective: Can we continue to improve and create value?
Innovation and learning perspective: Can we continue to improve and create value?
Next we must put it in a framework that integrates the organization’s overall goals and strategies with selected supply chain metrics in the categories of customer service, operations, and finance (see Figure 17.1).
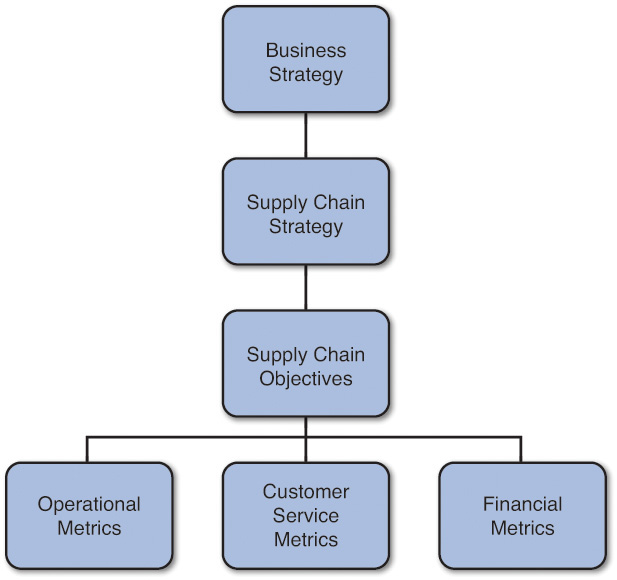
It is always critical that supply chain and logistics metrics connect to the overall business strategy. For example, if a company uses a cost strategy, as described in Chapter 1, a financial metric like inventory turnover would be critical. If they employ a response strategy, inventory turns might not be as critical as, say, delivery time.
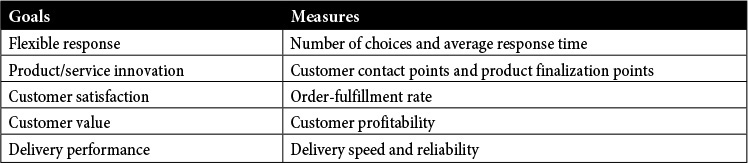
Customer Service Metrics
Customer service metrics indicate a company’s ability to satisfy the needs of customers by meeting customer’s needs on a timely basis and creating exceptional values to the customers (see Table 17.1).
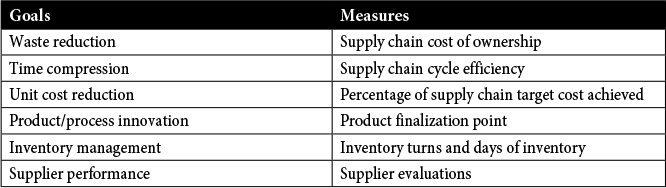
Operational Metrics
Operational metrics come from internal processes, decisions, and actions needed to meet or exceed customer expectations. They are drivers of future financial performance (see Table 17.2).
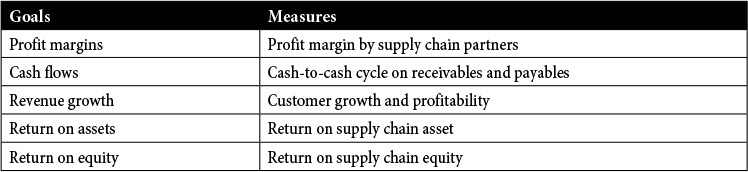
Financial Metrics
Financial metrics indicate whether the company’s strategy, implementation, and execution create value for the shareholders by contributing to improvements in profitability (see Table 17.3).
SCOR Model
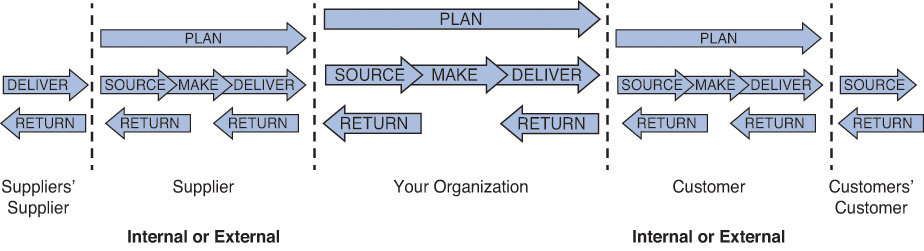
Another, relatively newer approach to measuring the supply chain is the SCOR model that was discussed in Chapter 1. To recap, the SCOR model was designed to help companies to communicate, compare, and learn from competitors and companies both within and outside of their industry. It measures an organization’s supply chain performance and the effectiveness of and supply chain improvements and can also help to test and plan future process improvements.
The SCOR model contains over 200 process elements, 550 metrics, and 500 best practices, including risk and environmental management, and is organized around the 5 primary management processes of plan, source, make, deliver, and return (see Figure 17.2).
The model is based on three major pillars:
![]() Process modeling: To describe supply chains that are very simple or very complex using a common set of definitions, SCOR provides three levels of process detail. Each level of detail assists a company in defining scope (level 1), configuration or type of supply chain (level 2), and process element details, including performance attributes (level 3). Below level 3, companies decompose process elements and start implementing specific supply chain management practices. It is at this stage that companies define practices to achieve a competitive advantage and adapt to changing business conditions.
Process modeling: To describe supply chains that are very simple or very complex using a common set of definitions, SCOR provides three levels of process detail. Each level of detail assists a company in defining scope (level 1), configuration or type of supply chain (level 2), and process element details, including performance attributes (level 3). Below level 3, companies decompose process elements and start implementing specific supply chain management practices. It is at this stage that companies define practices to achieve a competitive advantage and adapt to changing business conditions.
![]() Performance measurements: SCOR metrics are organized in a hierarchical structure. Level 1 metrics are at the most aggregated level and are typically used by top decision makers to measure the performance of the company’s overall supply chain. Level 2 metrics are primary, high-level measures that may cross multiple SCOR processes.
Performance measurements: SCOR metrics are organized in a hierarchical structure. Level 1 metrics are at the most aggregated level and are typically used by top decision makers to measure the performance of the company’s overall supply chain. Level 2 metrics are primary, high-level measures that may cross multiple SCOR processes.
![]() Best practices: Once the performance of the supply chain operations has been measured and performance gaps identified, it becomes important to identify what activities should be performed to close those gaps. More than 430 executable practices derived from the experience of Supply Chain Council (SCC) members are available.
Best practices: Once the performance of the supply chain operations has been measured and performance gaps identified, it becomes important to identify what activities should be performed to close those gaps. More than 430 executable practices derived from the experience of Supply Chain Council (SCC) members are available.
Also, as mentioned in pillar 1 earlier, SCOR levels range from broadest to narrowest and are defined as follows:
![]() Level 1. Scope: Defines business lines, business strategy, and complete supply chains
Level 1. Scope: Defines business lines, business strategy, and complete supply chains
![]() Level 2. Configuration: Defines specific planning models such as make to order (MTO) or make to stock (MTS), which are basically process strategies
Level 2. Configuration: Defines specific planning models such as make to order (MTO) or make to stock (MTS), which are basically process strategies
![]() Level 3. Activity: Specifies tasks within the supply chain, describing what people actually do
Level 3. Activity: Specifies tasks within the supply chain, describing what people actually do
![]() Level 4. Workflow: Includes best practices, job details, or workflow of an activity
Level 4. Workflow: Includes best practices, job details, or workflow of an activity
![]() Level 5. Transaction: Specific detail transactions to perform a job step
Level 5. Transaction: Specific detail transactions to perform a job step
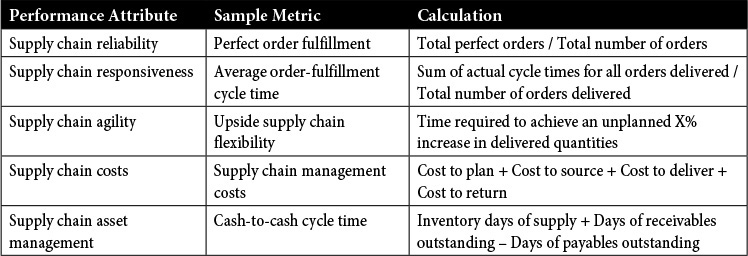
Furthermore, all SCOR metrics have five key strategic performance attributes. A performance attribute is a group of metrics used to express a strategy. An attribute itself cannot be measured; it is used to set strategic direction.
The five strategic attributes are as follows:
![]() Reliability: The ability to deliver on-time, complete, in the right condition and packaging and with the correct documentation to the right customer
Reliability: The ability to deliver on-time, complete, in the right condition and packaging and with the correct documentation to the right customer
![]() Responsiveness: The speed at which products and services are provided
Responsiveness: The speed at which products and services are provided
![]() Agility: The ability to change (the supply chain) to support changing (market) conditions
Agility: The ability to change (the supply chain) to support changing (market) conditions
![]() Cost: The cost associated with operating the supply chain
Cost: The cost associated with operating the supply chain
![]() Assets: The effectiveness in managing assets in support of demand satisfaction
Assets: The effectiveness in managing assets in support of demand satisfaction
Table 17.4 shows some strategic metrics for level 1.
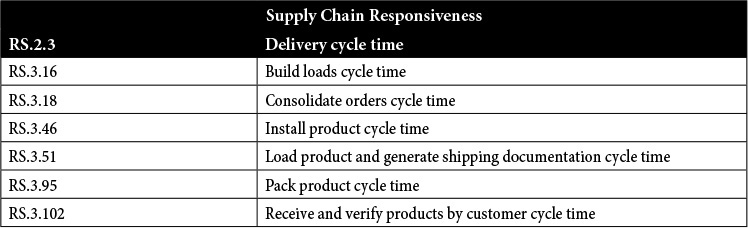
At lower levels of detail, the SCOR model sets a variety of specific, standard measures that can be used by an organization. Table 17.5 lists some examples under the performance attribute of supply chain responsiveness for the deliver component of the SCOR model.
Table 17.4 SCOR Model Strategic Metrics
Supply Chain Dashboard and KPIs

Source: S&OP Excel Template, published with permission of Logistics Planning Associates, LLC
One way to measure, analyze, and manage supply chain performance is with the use of a dashboard. The dashboard can range from data that is manually collected and put into a spreadsheet with some graphs, to a more automated visual dashboard generated by an ERP system.
A supply chain dashboard helps in decision making by visually displaying in real time (or close to it) leading and lagging indicators in a supply chain process perspective. It can help to you visualize trends, track performance targets, and understand the most critical issues facing your company’s supply chain.
Indicators
Metrics used in performance dashboards are typically called key performance indicators (KPIs). Having a standardized set of KPIs allows you to review supply chain operations efficiently across regions, business units, and plants (and even brands and channels).
KPIs usually fall into one of three categories:
![]() Leading indicators: Have a significant impact on future performance by measuring either current state activities (for example, the number of items produced today) or future activities (for example, the number of items scheduled for production this week)
Leading indicators: Have a significant impact on future performance by measuring either current state activities (for example, the number of items produced today) or future activities (for example, the number of items scheduled for production this week)
![]() Lagging indicators: Measures of past performance, such as various financial measurements, or in the case of the supply chain, measurements in areas such as cost, quality, and delivery
Lagging indicators: Measures of past performance, such as various financial measurements, or in the case of the supply chain, measurements in areas such as cost, quality, and delivery
![]() Diagnostic: Areas that may not fit under lead or lagging indicators but indicate the general health of an organization (Myerson, 2012)
Diagnostic: Areas that may not fit under lead or lagging indicators but indicate the general health of an organization (Myerson, 2012)
Benchmarking
After you have established what KPIs to measure, you need to determine how to gauge yourself against them. This is known as benchmarking, which is the process of comparing one’s business processes and performance metrics to industry bests or best practices from other companies. The dimensions that are typically measured are quality, time, and cost. There is both internal and external benchmarking.
Internal benchmarking can be used when the organization is large enough and data is fairly accessible. For example, a company like General Electric with over 100 business units can compare some KPIs across businesses.
External benchmarking is a process where management identifies the best firms in their industry, or in another industry where similar processes exist, comparing the results and processes of those target companies to their own results and processes. This allows them to learn how well the targets perform and, more importantly, the best practice business processes that help to explain why these firms are successful.
The process of selecting best practices to use as a standard for performance involves the following general steps:
1. Determine what to benchmark. What processes are most important to measuring the success of your supply chain? Can be based on your company’s overall and supply chain strategies, goals, and objectives. In some cases, you may want to be best in class, and in others, being average may be just fine.
2. Form a benchmark team. Select those with some skin in the game.
3. Identify benchmarking partners. Should be a combination of those involved in the day-to-day processes as well as those affected and management (can also include customers and suppliers).
4. Collect and analyze benchmarking information. There are many sources of best practice metrics. In many cases, companies can pay for this information from consultants or through associations that they belong to.
5. Take action to match or exceed the benchmark. This involves process improvement, the topic of the next chapter.