
Partial Likelihood
What’s remarkable about partial likelihood is that you can estimate the β coefficients of the proportional hazards model without having to specify the baseline hazard function λ0(t). In this section, we will
consider some general properties of partial likelihood
look at two simple examples using PROC PHREG
examine the mathematics of the method in some detail.
The likelihood function for the proportional hazards model of equation (5.1) can be factored into two parts:
one part depends on both λ0(t) and β (the vector of coefficients)
the other part depends on β alone.
What partial likelihood does, in effect, is discard the first part and treat the second part—the partial likelihood function—as though it were an ordinary likelihood function. You get estimates by finding values of β that maximize the partial likelihood. Since there is some information about β in the discarded portion of the likelihood function, the resulting estimates are not fully efficient. Their standard errors are larger than they would be if you used the entire likelihood function to obtain the estimates. In most cases, however, the loss of efficiency is quite small (Efron 1977). What you gain in return is robustness because the estimates have good properties regardless of the actual shape of the baseline hazard function. To be specific, partial likelihood estimates still have two of the three standard properties of ML estimates: they are consistent and asymptotically normal. In other words, in large samples they are approximately unbiased and their sampling distribution is approximately normal.
Another interesting property of partial likelihood estimates is that they depend only on the ranks of the event times, not their numerical values. This implies that any monotonic transformation of the event times will leave the coefficient estimates unchanged. For example, we could add a constant to everyone’s event time, multiply the result by a constant, take the logarithm, and then take the square root—all without producing the slightest change in the coefficients.
Partial Likelihood: Examples
Let’s first apply the partial likelihood method to the recidivism data that we introduced in The Life-Table Method in Chapter 3, “Estimating and Comparing Survival Curves with PROC LIFETEST,” and that was repeatedly analyzed in Chapter 4. The syntax for PROC PHREG is almost identical to that for PROC LIFEREG, except that you do not need to specify a distribution:
proc phreg data=recid;
   model week*arrest(0)=fin age race wexp mar paro prio;
run;
Output 5.1 shows the results.
Output 5.1. Results from Partial Likelihood Estimation with Recidivism Data
The PHREG Procedure

Data Set: RECID
Dependent Variable: WEEK
Censoring Variable: ARREST
Censoring Value(s): 0
Ties Handling: BRESLOW


                       Summary of the Number of
                       Event and Censored Values
                                                  Percent
                Total       Event    Censored    Censored

                  432         114         318       73.61

               Testing Global Null Hypothesis: BETA=0

              Without       With
Criterion   Covariates   Covariates   Model Chi-Square

-2 LOG L      1351.367     1318.241     33.126 with 7 DF (p=0.0001)
Score             .            .        33.383 with 7 DF (p=0.0001)
Wald              .            .        31.981 with 7 DF (p=0.0001)

               Analysis of Maximum Likelihood Estimates

                 Parameter   Standard    Wald       Pr >        Risk
  Variable DF     Estimate     Error  Chi-Square Chi-Square    Ratio

  FIN       1    -0.379022    0.19136    3.92289     0.0476    0.685
  AGE       1    -0.057246    0.02198    6.78122     0.0092    0.944
  RACE      1     0.314130    0.30802    1.04008     0.3078    1.369
  WEXP      1    -0.151115    0.21212    0.50750     0.4762    0.860
  MAR       1    -0.432783    0.38179    1.28493     0.2570    0.649
  PARO      1    -0.084983    0.19575    0.18848     0.6642    0.919
PRIO 1 0.091112 0.02863 10.12666 0.0015 1.095 |
The preliminary information is the same as in PROC LIFEREG, except for the line Ties Handling: BRESLOW. This line refers to the default method for handling ties—two or more observations that have exactly the same event time. Although Breslow’s method is nearly universal, we’ll consider three superior alternatives later in the section Tied Data. The middle of the output gives information on Testing Global Null Hypothesis: BETA=0. The null hypothesis is that all the coefficients are 0. Three alternative chi-square statistics are given: a likelihood-ratio test, a score test, and a Wald test. I already discussed the general properties of these tests in Chapter 4 (see Hypothesis Tests). Here we see that all three statistics are a bit over 30 with 7 d.f., leading to very small p-values. (The 7 d.f. correspond to the seven coefficients in the model.) We conclude that at least one of the coefficients is not 0. For the likelihood-ratio statistic, we are also given –2 times the (partial) log-likelihood for the model with the seven covariates as well as for a model with no covariates. The likelihood-ratio chi-square statistic is the difference between these two numbers.
In the lower part of the output, we see the coefficient estimates and associated statistics. Notice that there is no intercept estimate—a characteristic feature of partial likelihood estimation. The intercept is part of α(t), the arbitrary function of time, which cancels out of the estimating equations. As with PROC LIFEREG, the chi-square tests are Wald tests for the null hypothesis that each coefficient is equal to 0. These statistics are calculated simply by squaring the ratio of each coefficient to its estimated standard error. The last column, labeled Risk Ratio, is just eβ. For indicator (dummy) variables with values of 1 and 0, you can interpret the risk ratio as the ratio of the estimated hazard for those with a value of 1 to the estimated hazard for those with a value of 0 (controlling for other covariates). For example, the estimated risk ratio for the variable FIN (financial aid) is .685. This means that the hazard of arrest for those who received financial aid is only about 69 percent of the hazard for those who did not receive aid (controlling for other covariates). Version 7 SAS software will label this statistic as the hazard ratio because the term risk ratio is sometimes used to describe a ratio of probabilities rather than hazards.
For quantitative covariates, a more helpful statistic is obtained by subtracting 1.0 from the risk ratio and multiplying by 100. This gives the estimated percent change in the hazard for each one-unit increase in the covariate. For the variable AGE, the risk ratio is .944, which yields 100(.944 – 1) = – 5.6. Therefore, for each one-year increase in the age at release, the hazard of arrest goes down by an estimated 5.6 percent.
Overall, the results are similar to those we saw in Chapter 4 with the LIFEREG procedure. There are highly significant effects of age and the number of prior offenses, and a marginally significant effect of financial aid. Comparing the coefficients with those in Output 4.2 for the exponential model, we find that all the numbers are very close, but the signs are reversed. The p-values are also similar. The sign reversal is not surprising since the PROC LIFEREG estimates are in log-survival time format, while the PROC PHREG estimates are in log-hazard format. The PROC PHREG estimates are all larger in magnitude than the Weibull estimates in Output 4.3, but, again, that’s merely a consequence of the alternative ways of expressing the model. When we convert the Weibull estimates to log-hazard format by dividing by the scale estimate and changing the sign (as in The Weibull Model in Chapter 4), the results are remarkably close to the PROC PHREG estimates. Because the other PROC LIFEREG models (gamma, log-logistic, and log-normal) are not proportional hazards models, their coefficients cannot be converted to log-hazard format. Consequently, there is no point in comparing them with the PROC PHREG coefficients.
Now let’s look at a somewhat more complicated example, the famous Stanford Heart Transplant Data, as reported by Crowley and Hu (1977). The sample consists of 103 cardiac patients who were enrolled in the transplantation program between 1967 and 1974. After enrollment, patients waited varying lengths of time until a suitable donor heart was found. Thirty patients died before receiving a transplant, while another four patients had still not received transplants at the termination date of April 1, 1974. Patients were followed until death or until the termination date. Of the 69 transplant recipients, only 24 were still alive at termination. At the time of transplantation, all but four of the patients were tissue typed to determine the degree of similarity with the donor.
The following variables were input to SAS:
| DOB | date of birth. |
| DOA | date of acceptance into the program. |
| DOT | date of transplant. |
| DLS | date last seen (dead or censored). |
| DEAD | coded 1 if dead at DLS; otherwise, it is coded 0. |
| SURG | coded 1 if patient had open-heart surgery prior to DOA; otherwise, it is coded 0. |
| M1 | number of donor alleles with no match in recipient (1 through 4). |
| M2 | 1 if donor-recipient mismatch on HLA-A2 antigen, otherwise 0. |
| M3 | mismatch score. |
The variables DOT, M1, M2, and M3 are coded as missing for those patients who did not receive a transplant. All four date measures are coded in the form mm/dd/yy, where mm is the month, dd is the day, and yy is the year. Here is the raw data for the first 10 cases:
DOB         DOA         DOT         DLS         DEAD   SURG    M1     M2    M3

01/10/37    11/15/67        .       01/03/68     1      0      .      .     .
03/02/16    01/02/68        .       01/07/68     1      0      .      .     .
09/19/13    01/06/68    01/06/68    01/21/68     1      0      2      0     1.110
12/23/27    03/28/68    05/02/68    05/05/68     1      0      3      0     1.660
07/28/47    05/10/68        .       05/27/68     1      0      .      .     .
11/08/13    06/13/68        .       06/15/68     1      0      .      .     .
08/29/17    07/12/68    08/31/68    05/17/70     1      0      4      0     1.320
03/27/23    08/01/68        .       09/09/68     1      0      .      .     .
06/11/21    08/09/68        .       11/01/68     1      0      .      .     .
02/09/26    08/11/68    08/22/68    10/07/68     1      0      2      0     0.610
These data were read into the SAS System with the following DATA step. (Note: The OPTIONS statement preceding the DATA step corrects a Y2K problem in the data.)
options yearcutoff=1900;
data stan;
   infile 'c: stan.dat';
   input dob mmddyy9. doa mmddyy9. dot mmddyy9. dls mmddyy9.
         dead surg m1 m2 m3;
   surv1=dls-doa;
   surv2=dls-dot;
   ageaccpt=(doa-dob)/365.25;
   agetrans=(dot-dob)/365.25;
   wait=dot-doa;
   if dot=. then trans=0; else trans=1;
run;
Notice that the four date variables are read with the MMDDYY9. format, which translates the date into the number of days since January 1, 1960. (Dates earlier than that have negative values.) We then create two survival time variables, days from acceptance until death (SURV1) and days from transplant until death (SURV2). We also calculate the age (in years) at acceptance into the program (AGEACCPT), the age at transplant (AGETRANS), and the number of days from acceptance to transplant (WAIT). Finally, we create an indicator variable (TRANS) coded 1 for those who received a transplant and coded 0 for those who did not.
An obvious question is whether transplantation raised or lowered the hazard of death. A naive approach to answering this question is to do a Cox regression of SURV1 on transplant status (TRANS), controlling for AGEACCPT and SURG:
proc phreg data=stan;
   model surv1*dead(0)=trans surg ageaccpt;
run;
The results in Output 5.2 show very strong effects of both transplant status and age at acceptance. We see that each additional year of age at the time of acceptance into the program is associated with a 6 percent increase in the hazard of death. On the other hand, the hazard for those who received a transplant is only about 18 percent of the hazard for those who did not (see Risk Ratio column). Or equivalently (taking the reciprocal), those who did not receive transplants are about 5-1/2 times more likely to die at any given point in time.
Output 5.2. Results for All Patients, No Time-Dependent Variables
The PHREG Procedure

Data Set: WORK.STAN
Dependent Variable: SURV1
Censoring Variable: DEAD
Censoring Value(s): 0
Ties Handling: BRESLOW

                       Summary of the Number of
                       Event and Censored Values

                                                  Percent
                Total       Event    Censored    Censored

                  103          75          28       27.18

               Testing Global Null Hypothesis: BETA=0

              Without       With
Criterion   Covariates   Covariates   Model Chi-Square

-2 LOG L       596.651      551.188     45.463 with 3 DF (p=0.0001)
Score             .            .        52.047 with 3 DF (p=0.0001)
Wald              .            .        46.670 with 3 DF (p=0.0001)

               Analysis of Maximum Likelihood Estimates

                 Parameter   Standard    Wald       Pr >        Risk
  Variable DF     Estimate     Error  Chi-Square Chi-Square    Ratio

  TRANS     1    -1.708140    0.27860   37.59048     0.0001    0.181
  SURG      1    -0.421402    0.37100    1.29018     0.2560    0.656
AGEACCPT 1 0.058609 0.01505 15.16310 0.0001 1.060 |
While the age effect may be real, the transplant effect is almost surely an artifact. The main reason why patients did not get transplants is that they died before a suitable donor could be found. Thus, when we compare the death rates for those who did and did not get transplants, the rates are much higher for those who did not. In effect, the covariate is actually a consequence of the dependent variable: an early death prevents a patient from getting a transplant. The way around this problem is to treat transplant status as a time-dependent covariate, but that will have to wait until the section Time-Dependent Covariates, later in this chapter.
We can also ask a different set of questions that do not require any time-dependent covariates. Restricting the analysis to the 65 patients who did receive heart transplants, we can ask why some of these patients survived longer than others:
proc phreg data=stan;
   where trans=1;
   model surv2*dead(0)=surg m1 m2 m3 agetrans wait dot;
run;
Notice that we now use a different origin—the date of the transplant—in calculating survival time. (It is possible to use date of acceptance as the origin, using the methods in the section Left Truncation and Late Entry into the Risk Set (later in this chapter), but it is probably not worth the trouble.)
Output 5.3. Results for Transplant Patients, No Time-Dependent Covariates
                       Summary of the Number of
                       Event and Censored Values
                                                  Percent
                Total       Event    Censored    Censored

                   65          41          24       36.92

               Testing Global Null Hypothesis: BETA=0

              Without       With
Criterion   Covariates   Covariates   Model Chi-Square

-2 LOG L       290.896      274.311     16.586 with 7 DF (p=0.0203)
Score             .            .        15.924 with 7 DF (p=0.0258)
Wald              .            .        14.908 with 7 DF (p=0.0372)

               Analysis of Maximum Likelihood Estimates

                 Parameter   Standard    Wald       Pr >        Risk
  Variable DF     Estimate     Error  Chi-Square Chi-Square    Ratio

  SURG      1    -0.770306    0.49719    2.40042     0.1213    0.463
  M1        1    -0.248569    0.19437    1.63550     0.2009    0.780
  M2        1     0.029582    0.44268    0.00447     0.9467    1.030
  M3        1     0.644070    0.34276    3.53089     0.0602    1.904
  AGETRANS  1     0.049266    0.02282    4.66188     0.0308    1.050
  WAIT      1    -0.001969    0.00514    0.14691     0.7015    0.998
DOT 1 -0.000165 0.0002991 0.30440 0.5811 1.000 |
Results in Output 5.3 show, again, that older patients have higher risks of dying. Specifically, each additional year of age at the time of the transplant is associated with a 5 percent increase in the hazard of death. That does not tell us whether the surgery is riskier for older patients, however. It merely tells us that older patients are more likely to die. There is also some evidence of higher death rates for those who have a higher level of tissue mismatch, as measured by the M3 score. None of the other variables approaches statistical significance, however.
Partial Likelihood: Mathematical and Computational Details
Now that we’ve seen the partial likelihood method in action, let’s take a closer look at how it does what it does. Using the same notation as in Chapter 4, we have n independent individuals (i = 1,...,n). For each individual i, the data consist of three parts: ti, δi and xi, where ti is the time of the event or the time of censoring, δi is an indicator variable with a value of 1 if ti is uncensored or a value of 0 if ti is censored, and xi = [xi1 ... xik] is a vector of k covariate values.
An ordinary likelihood function is typically written as a product of the likelihoods for all the individuals in the sample. On the other hand, you can write the partial likelihood as a product of the likelihoods for all the events that are observed. Thus, if J is the number of events, we can write
Equation 5.4
![]()
where Lj is the likelihood for the jth event. Next we need to know how the individual Ljs are constructed. This is best explained by way of an example. Consider the data in Output 5.4, which is taken from Collett (1994) with a slight modification (the survival time for observation 8 is changed from 26 to 25 to eliminate ties). The variable SURV contains the survival time in months, beginning with the month of surgery, for 45 breast cancer patients. Twenty-six of the women died (DEAD=1) during the observation period, so there are 26 terms in the partial likelihood. The variable X has a value of 1 if the tumor had a positive marker for possible metastasis; otherwise, the variable has a value of 0. The cases are arranged in ascending order by survival time, which is convenient for constructing the partial likelihood.
Output 5.4. Survival Times for Breast Cancer Patients
OBS EVENT SURV DEAD X 1 1 5 1 1 2 2 8 1 1 3 3 10 1 1 4 4 13 1 1 5 5 18 1 1 6 6 23 1 0 7 7 24 1 1 8 8 25 1 1 9 9 26 1 1 10 10 31 1 1 11 11 35 1 1 12 12 40 1 1 13 13 41 1 1 14 14 47 1 0 15 15 48 1 1 16 16 50 1 1 17 17 59 1 1 18 18 61 1 1 19 19 68 1 1 20 20 69 1 0 21 . 70 0 0 22 21 71 1 1 23 . 71 0 0 24 . 76 0 1 25 . 100 0 0 26 . 101 0 0 27 . 105 0 1 28 . 107 0 1 29 . 109 0 1 30 22 113 1 1 31 . 116 0 1 32 23 118 1 1 33 24 143 1 1 34 25 148 1 0 35 . 154 0 1 36 . 162 0 1 37 26 181 1 0 38 . 188 0 1 39 . 198 0 0 40 . 208 0 0 41 . 212 0 0 42 . 212 0 1 43 . 217 0 1 44 . 224 0 0 45 . 225 0 1 |
The first death occurred to patient 1 in month 5. To construct the partial likelihood (L1) for this event, we ask the following question: Given that a death occurred in month 5, what is the probability that it happened to patient 1 rather than to one of the other patients? The answer is the hazard for patient 1 at month 5 divided by the sum of the hazards for all the patients who were at risk of death in that same month. Now, at month 5, all 45 patients were at risk of death, so the probability is
Equation 5.5
![]()
While this expression has considerable intuitive appeal, the derivation is actually rather involved and will not be presented here.
The second death occurred to patient 2 in month 8. Again we ask, given that a death occurred in month 8, what is the probability that it occurred to patient 2 rather than to one of the other patients at risk? Patient 1 is no longer at risk of death because she already died. So L2 has the same form as L1, but the hazard for patient 1 is removed from the denominator:
Equation 5.6
![]()
The set of all individuals who are at risk at a given point in time is often referred to as the risk set. At time 8, the risk set consists of patients 2 through 45, inclusive.
We continue in this way for each successive death, deleting from the denominator the hazards for all those who have already died. Also deleted from the denominator are those who have been censored at an earlier point in time. That’s because they are no longer at risk of an observed event. For example, the 21st death occurred to patient 22 in month 71. Patient 21 was censored at month 70, so her hazard does not appear in the denominator of L21. On the other hand, if an event time is the same as a censoring time, the convention is to assume that the censored observation was still at risk at that time. Thus, patient 23 who was censored in month 71 does show up in the denominator of L21.
The last term in the likelihood corresponds to the 26th death, which occurred to the 37th patient in month 181:
Equation 5.7
![]()
All the hazards in the denominator, except for the first, are for patients who were censored in months later than 181.
The results to this point have been completely general with no assumptions about the form of the hazard function. Now, we invoke the proportional hazards model of equation (5.1) and substitute the expression for the hazard into the expression for L1,
Equation 5.8
![]()
where xi is the value of x for the ith patient. This leads to a considerable simplification because the unspecified function λ0(5) is common to every term in the expression. Canceling, we get
Equation 5.9
![]()
It is this cancellation of the λs that makes it possible to estimate the β coefficients without having to specify the baseline hazard function. Of course, the λs also cancel for all the other terms in the partial likelihood.
Earlier I remarked that the partial likelihood depends only on the order of the event times, not on their exact values. You can easily see this by considering each of the Li terms. Although the first death occurred in month 5, L1 would be exactly the same if it had occurred at any time from 0 up to (but not including) 8, the month of the second event. Similarly, L2 would have been the same if the second death had occurred any time greater than 5 and less than 10 (the month of the third death).
A general expression for the partial likelihood for data with fixed covariates from a proportional hazards model is
Equation 5.10
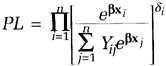
where Yij = 1 if tj ≥ ti; and Yij = 0 if tj < ti. (The Ys are just a convenient mechanism for excluding from the denominator those individuals who already experienced the event and are, thus, not part of the risk set). Although this expression has the product taken over all individuals rather than all events, the terms corresponding to censored observations are effectively excluded because δi =0 for those cases. This expression is not valid for tied event times, but it does allow for ties between one event time and one or more censoring times.
Once the partial likelihood is constructed, you can maximize it with respect to β just like an ordinary likelihood function. As usual, it’s convenient to maximize the logarithm of the likelihood, which is
Equation 5.11
![]()
Most partial likelihood programs use some version of the Newton-Raphson algorithm to maximize this function with respect to β. For details see Chapter 4 (in the section Maximum Likelihood Estimation: Mathematics).
As with PROC LIFEREG, there will occasionally be times when the Newton-Raphson algorithm does not converge. A message in the OUTPUT window will say WARNING: The information matrix is not positive definite and thus the convergence is questionable. Unfortunately, PROC PHREG’s convergence criterion sometimes makes it look as though the algorithm has converged when, in fact, true convergence is not possible. This problem arises when one of the explanatory variables is an indicator variable (1 or 0) and all the observations are censored for one of the levels of the variable. In such cases, the log-likelihood reaches a stable value, but the coefficient of the offending variable keeps going off toward plus or minus infinity. The only indication of a problem is that the variable in question will have a large coefficient with a much larger standard error.
To complete the breast cancer example, let’s take a look at the partial likelihood results in Output 5.5. With only one covariate, the Global Null Hypothesis statistics provide us with three alternative tests for the effect of that variable. The Wald and score tests have p-values that exceed the conventional .05 level, while the likelihood-ratio test is slightly below. This degree of discrepancy is not at all surprising with a small sample. The estimated risk ratio of 2.483 tells us that the hazard of death for those whose tumor had the positive marker was nearly 2-1/2 times the hazard for those without the positive marker.
Because the covariate is dichotomous, an alternative approach is to use PROC LIFETEST to test for differences in survival curves. When I did this, the p-value for the log-rank test (.0607) was identical to the p-value for the score test in Output 5.5. This is no accident. The log-rank test is the exact equivalent of the partial likelihood score test for a single, dichotomous covariate.
Output 5.5. PHREG Results for Breast Cancer Data
Testing Global Null Hypothesis: BETA=0

              Without       With
Criterion   Covariates   Covariates   Model Chi-Square

-2 LOG L       173.914      170.030      3.884 with 1 DF (p=0.0487)
Score             .            .         3.519 with 1 DF (p=0.0607)
Wald              .            .         3.296 with 1 DF (p=0.0695)

               Analysis of Maximum Likelihood Estimates

                 Parameter   Standard    Wald       Pr >        Risk
  Variable DF     Estimate     Error  Chi-Square Chi-Square    Ratio

X 1 0.909335 0.50090 3.29573 0.0695 2.483 |