
Chapter 5. Design for Sustainability: Economic, Environmental, and Social Indicators
5.1. Introduction
Engineers play an important role in global sustainable development by designing production systems for materials, minerals, chemicals, energy, electricity generation and distribution, transportation, buildings and other structures, and consumer products. These designs have impacts on the environment, economies, and societies at spatial scales that vary from local to global and at temporal scales that vary from minutes to decades. As engineers create designs, they not only evaluate their designs at multiple spatial and temporal scales, they also embed their designs in complex systems.
The field of transportation provides an illustration of the multiple layers of systems in which engineers create designs. Among the most visible products designed by engineers are automobiles. Engineers design engines, and improvements to the design of a fossil-fuel-powered engine for an automobile can increase fuel efficiency and reduce the environmental impacts of emissions associated with burning fuels, while simultaneously reducing the cost of operating the vehicle. The size, power, and fuel efficiency of the engine must be balanced with the weight of the vehicle, however, so changes in engine design must be considered within the entire vehicle system. Further reductions in emissions and operating costs might be possible by lowering the weight of the vehicle. The use of materials and fuels by automobiles are embedded in complex fuel and material supply systems. Developing systems to recycle the materials that make up the automobile at the end of its useful life might improve the environmental and economic performance of global material flows. Use of alternative power sources, such as biofuels or electricity, can impact global flows of fuels, which, in turn, might impact global flows of materials such as water. Finally, the design of cities that reduce the need for personal transportation could dramatically reduce the environmental impacts of transportation systems and would also transform social structures. These multiple layers of systems in which engineering design decisions are embedded are shown conceptually in Figure 5-1.
Figure 5-1. Engineering design for sustainability can consider a variety of system scales, as shown for the automobile: gate-to-gate (subsystem), cradle-to-grave (the automobile), interindustry/infrastructure, and extra-industry/societal. (From Graedel and Allenby, Industrial Ecology and the Automobile, Copyright 1998. Printed and electronically reproduced by permission of Pearson Education, Inc., Upper Saddle River, New Jersey)
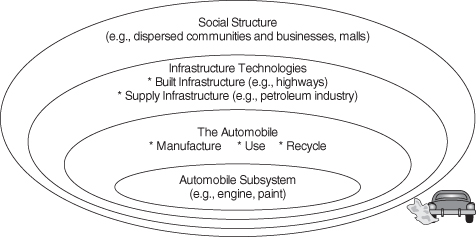
The point of this example is to illustrate that sustainable design of engineered systems will lead to consideration of multiple spatial and temporal scales and will require that the engineer interact with professionals with many different backgrounds both within and outside of engineering. These sustainable design challenges are complex, and the tools for addressing these problems are still emerging. This chapter will introduce the tools that are currently available, which are a combination of principles and quantitative analysis methods. The chapter begins with general principles of sustainable engineering design; the principles are illustrated with examples. Next, because sustainable designs must be able to compete in the marketplace, quantitative methods for evaluating, and in some cases monetizing, environmental externalities will be discussed. The use of other, nonmonetized environmental indicators for evaluating process technologies and product alternatives will also be described. Indicators of social impact for engineering design are only at the initial stage of development, yet some prototype methods have been proposed and used, and an introduction to this emerging area will be presented.
5.2. Sustainable Engineering Design Principles
Starting from the introduction of sustainability development concepts in the “Brundtland Report” (WCED, 1987), there have been many attempts to incorporate sustainability principles into engineering design. For example, the “Hannover Principles” express the view that human systems must be designed to coexist with natural systems, renewable resources should be used, safe and long-lived products are desired, and elimination of waste is a priority (McDonough and Braungart, 1992). The Augsburg Materials Declaration (2002)1 identifies eight factors that must be considered to achieve sustainable production, including integration of environmentally benign design, materials, and manufacturing over all stages of the life cycle; optimization and exploitation of raw materials and natural resources; energy-efficient production technologies and product distribution; regenerative energy sources; and durability, recyclability, and closed loops. The “12 Principles of Green Engineering” (Anastas and Zimmerman, 2003) include design to be inherently safe and benign, design for recycle or a commercial afterlife, energy and mass efficiency, and integration with existing energy and material flows. The Sandestin Green Engineering Principles, developed as an outcome of a multidisciplinary engineering conference, emphasize the need for holistic thinking and the use of environmental impact and integrative analysis tools such as life-cycle assessment (Abraham and Nguyen, 2003; Shonnard et al. 2007). The Sandestin Green Engineering Principles (also referred to as “Sustainable Engineering Principles”; Abraham, 2006) were developed based on a starting list of principles compiled from a literature review of available sustainability or green-related principles and declaratory statements, including the Hannover Principles, CERES,2 the Augsburg Materials Declaration, the Twelve Principles of Green Chemistry, Ahwahnee Principles,3 and Earth Charter Principles.4 These sustainability concepts and engineering design principles can be summarized in this statement: The goal of sustainable engineering design is to create products that meet the needs of today in an equitable fashion while maintaining healthy ecosystems and without compromising the ability of future generations to meet their resource needs.
The Sandestin Sustainable Engineering Principles and the 12 Principles of Green Engineering are illustrative of the multiple sets of principles available. They capture similar, but also complementary, elements of sustainability and engineering design, and therefore these two sets of principles will be described in more detail. Here are the Sandestin Green Engineering Principles (Sustainable Engineering Principles) (Abraham and Nguyen, 2003; Shonnard et al., 2007):
Principle 1: Engineer processes and products holistically, use system analysis, and integrate environmental impact assessment tools. These concepts resonate in a number of Green and Sustainable Engineering principles and are addressed at length in various textbooks, including Green Engineering: Environmentally Conscious Design of Chemical Processess by the authors (Allen and Shonnard). The principle points out the importance of systematic evaluation and reduction of human health and environmental impacts of designs, products, technologies, processes, and systems. The use of system-based techniques such as heat and mass integration techniques is essential to minimize human health and environmental impacts of designs through material and energy optimization. The principle also conveys the importance of not shifting risk (e.g., reducing releases to one environmental medium may increase risk to another medium and/or increase the likelihood of worker exposures and jeopardize worker safety (Shonnard et al. 2007; Abraham, 2006). A well-known example of the consequences of shifting risk is the use of methyl-tert butyl ether (MTBE) as a gasoline additive. MTBE was added to gasoline to reduce emissions of carbon monoxide from automobile tailpipes, thereby protecting human health. Its greater mobility in soil and water environments, however, meant that spills of MTBE could more readily migrate to and disperse in water supplies than spills of gasoline (for more details see www.epa.gov/otaq/consumer/fuels/oxypanel/blueribb.htm).
Principle 2: Conserve and improve natural ecosystems while protecting human health and well-being. This principle expresses the importance of understanding environmental processes for engineers involved in design of chemicals, automobiles, buildings, and other manufactured goods. There are many examples where a lack of understanding caused severe environmental harm and raised the level of health risk to humans and other forms of life. For example, chlorofluorocarbons (CFCs) were thought to be ideal refrigerants. They replaced dangerous refrigerant fluids like ammonia and made storage of food and building climate control far safer. Their benefits to human health and well-being were clear; however, once the role of CFCs in stratospheric ozone destruction chemistry was worked out, it became clear that there were hazards to human health associated with CFC use. Not every engineer needs to be an expert in environmental processes and health effects, but designers should be aware of the potential harm that can be caused and work with multidisciplinary experts to achieve more sustainable solutions.
Principle 3: Use life-cycle thinking in all engineering activities. This principle complements Principle 1. Every engineered product is created, functions over a useful life, and is eventually disposed of to the environment. Life-cycle thinking can help avoid a narrow outlook on environmental, social, and economic concerns and help make informed decisions. Life-cycle thinking that gets incorporated into design will help identify design alternatives that minimize environmental impacts at the various life stages. This same kind of thinking can also consider economic and societal aspects. The importance of life-cycle thinking can be illustrated (see Chapter 6) through the case study of the greenhouse gas emissions associated with biofuels.
Principle 4: Ensure that all material and energy inputs and outputs are as inherently safe and benign as possible. This principle complements Principle 3. These characteristics of materials and chemicals must be applied to all stages of a product’s life, from extraction to use and disposal. The following are some questions that must be asked in each stage of the life cycle: Are the materials toxic? Are there inherently benign (in terms of toxicity) materials that can be used as substitutes? Will exposure during manufacturing be a health problem to workers? Does the product pose minimal impact during recycle and disposal? Will an unintentional release of material quickly degrade in the environment? Properties of materials relevant to safety, beyond toxicity, must also be considered, such as flammability, explosivity, and corrosivity. Chapter 4 provides a number of examples of the selection of materials, based on their environmental and functional properties.
Principle 5: Minimize depletion of natural resources. As the world’s population continues to grow and becomes more affluent, natural resources will be used at ever greater rates, and the importance of this principle is raised. An overview of materials, energy, and water use is provided in Chapter 1 of this text. Efficient use of nonrenewable energy resources is of primary interest, and development of renewable alternatives for energy and materials should be given a high priority in engineering design.
Principle 6: Strive to prevent waste. Waste not only represents material that takes up space in landfills but more important represents a loss of efficiency in a production system that includes many input materials and energy sources. When waste is avoided through design, the environmental impacts associated with the input materials and the energy that went into producing the discarded product are also avoided. The following are some questions that must be asked during design: Are there ways (e.g., procedures, engineering) to improve the yield or efficiency of raw materials? How can the releases or wastes be recycled and reused? Can the product be reused after its normal commercial life, hence minimizing the raw materials needed to manufacture new products? Methods for minimizing wastes, particularly in chemical processes, are discussed at length in various textbooks, including Green Engineering: Environmentally Conscious Design of Chemical Processes (Allen and Shonnard).
Principle 7: Develop and apply engineering solutions, while being cognizant of local geography, aspirations, and cultures. Engineering designs are directed toward meeting individual human and societal needs, and in order to better achieve this goal, awareness of the societal context of the design is crucial. An engineering design in one society, such as rapid public transportation systems, may not meet the aspirations and needs in another society, even though the design achieves environmental objectives. The main point is to move each society, through engineering design, toward more sustainable utilization of resources in a way that achieves that society’s or individual’s aspirations.
Principle 8: Create engineering solutions beyond current or dominant technologies; improve, innovate, and invent (technologies) to achieve sustainability. Sustainability can be a powerful motivation for change in engineering designs, technologies, processes, and products. This principle emphasizes the importance of being innovative (i.e., “outside-the-box” thinking) in the development of new technologies. The knowledge gained through considering the many dimensions of sustainability should be reflected in how engineering designs accomplish societal objectives.
Principle 9: Actively engage communities and stakeholders in development of engineering solutions. There are many examples of stakeholder and community engagement in the development of engineered solutions in a wide range of activities, including city planning, infrastructure development, and production of manufactured goods. One illustrative example is in the mining industry where Seven Questions to Sustainability from the Mining Minerals Sustainable Development North America project (IISD, 2002) has been adopted by key members of this industry. Central to these mining project questions is community engagement from project inception to mine closure. During this engagement, the communities surrounding the proposed mine development express their wishes with regard to managing the economic development and any concerns over local environmental consequences.
A second set of engineering design principles, the 12 Principles of Green Engineering, from Anastas and Zimmerman (2003), is presented here. Each of these principles will be elaborated on in the following pages.
Principle 1: Designers need to strive to ensure that all material and energy inputs and outputs are as inherently nonhazardous as possible. This principle recognizes that significant costs and hazards result from the selection of sources of materials and energy. Additional control systems are required to capture and destroy hazardous materials during production, use, and disposal, all of which add to the cost of the design. If inputs to the system are inherently less hazardous, the risks of failure will be reduced and the amount of resources expended on control, monitoring, and containment will be less.
Principle 2: It is better to prevent waste than to treat or clean up waste after it is formed. The creation of waste in engineered systems adds to the complexity, effort, and expense of the design. This is especially true for hazardous wastes, which require extraordinary measures for their control, monitoring, transport, and disposal. To reduce waste generation, the design must strive to incorporate as much of the input materials as possible into final products. This strategy can be applied at many scales, for example, at the molecular level in the design of chemical reactions, at larger scales such as in machining of parts, and further in assembly of discrete parts. Any waste that is generated should be considered as raw material to be used again in the current product system or as input to a separate product system.
Principle 3: Separation and purification operations should be designed to minimize energy consumption and materials use. In the chemical and mineral-processing industries, large-scale separation processes are among the largest energy-consuming units and generate a significant proportion of emissions and wastes. Even in industry sectors where the mass of the products produced is not large, separation processes can be significant. In electronics manufacturing, the generation of ultra-pure water and the creation of ultra-clean work environments require separation processes with significant costs and energy demands. Design for efficient separation is very important for these industries, and several approaches can be investigated during design. Gains in energy efficiency can be attempted through heat integration by considering all streams needing to gain or lose energy in the process and also outside the process if in close proximity to other facilities. Similarly, pollution can be prevented by considering mass integration, taking waste streams from one process and using them as raw materials for another. In certain instances products can be induced to self-separate by adjusting conditions to take advantage of physical and chemical properties of the chemicals. As another example, in mechanical systems, reversible fasteners can be used to encourage the disassembly of manufactured parts at the end of life.
Principle 4: Products, processes, and systems should be designed to maximize mass, energy, space, and time efficiency. Energy and mass efficiency were dealt with in Principle 3, so this discussion will focus on space and time efficiency. Space and time are interrelated in many engineered systems, but most obviously in transport of raw material and products. Reducing the distance between points of use for materials can save time and reduce pollution. Close proximity can facilitate exchanges of waste heat and materials in highly integrated production systems. Colocation of manufacturing and recycle facilities can also lead to efficiency gains in many production systems. Industrial parks near residential areas can lead to sharing of excess heat with communities. However, these proximity opportunities that take advantage of space and time factors also must consider safety concerns due to potential exposure to emissions and industrial accidents. The excess time that a product sits in inventory can run up against storage stability limits and could lead to excess waste generation.
Principle 5: Products, processes, and systems should be “output pulled” rather than “input pushed” through the use of energy and materials. It is well known that some chemical reactions can be “pulled” to completion by removing certain co-products from the reaction mixture. This chemical phenomenon, which is termed Le Châtelier’s principle, can be applied to engineering design across scales of production. “Just-in-time” manufacturing is an example of this principle where only the necessary units are produced in the necessary quantities at the necessary time by bringing production rates exactly in line with demand. Planning manufacturing systems for final output eliminates the wastes associated with overproduction, waiting time, processing, inventory, and resource inputs.
Principle 6: Embedded entropy and complexity must be viewed as an investment when making design choices on recycle, reuse, or beneficial disposition. Entropy and complexity are related concepts when considering engineered systems. Products having a high degree of order and structure are at a low state of entropy. The higher the degree of complexity and structure in a product, the greater is the amount of energy invested to create such structure and complexity. When considering end-of-life options for products, the degree of complexity and structure should point the way to proper reuse, recycle, and remanufacturing options. Highly complex parts should be reused if at all possible in order to avoid the investment required to create a replacement part from virgin (newly extracted from nature) resources.
Principle 7: Targeted durability, not immortality, should be a design goal. Many products last much longer than the expected commercial life. There can be multiple impacts from this extended durability. For example, buildings with inefficient energy systems, designed when energy was relatively inexpensive, may become inoperable in times of expensive energy. At a different scale, the challenge in the design of molecules and of manufactured parts is to create products that are durable yet do not persist indefinitely in the environment. Durability means that the products last for the intended commercial life and are thereafter readily reconfigured or degraded at the end of life into harmless substances that assimilate easily into natural cycles.
Principle 8: Design for unnecessary capacity or capability (e.g., “one size fits all”) solutions should be considered a design flaw. Most products are overdesigned to cover a wide application range and settings. Automobiles must be designed to function not only in warm temperatures but also in extremes of cold. However, there are instances where design for “one size fits all” does not make the most sense and is potentially wasteful. For example, a jacket could be designed for the coldest possible climate, but this garment would not be much use for a stroll along the beach on a breezy evening in Florida in the winter. Likewise, lighting of a large classroom, office space, or a room at home with a single light switch would not make as much sense if only one person were in the room at a given time. In such a case, district lighting would save on energy when only one or a few occupants are present in a large space.
Principle 9: Material diversity in multicomponent products should be minimized to promote disassembly and value retention. This design principle has elements in common with Principle 6. Increasing material diversity in products has the effect of making recycling more difficult and expensive because the number of recycling options and their complexity increase as material diversity increases. Different kinds of materials and the use of different additives have a strong influence on recycling methods and costs.
Principle 10: Design of products, processes, and systems must include integration and interconnectivity with available energy and materials flows. This design principle states that products, processes, and entire engineered systems should be designed to use the existing infrastructure of energy and material flows. Integration with existing infrastructure can occur at the scale of a unit operation, production line, manufacturing facility, or industrial park. Taking advantage of existing energy and material flows will minimize the need to generate energy and/or acquire and process raw materials. Applications of this principle include the recovery and use of heat from exothermic chemical reactions, the cogeneration of heat and power, and the recovery of electrical energy by regenerative braking in hybrid vehicles.
Principle 11: Products, processes, and systems should be designed for performance in a commercial “afterlife.” Designing components for a second, third, or even longer life is an important strategy in product design. When components are recovered and reused in next-generation products, the environmental impacts of raw material acquisition from virgin resources and conversion are eliminated, and the overall life-cycle environmental impacts are reduced. This strategy is especially important for products that become obsolete prior to component failure, such as cell phones and other electronic devices. Important examples of this principle also include the recovery and recycle of spent copy toner cartridges, the renovation of industrial buildings for housing, and reuse of beverage containers as practiced in Germany, where bottles are more substantial in their construction to allow for collection, washing, sterilization, refilling, and relabeling.
Principle 12: Material and energy inputs should be renewable rather than depleting. The use of nonrenewable raw materials from nature in the design of engineered systems moves the Earth system incrementally toward depletion of finite resources and is therefore unsustainable by definition. All renewable resources derive their usefulness and energy from the sun, and as a result these system inputs can be sustainable, if used at a level consistent with their rate of renewal, for the foreseeable future. Biomass is an important form of renewable resources in that it can serve as not only an energy source but also as a feedstock for design of material products. One important form of a biomass product is liquid transportation fuels. Biofuels are renewable on relatively short timescales, and the cycling of biofuel carbon between the atmosphere, biomass/biofuel, and back to the atmosphere again is readily integrated into natural cycles in a way that might not cause accumulation of CO2 in the atmosphere (see Chapter 6). An offshoot of this principle is the importance of design for products and systems that integrate well with natural cycles of elements across the life cycle, from raw material acquisition to end-of-life processes.
These engineering design principles, in addition to the others mentioned in the beginning of this section, establish a framework for designing more sustainable products and processes. At first, changes in engineering design are likely to be improvements to inherently unsustainable products and systems, but over time it is hoped that these design principles will move industry and consumers toward inherently sustainable products and production systems. However, there will be tensions in applying these principles. What if making a process inherently safer requires more energy? What if minimizing water use requires more energy? Engineers are accustomed to addressing trade-offs between objectives, but methods for doing so require measures of performance. In most engineering designs the measure is cost. In delivering a specified level of performance of a product, technology, or service, the goal is to minimize cost. This suggests that one mechanism for incorporating objectives related to sustainability into engineering design is to monetize them. Therefore, the next section of this chapter will examine methods for monetizing environmental impacts. Some indicators of environmental and societal performance will be difficult, or arguably impossible, to monetize. In these cases other approaches will be needed for incorporating objectives into engineering design, and some of these approaches are described in the concluding sections of this chapter.
5.3. Economic Performance Indicators
Costs associated with poor environmental and societal performance can be very large. Waste disposal fees, permitting costs, and liability costs can all be substantial. Wasted raw material, wasted energy, and reduced manufacturing throughput are also consequences of wastes and emissions. Corporate image and relationships with workers and communities can suffer if performance is substandard. But how can these costs be quantified?
This section will review the tools available for estimating environmental and societal costs and benefits. These include traditional concepts such as the time value of money, present value, payback period, internal rate of return, and other financial evaluation calculations. Nontraditional tools include methods for monetizing environmental costs that are hidden from normal accounting procedures. We will also touch upon less tangible costs and benefits that can still be monetized.
In general, traditional accounting practices have acted as a barrier to implementation of sustainable engineering projects because they hide the costs of poor environmental and societal performance. Many organizations are now giving more consideration to all significant sources of environmental and societal costs. The principle is that if costs are properly accounted for, management practices that foster good economic and societal performance will also foster superior environmental and societal performance.
5.3.1. Definitions
To keep the discussion presented in this chapter clear, it is useful to define a number of terms, as they will be used in this text. Many of these definitions are drawn from an introduction to environmental accounting prepared by the U.S. Environmental Protection Agency (U.S. EPA, 1995).
Internal costs, or private costs, are costs that are borne by a facility. Costs for materials and labor are examples of internal costs. External costs, or societal costs, on the other hand, are the costs to society of the facility’s activities. The cost associated with a loss of fishable waters due to pollutants discharged by a facility to a stream is an example of an external cost. Often, environmental fees, regulations, and requirements act to internalize what would have otherwise been an external cost, so that a facility that produces waste must pay to reduce its quantity or toxicity or pay a premium for its disposal. This chapter focuses primarily on internal costs.
A typical management accounting system for a manufacturer would include categories for direct materials and labor (costs that are clearly and exclusively associated with a product or service), manufacturing overhead, sales, general and administrative overhead, and research and development. Environmental and societal expenses can be hidden in any or all of these categories but are charged most often as overhead. Overhead costs, as opposed to costs of direct materials and labor for production, are often referred to as indirect costs and consist of any costs that the accounting system either pools facility-wide and does not allocate among activities or allocates on the basis of a formula. Overhead generally includes indirect materials and labor, capital depreciation, rent, property taxes, insurance, supplies, utilities, and repair and maintenance. It can also include labor costs ranging from supervisor salaries to janitorial services. Often, even the direct environmental costs that could be assigned to a particular process, product, or activity, such as waste disposal, are lumped together facility-wide. This is often done because of practices such as using a single waste disposal company to manage all of a facility’s waste. Other environmental costs, such as the costs of filling out forms for reporting waste management practices, are also hidden in the overhead category. Because environmental and societal costs are not traditionally allocated to the activity that is generating wastes, some of the benefits of green engineering projects are masked.
Full-cost accounting is a type of managerial accounting in which as many costs as possible are allocated to products, product lines, processes, services, or activities. Full-cost accounting is pursued because it is useful in determining the profitability of processes and products and in setting prices. Even though full-cost accounting does not focus particularly on environmental and societal costs, it promotes improved performance because the costs of producing waste and societal impacts for individual processes or products are revealed, providing management with a better idea of true costs.
Activity-based costing is similar to full-cost accounting except that the costs are allocated to specific measures of activity. For example, in activity-based costing, the cost of generating a particular kind of waste per pound of production might be measured. Another example would be determining the cost of chemical inputs per item for painting.
These are the primary terms that will be used in this section. It is useful to keep in mind that precise definitions remain in flux and vary from organization to organization, so the terminology used in this chapter is not universal. Nevertheless, it is generally recognized that in environmental and societal cost accounting, words like full (e.g., full-cost accounting), total (e.g., total cost assessment), true, and life cycle (e.g., life-cycle costing) are used to indicate that not all costs are captured in traditional accounting and capital budgeting practices.
5.3.2. Estimates of Environmental Costs
The definitions in the previous section made clear that not all environmental costs are captured in traditional accounting and capital budgeting practices. Nevertheless, some measures of environmental and societal costs are available, providing a rough indication of the magnitude of costs and the variation of those costs among industry sectors.
Among the easiest environmental costs to track are the costs associated with treating emissions and disposing of wastes. Direct costs of pollution abatement are tracked by the U.S. Census Bureau and have been increasing steadily. Expenditures in 1972 totaled $52 billion (in 1990 dollars) and were projected to grow to approximately $140 billion (1990 dollars), or 2.0% to 2.2% of gross national product, in the year 2000 (for a review and analysis of these data, see U.S. Congress, Office of Technology Assessment, 1994).
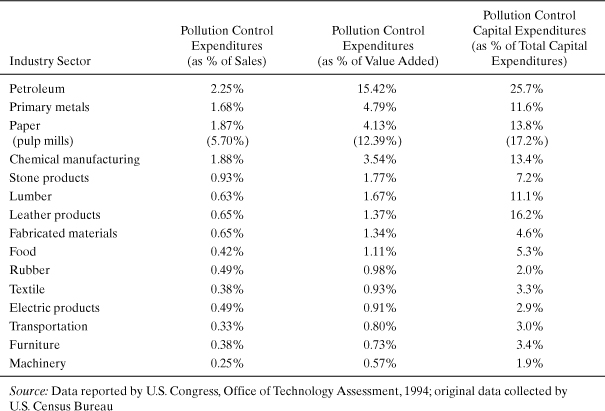
These expenditures are not distributed uniformly among industry sectors. As shown in Table 5-1, sectors such as petroleum refining and chemical manufacturing spend much higher fractions of their net sales and capital expenditures on pollution abatement than do other industrial sectors. Therefore, in these industrial sectors, minimizing costs by preventing wastes and emissions will be far more strategic an issue than in other sectors.
Table 5-1. Pollution Abatement Expenditures by U.S. Manufacturing Industries
Example 5-1. Potential pollution control costs for greenhouse gases
Estimate control costs for greenhouse gases for an electricity-generating unit (EGU or power plant) as a percentage of sales revenues. Assume that (1) the EGU uses coal as a fuel and converts the heat of combustion of coal into electricity with 35% efficiency, (2) the heating value of coal is 10,000 BTU/lb, (3) coal is 85% carbon, (4) carbon costs $20 per ton to capture and sequester, and (5) electricity can be sold for $0.10 per kilowatt-hour.
Solution: Electricity generated per ton of carbon:
1 ton coal/0.85 ton C * 2000 lb/ton * 10,000 BTU/lb coal * 1 kWh/3412 BTU * 0.35 = 2415 kWh/ton C
The control costs are $20 for 2415 kWhr of generation.
This much generation leads to $241 in electricity sales, so the control costs are about 8% of sales.
Pollution abatement costs reported by individual companies both reflect these general trends and provide more detail about the magnitude and the distribution of environmental expenditures. For example, Tables 5-2 and 5-3 show the distribution of environmental costs reported by the Amoco Yorktown refinery and DuPont’s LaPorte chemical manufacturing facility (Heller et al., 1995; Shields et al., 1995). In the case of the Amoco refinery, only about a quarter of the quantified environmental costs are associated with waste treatment and disposal; the costs are summarized in Table 5-1. Costs associated with removing sulfur from fuels, meeting other environmentally based fuel requirements, and maintaining environmental equipment were greater than the costs associated with waste treatment and disposal. This indicates that the magnitude of environmental costs is substantially greater than that reported in Table 5-1, and that these costs may be hard to identify.
Table 5-2. Summary of Environmental Costs at the Amoco Yorktown Refinery
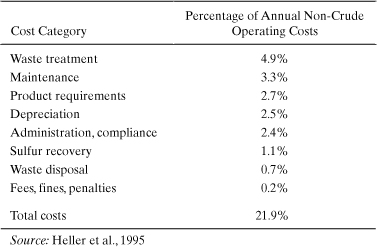
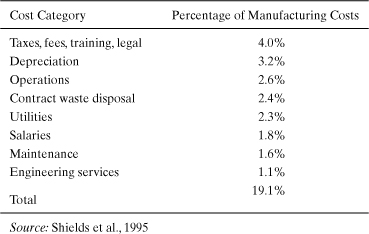
Table 5-3 shows that the profile of environmental costs at a DuPont chemical manufacturing facility exhibits many of the same characteristics. Waste treatment and disposal costs are less than a quarter of the annual, quantifiable, environmental costs.
Table 5-3. Summary of Environmental Costs at the DuPont LaPorte Chemical Manufacturing Facility
Taken together, Tables 5-1 to 5-3 demonstrate that environmental costs are substantial but that quantifying these costs will be challenging. The next several sections of this chapter will present a framework and procedures for estimating these costs.
5.3.3. A Framework for Evaluating Environmental Costs
Engineering projects are generally not undertaken unless they are financially justifiable, and projects designed to improve environmental and societal performance beyond regulatory requirements usually must compete financially with all other projects under consideration at a facility. Fortunately, projects resulting in improved environmental and societal performance are frequently profitable. However, the potential profitability of environmental and societal projects is difficult to assess, and it is common for many of the financial benefits of improved environmental and societal performance to be neglected when projects are analyzed. That is why a better understanding of methods for estimating these costs and benefits serves to promote sustainable engineering.
In this section, the types and magnitudes of costs associated with emissions, waste generation, and societal impacts are described and categorized. Five categories, or tiers, of costs will be considered, following the framework recommended in the Total Cost Assessment Methodology developed by the American Institute of Chemical Engineers’ Center for Waste Reduction Technologies (AIChE CWRT, 2000). These are
• Tier I: Costs normally captured by engineering economic evaluations
• Tier II: Administrative and regulatory environmental costs not normally assigned to individual projects
• Tier III: Liability costs
• Tier IV: Costs and benefits, internal to a company, associated with improved environmental and societal performance
• Tier V: Costs and benefits, external to a company, associated with improved environmental and societal performance
Tier I costs are the types of costs quantified in traditional economic analyses. Here are some specific examples:
Costs Traditionally Evaluated in Financial Analyses
• Capital equipment
• Materials
• Labor
• Utilities
• Structures
• Salvage value
As discussed, traditional accounting systems that focus on Tier I costs fail to capture some types of environmental costs. Here are examples of some of the costs that are frequently overlooked by traditional methods:
Environmental Costs Often Charged to Overhead
• Off-site waste management charges
• Waste treatment equipment
• Waste treatment operating expenses
• Filing for permits
• Taking samples
• Filling out sample reporting forms
• Conducting waste and emission inventories
• Filling out hazardous waste manifests
• Inspecting hazardous waste storage areas and keeping logs
• Making and updating emergency response plans
• Sampling storm water
• Making chemical usage reports (some states)
• Reporting on pollution prevention plans and activities (some states)
These costs are generally charged to overhead and therefore may be “hidden” when project costs are evaluated. These will be referred to as Tier II or hidden costs. Note that these costs are actually borne by facilities regardless of whether facilities choose to quantify them or assign them to project or product lines.
A less tangible set of costs are those designated as Tier III—liability costs. An accounting definition of liability is a “probable future sacrifice of economic benefits arising from present obligations to transfer assets or provide services in the future” (Financial Accounting Standards, 1985; Institute of Management, 1990). Liability costs could include
• Compliance obligations
• Remediation obligations
• Fines and penalties
• Obligations to compensate private parties for personal injury, property damage, and economic loss
• Punitive damages
• Natural resource damages
A final set of costs are designated as Tier IV or Tier V, which can be referred to as image, relationship, or societal costs (AIChE CWRT, 2000). These costs arise in relationships with customers, investors, insurers, suppliers, lenders, employees, regulators, and communities. They are perhaps the most difficult to quantify.
Thus, a basic framework for estimating costs and benefits associated with environmental activities consists of five tiers, beginning with the most tangible costs and extending to the least quantifiable costs. A more thorough treatment of environmental cost accounting is given in Allen and Shonnard (2012), and the interested reader is referred to that text for calculation methods.
5.4. Environmental Performance Indicators
Sustainable engineering design principles were discussed in Section 5.2, and these principles stand as guidelines for engineers to create more sustainable processes and products. But in order to fully use these principles in design, indicators of environmental performance are needed to quantify the impacts and compare impacts to conventional technologies, processes, and products. This approach to environmental management is based on the principle that “anything that can be measured can be improved.” The purpose of this section is to introduce environmental performance measures that have been used in engineering design and product development.
Chapter 2 introduced concepts of risk assessment and included applications to human health and to product life-cycle assessment. In both of these applications, a methodology was used that first defined a system to evaluate, estimated environmental releases, determined exposure to sensitive human and environmental receptors, and calculated damage to human health or impacts to the environment. We will further develop those approaches in this section.
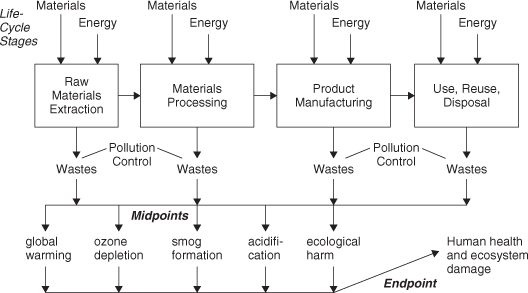
In proceeding further it is most convenient to discuss environmental indicators in the context of a product life-cycle assessment. The ideas to be presented can also be applied to the evaluation of a process or any human activity that takes resources from nature and emits by-products back to nature. Consider Figure 5-2, which describes a generic product system in which raw materials are converted to chemical intermediates and then to a final product, which is then used and disposed of or reused. An inventory of material and energy inputs is developed at each stage, and an accounting of output wastes is also included. Wastes that are not captured in pollution control devices reach the environment, causing a number of midpoint damage effects to the environment itself, such as warming the climate or destroying ozone in the stratosphere. A series of other environmental processes are involved in transforming midpoint effects to endpoint damage to humans and ecosystems. These endpoint damages can cause shortening of human life expectancy or loss of plant or animal species from ecosystems.
Figure 5-2. A generic product life cycle showing key stages in a product system, key inputs and wastes, effects of emitted wastes on midpoint damages in the environment, and endpoint damage to humans and ecosystems
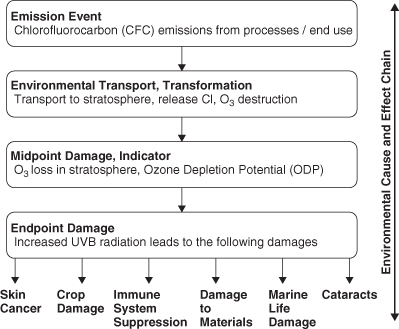
The differences between midpoint and endpoint indicators of environmental impact are further illustrated in Figure 5-3, which shows the environmental mechanisms starting with emissions, moving to midpoint effects, and ultimately to a number of endpoint damages. Both midpoint and endpoint impact indicators have advantages and limitations. Midpoint indicators are closer to emissions in the environmental cause-and-effect chain, are easier to model, have less uncertainty, but are less relevant to decision makers who may not understand the true endpoint effects. Endpoint indicators are farther down the environmental cause-and-effect chain, are more difficult to model, have a higher degree of uncertainty, but are more relevant to decision makers. It is often desirable to present both types of indicators when evaluating engineering designs (Bare et al., 2000). In this section, we will focus on midpoint indicators of environmental impacts and refer the interested reader to other publications describing endpoint damage methods (Bare et al., 2000; Goedkoop and Spriensma, 1999).
Figure 5-3. Environmental mechanisms involved in conversion of emissions of CFCs and halons into midpoint and endpoint damages (Adapted from Bare et al., 2003)
5.4.1. Life-Cycle Impact Assessment
The emissions and wastes from a product life cycle constitute the “inventory” upon which environmental impact indicators are based. Beyond the inventory of emissions, lists of raw materials and primary energy sources are added, as well as other categories such as land use, but these categories beyond emissions will be set aside for this section. Life-cycle inventories do not by themselves characterize the environmental performance of a product, process, or service. This is because overall quantities of wastes and emissions as well as raw material and energy requirements must be considered in conjunction with their potency of effect on the environment. Simply stated, a pound of lead emitted to the atmosphere has a different environmental impact from a pound of iron emitted to surface waters. To develop an overall characterization of the environmental performance of a product or process, throughout its life cycle, requires that life-cycle inventory data be converted into estimates of environmental impact.
The process of producing life-cycle impact assessments is generally divided into three major steps (Fava et al., 1992). They are
• Classification, where inputs and outputs determined during the inventory process are classified into environmental impact categories; for example, methane, carbon dioxide, and CFCs would be classified as global warming gases.
• Characterization, where the potency of effect of the inputs and outputs on their environmental impact categories is determined; for example, the relative global warming potentials (Table A5-1) of methane, carbon dioxide, and CFCs would be identified in this step.
• Valuation, where the relative importance of each environmental impact category is assessed, so that a single index for environmental performance can be calculated. This subject is covered in other texts (see Allen and Shonnard, 2012) and will not be covered here.
Note that the classification and characterization steps are generally based on scientific data or models. The data may be incomplete or uncertain, but the process of classification and characterization is generally objective. In contrast, the valuation step is inherently subjective and depends on the value that decision makers in society place on various environmental impact categories.
Each of the three steps is discussed in more detail in the following sections.
Classification
As a first step in life-cycle impact assessment, inputs and outputs that were the subject of the inventory are classified into environmental impact categories, such as the following:
• Global warming
• Stratospheric ozone depletion
• Photochemical smog formation
• Human carcinogenicity
• Atmospheric acidification
• Aquatic toxicity
• Terrestrial toxicity
• Habitat destruction
• Depletion of nonrenewable resources
• Eutrophication
Note that some impact categories might apply to very local phenomena (for example, aquatic toxicity to organisms found only in certain ecosystems), while other impact categories are global (for example, stratospheric ozone depletion and global warming).
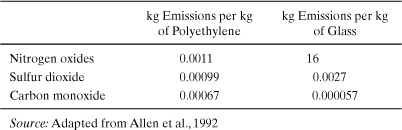
As an example of classification, consider the list of air emissions inventoried for a study that compared glass and polyethylene, which is given in Table 5-4. Carbon monoxide emissions are higher for polyethylene than for glass on a mass basis, while emissions of nitrogen oxides are higher for glass than for polyethylene. Nitrogen oxide emissions would be classified as photochemical smog precursors, global warming gases, and acid precipitation and acid deposition precursors. Carbon monoxide emissions, on the other hand, would be classified as a smog precursor.
Table 5-4. Selected Air Emissions from the Production of 1 kg of Polyethylene and 1 kg of Glass
Characterization
The second step of impact assessment, characterization, generally consists of assigning relative weights or potencies to different types of emissions, energy use, and materials use. These potencies reflect the degree to which the inventory elements contribute to environmental impacts. For example, if the impact category is global warming, then relative global warming potentials can be used to weight the relative impact of emissions of different global warming gases. Once these potency factors are established, the inventory values for inputs and outputs are combined with the potency factors to arrive at impact scores.
Although no single methodology has gained universal acceptance, several useful methodologies for indexing environmental and health impacts of chemicals have recently appeared in the literature. Many of the indexing methods include metrics for abiotic as well as biotic impacts. In the abiotic category, global warming, stratospheric ozone depletion, acidification, eutrophication, and smog formation are often included. In the biotic category, human health and plant, animal, and other organism health are impacts of concern. For issues of environmental and economic sustainability, resource depletion indexes reflect long-term needs for raw materials utilization. A review of several of these methodologies would indicate that many environmental indicators (indexes) have been constructed by employing separate parameters for the inherent impact potential (IIP) and exposure potential (EP) of an emitted chemical. The index is normally expressed as a product of inherent impact and exposure, following risk assessment guidelines (NRC, 1983; Heijungs et al., 1992; SETAC, 1993).
The general form of a dimensionless environmental risk index (indicator) is defined as
where B stands for the benchmark compound and i the chemical of interest. To estimate the indicator I for a particular impact category due to all of the chemicals released from a product system, we must sum the contributions for each chemical weighed by their emission rate:
The following is a brief summary of environmental and health indexes that have been used to compare impacts of chemicals, processes, or products.
Global Warming. A common index for global warming is the global warming potential (GWP), which is the time-integrated climate forcing from the release of 1 kg of a greenhouse gas relative to that from 1 kg of carbon dioxide (IPCC, 2007):

where ai is the predicted radiative forcing of gas i (Wm-2) (which is a function of the chemical’s infrared absorbance properties and Ci), Ci is its predicted concentration in the atmosphere (parts per billion), and TH is the number of years over which the integration is performed (time horizon), which is chosen to be 20, 100, or 500 years to model short-term or long-term warming potentials. The concentration is a function of time (t), primarily due to loss by chemical reaction. GWP contains an exposure factor (Ci) and an impact factor (ai). Several authors have developed models to calculate GWP, and as a result, variations in GWP predictions have appeared (Fisher et al., 1990a; Derwent, 1990; Lashof and Ahuja, 1990; Rotmans, 1990). A list of “best estimates” for GWPs has been assembled from these model predictions by a panel of experts convened under the Intergovernmental Panel on Climate Change (IPCC, 2007). Table A5-1 is a list of GWPs for several important greenhouse gases. The GWP for each chemical is influenced mostly by the chemical’s tropospheric residence time and the strength of its infrared radiation absorbance (band intensities). All of these gases are extremely volatile, do not dissolve in water, and do not adsorb to soils and sediments. Therefore, they will persist in the atmosphere after being released from sources.
The product of the GWP and the mass emission rate of a greenhouse gas results in the equivalent emission of carbon dioxide, the benchmark compound, that would result in the same radiative forcing. By performing this calculation, a direct connection is made between mass emission from a process of any greenhouse gas and global warming impact. The global warming index for the entire product system is the sum of the emissions-weighted GWPs for each chemical:
where mi is the mass emission rate of chemical i from the entire product system (kg/hr). This step will provide the equivalent process emissions of greenhouse chemicals in the form of the benchmark compound, CO2.
The global warming index as calculated in equation (5-4) accounts for direct effects of the chemical, but most chemicals of interest are so short-lived in the atmosphere (because of the action of hydroxyl radicals in the troposphere) that they disappear (become converted to CO2) long before any significant direct effect can be felt. However, organic chemicals will have an indirect global warming effect because of the carbon dioxide released upon oxidation within the atmosphere and other compartments of the environment. In order to account for this indirect effect for organic compounds with atmospheric reaction residence times of less than half a year, an indirect GWP is defined as (Shonnard and Hiew, 2000)
where NC is the number of carbon atoms in the chemical i and the molecular weights (MW) convert from a molar to a mass basis for GWP, as originally defined. Organic chemicals whose origins are in renewable biomass (plant materials) will have no net global warming impact because the CO2 released upon environmental oxidation of these compounds will replace CO2 removed from the atmosphere during photosynthesis of the biomass (see Chapter 6). Example 5-2 demonstrates the application of equation (5-4) to the production of an important industrial solvent.
Example 5-2. Global warming index for air emissions of 1,1,1-trichloroethane from a production process
1,1,1-Trichloroethane (1,1,1-TCA) is used as an industrial solvent for metal cleaning, as a reaction intermediate, and for other important uses (WHO, 2000). Sources for air emissions include distillation condenser vents, storage tanks, handling and transfer operations, fugitive sources, and secondary emissions from wastewater treatment. This example will estimate the global warming impact of the air emissions from this process. Include direct impacts to the environment (from 1,1,1-TCA) and indirect impacts from energy usage (CO2 and N2O release) in your analysis. The following data show the major chemicals that impact global warming when emitted from the process.
Determine the global warming index for the process and the percentage contribution for each chemical.
Data: Air Emissions (Based on a 15,500 kg 1,1,1-TCA/hr Process)
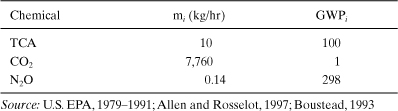
Solution: Using equation (5-4), the process global warming index is
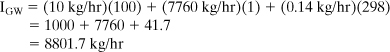
The percent of the process IGW for each chemical is
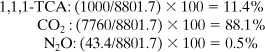
Discussion In this case study, the majority of the global warming impact from the production of 1,1,1-TCA is from the energy requirement of the process and not from the emission of the chemical with the highest global warming potential. This analysis assumes that a fossil fuel was used to satisfy the energy requirements of the process. If renewable resources were used (biomass-based fuels), the impact of CO2 on global warming would be significantly reduced. Finally, the majority of the global warming impact of 1,1,1-TCA could very well be felt during the use stage of its life cycle if the compound evaporates when it is used. This possibility was not included in this example.
Ozone Depletion. The ozone depletion potential (ODP) of a chemical is the predicted time-and height-integrated change (δ[O3]) in stratospheric ozone caused by the release of a specific quantity of the chemical relative to that caused by the same quantity of a benchmark compound, trichlorofluoromethane (CFC-11, CCl3F) (Fisher et al., 1990b):
Model calculations for ODP have been carried out using one-and two-dimensional photochemical models. A list of ODPs, for a small number of chemicals, has been assembled by a committee of experts (WMO, 2007; U.S. EPA, 2011). The product of the ODP and the mass emission rate of a chemical i results in the equivalent impact of an emission of CFC-11. Tables A5-2 and A5-3 show a list of ozone depletion potential values for important industrial compounds. Notice that the brominated compounds in these tables have much larger ODPs than the chorinated species. Also, it is thought that fluorine does not contribute to ozone depletion (Ravishankara et al., 1994). Like the global warming chemicals in Table A5-1, the chemicals in Tables A5-2 and A5-3 will exist almost exclusively in the atmosphere after being emitted by sources. The ozone depletion index for an entire product system is the sum of all contributions from emitted chemicals multiplied by their emission rates. The equivalent emission of CFC-11 for the entire product system is then
Acid Rain. The potential for acidification for any compound is related to the number of moles of H+ created per number of moles of the compound emitted. The balanced chemical equation can provide this relationship:
where X is the emitted chemical substance that initiates acidification and a (moles H+/mole X) is a molar stoichiometric coefficient. Acidification is normally expressed on a mass basis, and therefore the H+ created per mass of substance emitted (ηi, moles H+/kg i) is
where MWi is the molecular weight of the emitted substance (kg i/moles i). As before, we can introduce a benchmark compound (SO2) and express the acid rain potential (ARPi) of any emitted acid-forming chemical relative to it (Heijungs et al., 1992):
The number of acidifying compounds emitted by industrial sources is limited to a rather small number of combustion by-products and other precursor or acidic species emitted directly to the environment. Table A5-4 lists the acid rain potentials for several common industrial pollutants. The total acidification potential index of an entire product system is defined similarly to IGW and IOD:
Smog Formation. A scientifically based smog formation assessment tool will aid in identifying opportunities for reducing smog formation. The most important process for ozone formation in the lower atmosphere is photodissociation of NO2:
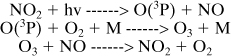
where M is nitrogen or molecular oxygen. This cycle results in O3 concentration being in a photostationary state dictated by the NO2 photolysis rate and ratio of [NO2]/[NO]. The role of VOCs is to form radicals that can convert NO to NO2 without causing O3 destruction, thereby increasing the ratio [NO2]/[NO] and increasing O3.

The tendency of individual VOCs to influence O3 levels depends upon their hydroxyl radical (•OH) rate constant and elements of their reaction mechanism, including radical initiation, radical termination, and reactions that remove NOx. Simplified smog formation potential indexes have been proposed based only on VOC hydroxyl radical rate constants, but these have not correlated well with model predictions of photochemical smog formation (Allen et al., 1992; Japar et al., 1991).
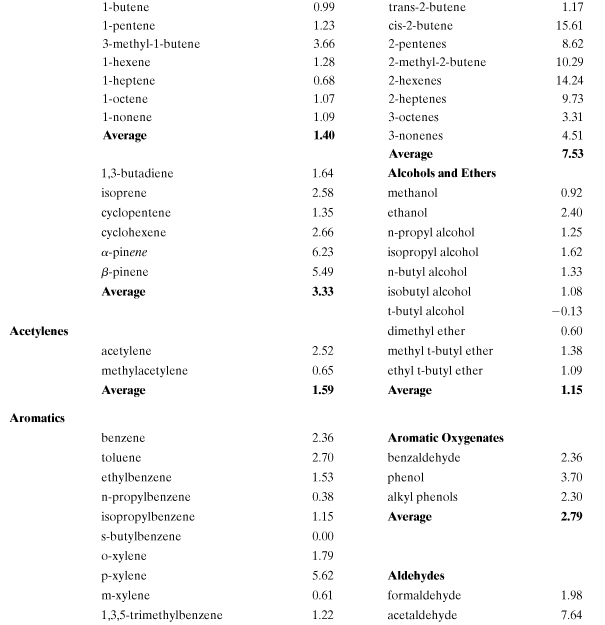
Incremental reactivity (IR) has been proposed as a method for evaluating smog formation potential for individual organic compounds. It is defined as the change in grams of ozone formed as a result of emission into an air shed of 1 g of the VOC (Carter and Atkinson, 1989). Several computer models have been developed to evaluate incremental reactivity (Carter and Atkinson, 1989; Carter, 1994; Chang and Rudy, 1990; Dodge, 1984). In general, predicted VOC incremental reactivities are greatest when NOx levels are high relative to reactive organic gases (ROG) and lowest (or even negative) when NOx is relatively low. Therefore, the ratio ROG/NOx is an important model parameter. Lists of incremental smog formation reactivities for many VOCs have been compiled (Carter, 1994; Heijungs et al., 1992). An estimation methodology has also been developed which circumvents the need for computer model predictions, though the practical use of this method is limited because of lack of detailed smog reaction mechanisms for a large number of compounds (Carter and Atkinson, 1989). Although several reactivity scales are possible, the most relevant for comparing VOCs is the maximum incremental reactivity (MIR) which occurs under high NOx conditions when the highest ozone formation occurs (Carter, 1994).
The smog formation potential (SFP) is based on the maximum incremental reactivity scale of Carter (Carter, 1994):
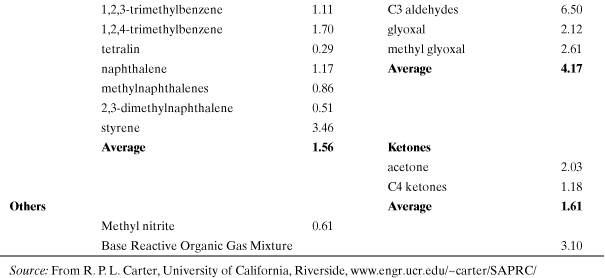
where MIRROG is the average value for background “reactive organic gases,” the benchmark compound for this index. This normalized and dimensionless index is similar to the one proposed by the Netherlands Agency for the Environment (Heijungs et al., 1992). Table A5-5 contains a listing of calculated MIR values for many common volatile organic compounds found in fuels, paints, and solvents. Most of the chemicals in Table A5-5 are volatile and will maintain a presence in the atmosphere after release into the air, with the exception of the higher-molecular-weight organics. The total smog formation potential is the sum of the MIRs and emission rates for each smog-forming chemical in the process. The process equivalent emission of ROG is
Example 5-3 is an application of these environmental impact equations to the generation of electricity using different primary energy sources: coal, oil, natural gas, nuclear, hydro, wind, and photovoltaics.
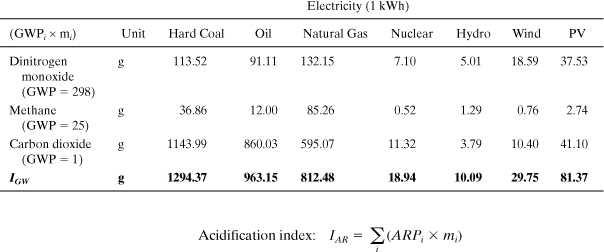
Example 5-3. Comparing electricity generation by fuel type
Electricity is one of the most important forms of energy that is used in industry, commerce, and private residences. In this example, a list of pollutant emissions to air will be listed for different electricity fuel types. The emissions will be classified into different impact categories and their impact potentials characterized. Finally, environmental indicators will be calculated from the emission and impact potential data.
Solution: Emissions of gaseous pollutants based on the production of 1 kWh of each electricity type are shown in the table below. These inventory data represent a compilation over the entire life cycle from extraction of raw materials from nature to the output of electricity from the power plant: a “cradle-to-gate” inventory.
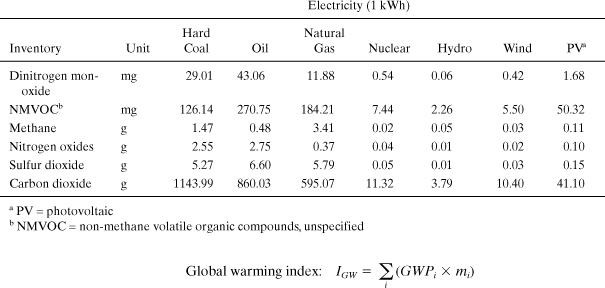
The inventory values for each pollutant are multiplied by the appropriate GWPi. For example, the table entry (below) for hard coal dinitrogen monoxide is calculated as (298 Χ 29.01 mg)/(1000 mg/g) = 113.52 g. From this table we see that the global warming index for these electricity types differs by over a factor of 100 from the highest (coal) to the lowest (hydro). CO2 is the most important greenhouse gas, but N2O can constitute over 60% of IGW. Oil power achieves about a 25% reduction in global warming impact compared to coal, and natural gas shows nearly 38% in savings.
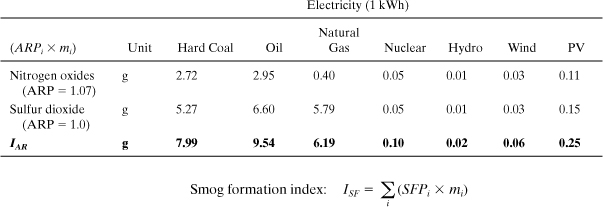
Similar to the preceding case, the inventory values for each pollutant are multiplied by the appropriate ARPi. For example, the table entry for hard coal nitrogen oxides (NO) is calculated as (1.07 × 2.55 g) = 2.72 g. From this table we see that the acidification index for these electricity types differs by over a factor of 100 from the highest (oil) to the lowest (hydro). SO2 is the most important compound, but NO can constitute up to 50% of IAR.
The inventory values for each pollutant are multiplied by the appropriate SFPi. For example, the table entry for hard coal NMVOC is calculated as (3.10 × 126.14 mg)/1000 = 0.39 g. From this table we see that the smog formation index for these electricity types differs by nearly a factor of 100 from the highest (oil) to the lowest (hydro). NMVOC is the most important even though emissions of methane are higher.
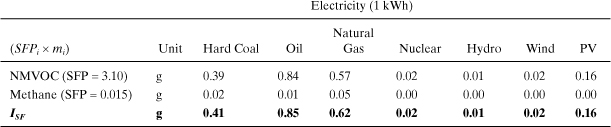
This comparison shows that electricity generated from coal and oil has the highest impact on the environment, and that renewable power from hydro, wind, and solar (PV) are among the best alternatives based on these indicators. Nuclear also exhibits very low impacts for these indicators, but the same conclusion may not apply if human health indicators and other types of impacts are included. These results can be used to inform decisions about investments in future power production and also in consumer decision making on whether or not to purchase green power.
Human and Ecosystem Health. Environmental indicators such GWP, ODP, ARP, and SFP are based on cause-and-effect mechanisms involving physical and chemical transformation of pollutants. Indicators for human and ecosystem health rely on both objective (physical and chemical) and subjective factors. The TRACI method is one of the more objective, science-based indicator sets for human and ecosystem health (Bare et al., 2003), but similar methods are also available (Guinée et al., 1996; Hertwich et al., 2001). The TRACI method is based on a multimedia fate, multipathway human exposure and toxicological potency approach. Twenty-three exposure pathways were taken into account, including inhalation, ingestion of water and food, and dermal contact with the soil and water. Toxicity is based on cancer potencies for carcinogens and reference doses or concentrations for noncarcinogens (see Chapter 2 for sources of toxicological data). The TRACI method is applicable to long-term and large-scale assessments of health effects. Methods that include toxicological properties but not environmental fate and human exposure modeling are often used, yet they are less scientifically rigorous. One such method classifies toxic releases into six human health categories depending on exposure route (inhalation, ingestion, dermal) and severity of toxic response according to EU Directive 67/546/EEC (Saling et al., 2002; Landsiedel and Saling, 2002). Other methods rely on environmental and occupational health regulatory concentration limits to weight the relative toxicity potentials of compounds (Postlethwaite and de Oude, 1996).
At times, different life-cycle impact systems will lead to different results. As an example, consider an inventory of the releases of organochlorine compounds to the Great Lakes Basin, which was performed by Rosselot and Allen (1999). Three different potency factor schemes for human and ecological toxicity impact categories were used to rank the inventory data. The results of the rankings are shown in Table 5-5. Ideally, each of the potency factor schemes would result in the same rank ordering of chemicals; however, the data show that the different potency schemes lead to different rank ordering of some of the compounds. The potency schemes agree in their rankings of trichloroethylene, 1,2-dichloroethane, and PCBs but disagree in their rankings of dichloromethane, endosulfan, and hexachlorobutadiene. Note that not all of the characterization systems listed in the table were created for the purpose of conducting life-cycle impact assessments. Instead, some of them were developed in order to rank emissions. Also note that ranking these compounds by mass of release (the order in which they are listed in the table) would give very different results from ranking them by potency of effect for any of the characterization schemes. Thus, while not all potency factors lead to identical results, ignoring the concept of potency and considering only the mass of emissions may place too great an emphasis on relatively benign compounds that are emitted in large amounts.
Table 5-5. Rankings of 1993 Releases of Chlorinated Organic Compounds in the Great Lakes Basin for Several Potency Factor Schemes
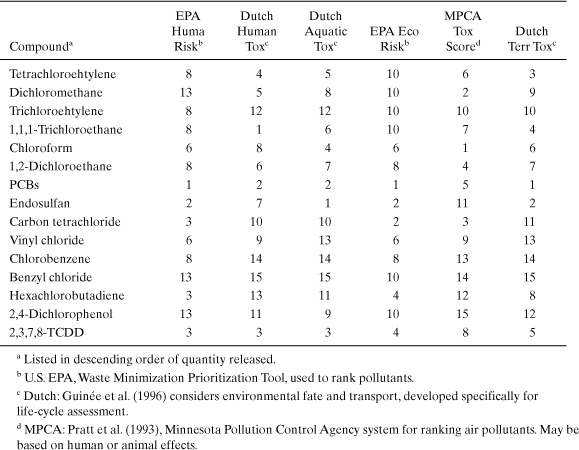
Why would different potency schemes lead to different results? The answer is simple. The methods are often based on different criteria. Some commonly used potency factors (Swiss Federal Ministry for the Environment [BUWAL]; Postleth-waite and de Oude, 1996) are based on data from environmental regulations. In these systems, each emission is characterized based on the volume of air or water that would be required to dilute the emission to its legally acceptable limit. For example, if air quality regulations allowed 1 ppb by volume of a compound in ambient air, then 1 billion moles of air (22.4 billion liters of air at standard temperature and pressure) would be required to dilute 1 mole of the compound to the allowable standard. This volume per unit mass or mole of emission is called the critical dilution volume and can vary across political boundaries.
5.5. Social Performance Indicators
Engineers often incorporate social concerns in the design of products, infrastructure, and systems by considering the end user functions and interactions. But social impacts within the context of sustainability move well beyond end user functions to the fulfillment of human needs and improvement of the human condition. These needs and social conditions span a range of issues from fulfillment of basic nutritional, sanitation, and security requirements to higher-level human aspirations in areas of health, education, and the arts. But how can engineers incorporate elements of social sustainability into design in a formal fashion? This section will attempt to provide some preliminary answers to this question.
A basic issue to address in developing social indicators of sustainability is what impacts should be considered. There is no general consensus among sustainability experts, but some recent attempts have taken place to identify categories of impacts and to understand advantages and limitations to their implementation in decision making (Hutchins, 2010). Parris and Kates (2003) reviewed 12 efforts to define indicators of sustainability, ranging in scale from global to local, and identified from 6 to 255 indicators. With such a large number of social sustainability indicators to work with, some attempt to organize them into themes and subthemes has proven beneficial. Table 5-6 lists several social indicator themes and subthemes developed by the United Nations for the purpose of tracking progress toward meeting the Millennium Development Goals (UNDSD, 2001).
Table 5-6. Selected UNDSD Indicators of Social Sustainable Development
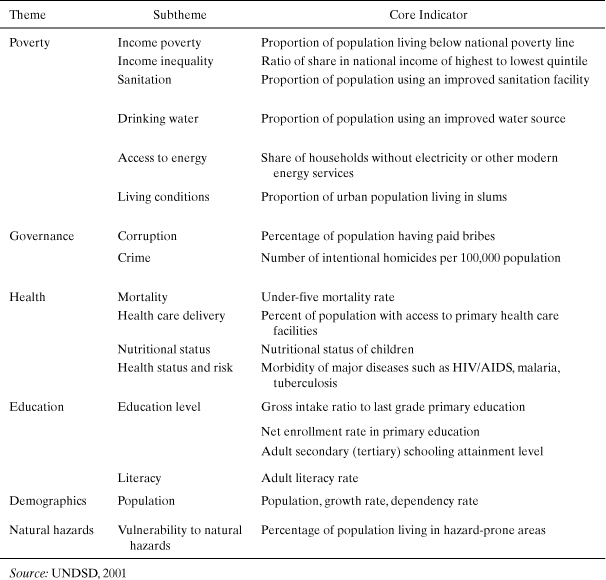
Clearly these indicators are intended to measure progress toward meeting global sustainability objectives in the area of basic human needs. However, this set of indicators may not be the most appropriate for judging the performance of engineering designs. For example, it contains very few indicators that measure higher-level social aspirations in areas of higher education, research and development, and gender and generational equity.
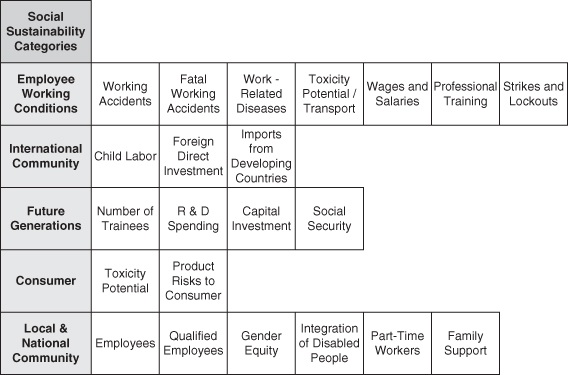
Another recent effort to incorporate social indicators into product and process design was implemented into a life-cycle assessment framework (Kölsch et al., 2008). The goal of this methodology effort was to provide decision makers with a tool to judge the relative social costs and benefits alongside environmental lifecycle impacts and economic costs, achieving a comprehensive sustainability analysis. Figure 5-4 shows five categories of social impacts, the categories corresponding to key stakeholders for a global manufacturing corporation, and several indicators within these categories. There are similarities with the themes and subthemes from Table 5-6, but with additional indicators dealing with employment conditions, professional development, research, future generations, and gender equity. A case study comparing rapeseed biodiesel derived from plant oil to petroleum diesel based on social, environmental, and cost indicators was presented. Inventory data for the social sustainability analysis were assigned to key material and energy inputs into the fuel life cycles, similar to environmental life-cycle assessment, using national-level statistical data from major industry sectors. Thus, each key input to the product life cycle is accompanied by a detailed social sustainability profile. This method also discussed normalization and weighting approaches required to aggregate the numerous indicators in each stakeholder category into a single score, similar to environmental life-cycle assessment. The study concluded that petroleum diesel is preferable from an economic cost perspective and that biodiesel produced from rapeseed was superior based on both environmental and social life-cycle assessment.
Figure 5-4. Social sustainability stakeholders (categories) and indicators within each category (Adapted from Kölsch et al., 2008)
As demonstrated in this section, it is possible to incorporate social sustainability into engineering design in a way that integrates with environmental life-cycle assessment and costs. The methods are rudimentary and there is little evidence to date that results are robust and accurate, but a framework for improvement has been achieved.
5.6. Summary
Engineers play an important role in global sustainable development by developing and commercializing technologies that allow for a high standard of living, with favorable economic returns, minimum environmental impact, and with regard to the social conditions of stakeholders. This chapter provided engineering design principles to address environmental issues, introduced an environmental perspective on engineering economics, presented an overview of environmental indicators, and outlined a framework for social sustainability assessment. Taken together, these approaches, methods, and frameworks are a valuable addition to an engineer’s design “toolbox.”
Problems
1. Design for a purpose Provide several examples of engineered products that are flawed and wasteful when conforming to a “one size fits all” design. Do the same for products that are efficient because they are defined for a specific purpose.
2. Improving business performance through improving environmental performance Browse the Web site of the World Business Council for Sustainable Development (www.wbcsd.ch) and identify a case study of a company improving business performance through improving environmental performance. Write a one-page summary of the case study.
3. Sustainability reports Conduct an Internet search to obtain a recent sustainability report for a major corporation. Compare reported environmental costs with total revenues. Determine the percent of total revenues devoted to environmental expenditures and compare it to the percentages listed in Table 5-1. Discuss any itemization of environmental expenditures in the report (environmental operations, capital equipment, remediation, reporting, etc.).
4. Risk shifting Provide examples of “risk shifting,” a concept introduced in Sandestin Green Engineering Principle 1.
5. Unintended consequences Provide examples of engineering designs or products from these designs that caused unintended damage to ecosystems (Sandestin Green Engineering Principle 2).
6. Life cycles Sketch the life cycle of a product of engineering design. Include inputs and outputs of key materials and energy at each stage of the life cycle, including recycle/disposal at end of life as well as transportation between stages (Sandestin Green Engineering Principle 3).
7. Safety Discuss the inherent safety issues of petroleum versus forest biomass as feed-stock for production of liquid transportation fuels. Both of these feedstocks can be converted to liquid hydrocarbon fuels. Consider the safety to both human health and ecosystems in your answer (Sandestin Green Engineering Principle 4).
8. Natural resource use What natural resources are under-or overutilized in your area of the United States? How could engineering designs address resource scarcity in such cases (Sandestin Green Engineering Principle 5)?
9. Wastes as raw materials Bagasse, a waste product of sugarcane processing, is the woody stalk of the cane plant remaining after sugar is extracted. In Brazil, for example, bagasse is often used as a fuel for power generation at the locations of cane processing. Provide one or more examples of wastes from key product systems that have found beneficial uses through engineering designs (Sandestin Green Engineering Principle 6).
10. Personal transportation Investigate differences in personal transportation from country to country and elaborate on cultural contexts of these different transportation options (Sandestin Green Engineering Principle 7).
11. Engineering for sustainability How have innovations in engineering design helped achieve sustainability goals in developing countries, such as providing basic services like drinking water, power, food preservation, and sanitation? Provide some examples and discuss the engineering design aspects (Sandestin Green Engineering Principle 8).
12. Community engagement Investigate and report on how engineers became involved in community engagement in your chosen field of study. What kinds of community engagement activities were the engineers involved in (Sandestin Green Engineering Principle 9)?
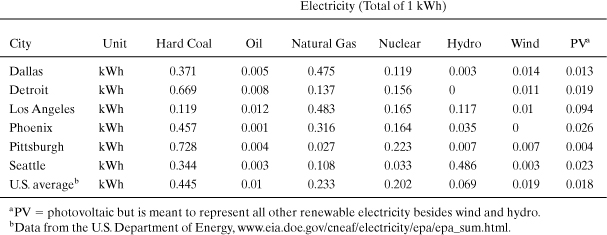
13. Global warming emissions from electricity generation Each state in the United States has a unique profile of electricity generation types, and this characteristic is also true for cities within these states. Using the table of electricity generation sources below:
a. Calculate in a table the global warming index for each city’s electricity based on 1 kWh generated.
b. Compare and discuss the global warming index for each city. Which city has the lowest global warming index? Which city has the highest index? By how much do the high and low cities differ (percent of the highest)?
Data for cities are from the U.S. EPA at www.epa.gov/cleanenergy/energy-and-you/index.html. This problem was originally analyzed by Mark Cleghorn, an online student at Michigan Technological University, in the course ENG5510 Sustainable Futures 1.
Appendix
Table A5-1. Global Warming Potentials for Greenhouse Gases (CO2 Is the Benchmark)
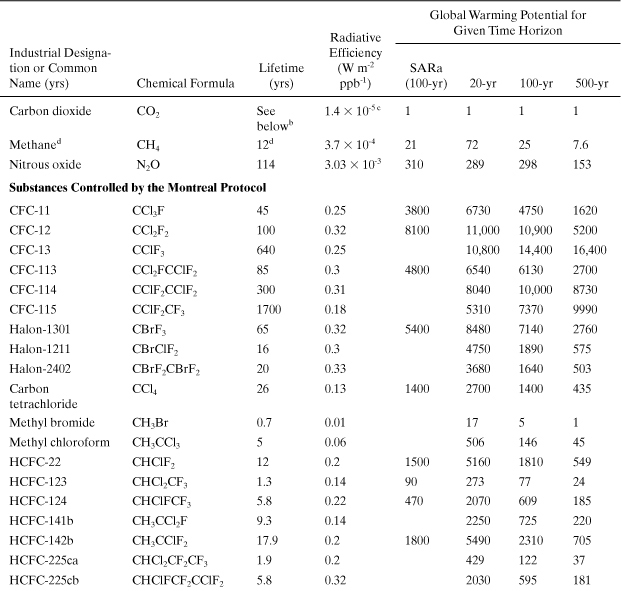
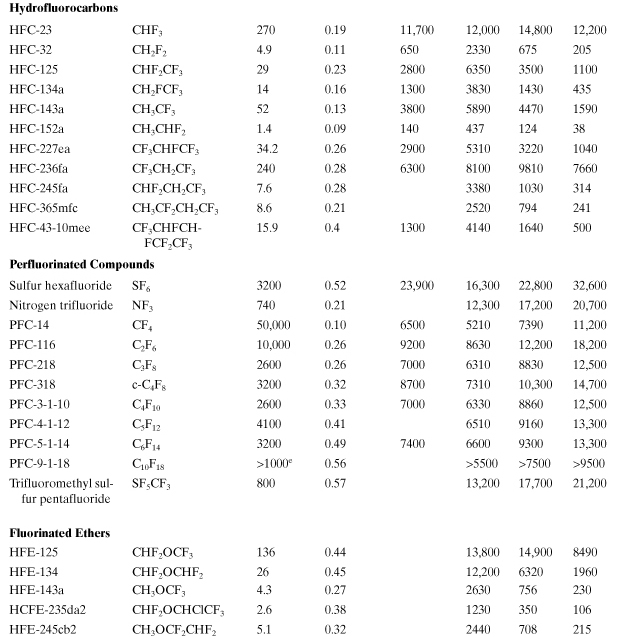
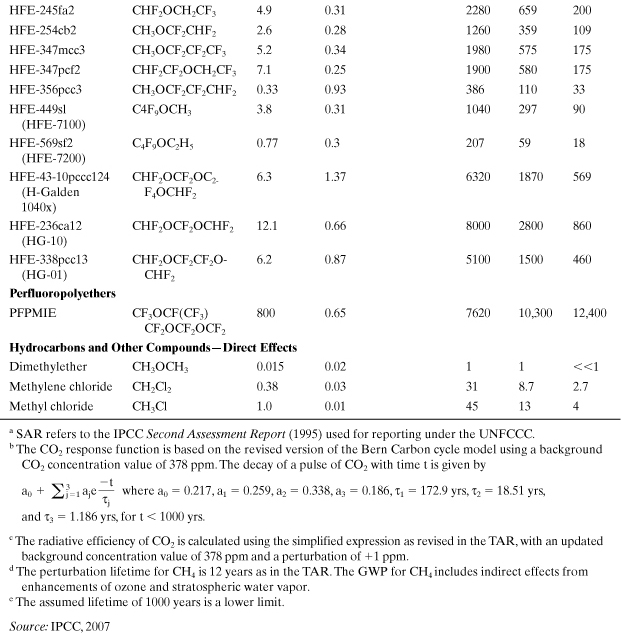
Table A5-2. Ozone Depletion Potentials for Class I Substances to Be Phased Out
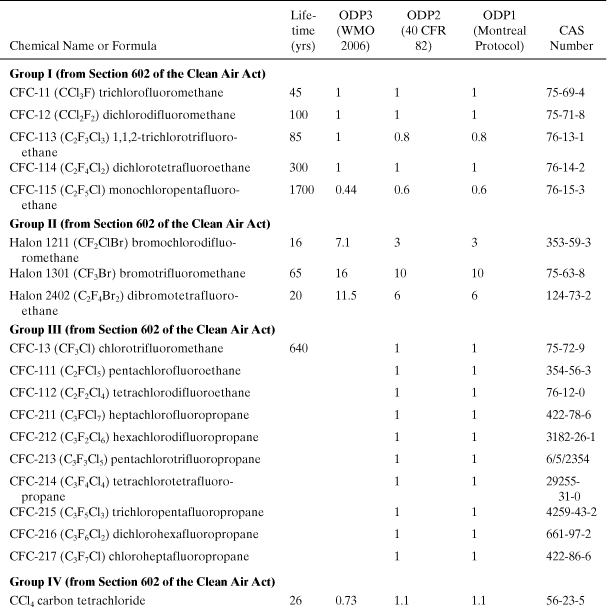
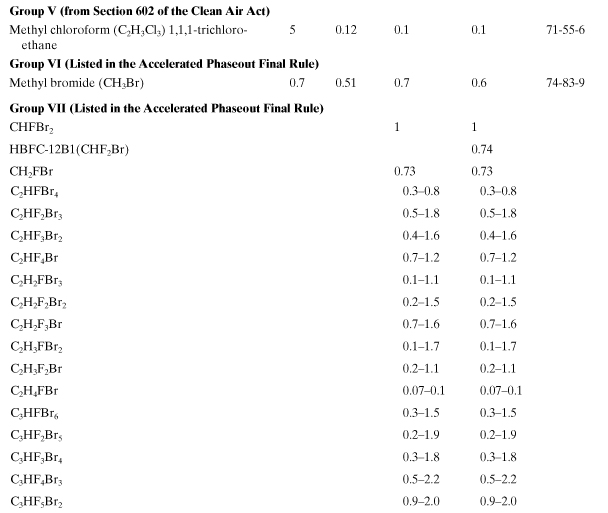
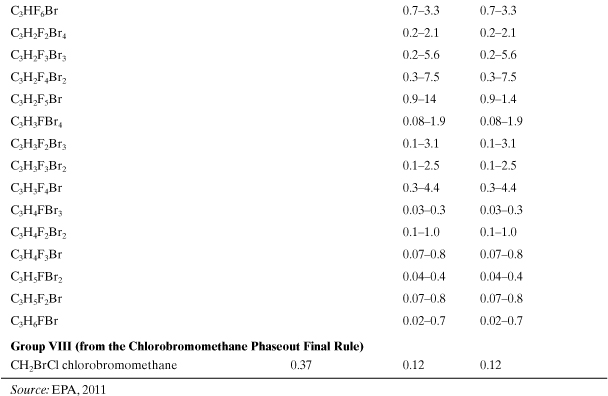
Table A5-3. Ozone Depletion Potentials for Class II Substances—Substitutes
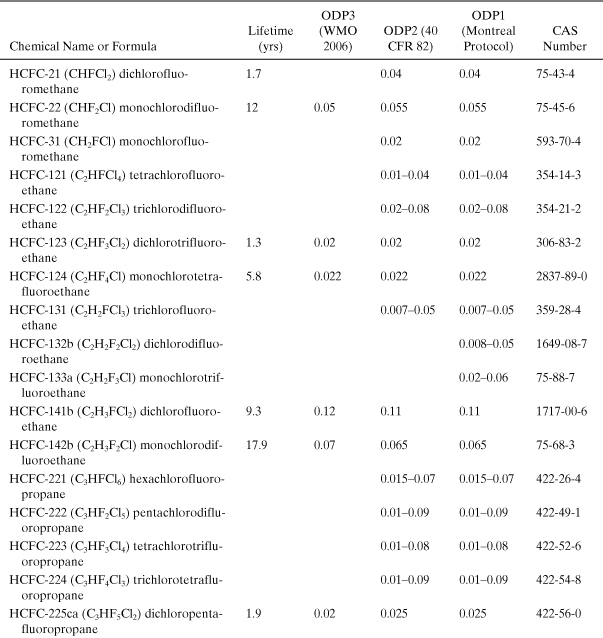
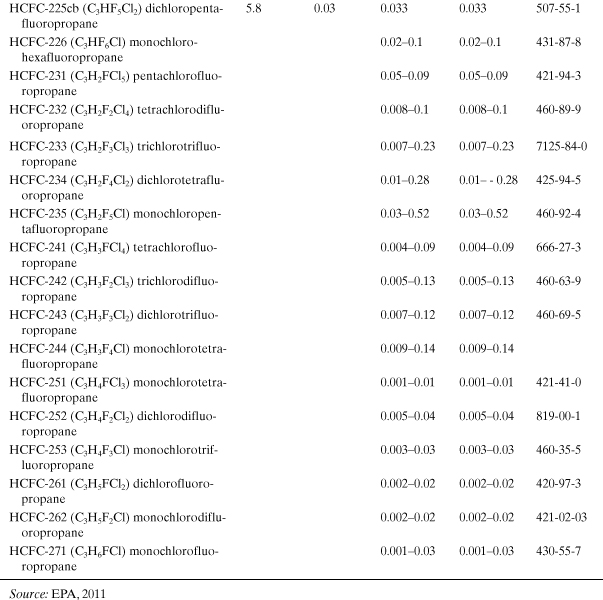
Table A5-4. Acid Rain Potential for a Number of Acidifying Chemicals
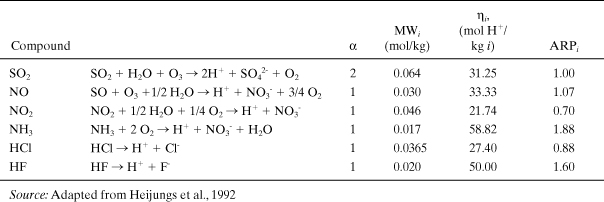
Table A5-5. Maximum Incremental Reactivities (MIR; g O3/g VOC) for Smog Formation (Tropospheric O3)

References
Abraham, M. A., ed. 2006. Sustainability Science and Engineering: Defining Principles. Amsterdam: Elsevier Science.
Abraham, M. A., and N. Nguyen. 2003. “Green Engineering: Defining the Principles.” Results from the Sandestin Conference. Environmental Progress 22(4):233–36.
Allen, D. T., N. Bakshani, and K. S. Rosselot. 1992. Pollution Prevention: Homework & Design Problems for Engineering Curricula. New York: American Institute of Chemical Engineers.
Allen, D. T., and K. S. Rosselot. 1997. Pollution Prevention for Chemical Processes, 1st ed. New York: John Wiley & Sons.
Allen, D. T., and D. R. Shonnard (and other contributors). Green Engineering: Environmentally Conscious Design of Chemical Processes, 2nd ed. Upper Saddle River, NJ: Prentice Hall (In press).
AIChE CWRT (American Institute of Chemical Engineers’ Center for Waste Reduction Technologies). 2000. Total Cost Assessment Methodology. New York: AIChE.
Anastas, Paul T., and John C. Warner. “Tweve Principles of Green Chemistry.” Available at www.chm.bris.ac.uk/webprojects2002/howells/twelve_green_chemistry_principle.htm.
Anastas, Paul T., and J. B. Zimmerman. 2003. “Design Through the 12 Principles of Green Engineering.” Environmental Science & Technology 37(5):94A–l01A.
Bare, J. C., P. Hofstetter, D. W. Pennington, and H. A. Udo de Haes. 2000. “Midpoints vs Endpoints: The Sacrifices and Benefits.” International Journal of Life Cycle Assessment 5(6):319–26.
Bare, J. C., G. A. Norris, D. W. Pennington, and T. McKone. 2003. “TRACI: The Tool for the Reduction and Assessment of Chemical and Other Environmental Impacts.” Journal of Industrial Ecology 6(3–4):49–78.
Boustead, I. 1993. “Ecoprofiles of the European Plastics Industry, Report 1–4.” Reports for the European Centre for Plastics in the Environment (PWMI), Brussels, May.
Carter, W. P., and R. Atkinson. 1989. “A Computer Modeling Study of Incremental Hydrocarbon Reactivity.” Environmental Science & Technology 23:864–80.
Carter, W. P. L. 1994. “Development of Ozone Reactivity Scales for Volatile Organic Compounds. Air & Waste 44:881–99.
Chang, T. Y., and S. J. Rudy. 1990. “Ozone-Forming Potential of Organic Emissions from Alternative-Fueled Vehicles.” Atmospheric Environment 24A:2421.
Derwent, R. G. 1990. Trace Gases and Their Relative Contribution to the Greenhouse Effect. Report AERE-R13716. Harwell, UK: Atomic Energy Research Establishment.
Dodge, M. C. 1984. “Combined Effects of Organic Reactivity and NMHC/NOx Ratio on Photochemical Oxidant Formation: A Modeling Study.” Atmospheric Environment 18:1857.
Fava, J., et al. 1992. Life Cycle Assessment Data Quality: A Conceptual Framework. SETAC workshop, Wintergreen, VA.
Fava, J., and F. Consoli. 1996. “Application of Life-Cycle Assessment to Business Performance.” In Environmental Life Cycle Assessment, edited by M. A. Curran. New York: McGraw-Hill.
Financial Accounting Standards Board. 1985. Concept Statement No. 6, Paragraph 35.
Fisher, D. A., C. H. Hales, W. Wang, M. K. W. Ko, and N. D. Sze. 1990a. “Model Calculations of the Relative Effects of CFCs and Their Replacements on Global Warming.” Nature 344:513–16.
Fisher, D. A., C. H. Hales, D. L. Filkin, M. K. W. Ko, N. D. Sze, P. S. Connell, D. J. Wuebbles, I. S. A. Isaksen, and F. Stordal. 1990b. “Model Calculations of the Relative Effects of CFCs and Their Replacements on Stratospheric Ozone.” Nature 344:508–12.
Goedkoop, M., and R. Spriensma. 1999. The Eco-Indicator’99: A Damage-Oriented Method for Life Cycle Impact Assessment. Zoetermeer, The Netherlands: VROM, Ministry of Housing, Spatial Planning, and the Environment. www.pre.nl.
Graedel, T. E., and B. R. Allenby. 1998. Industrial Ecology and the Automobile. Upper Saddle River, NJ: Prentice Hall.
Guinée, J., R. Heijungs, L. van Oers, D. van de Meent, T. Vermeire, and M. Rikken. 1996. LCA Impact Assessment of Toxic Releases: Generic Modelling of Fate, Exposure, and Effect for Ecosystems and Human Beings with Data for About 100 Chemicals. No. 1996/21. The Hague, The Netherlands: VROM, Ministry of Housing, Spatial Planning, and the Environment.
Heijungs, R., J. B. Guinée, G. Huppes, R. M. Lankreijer, H. A. Udo de Haes, and A. Wegener Sleeswijk. 1992. “Environmental Life Cycle Assessment of Products. Guide and Backgrounds.” NOH Report Numbers 9266 and 9267. Netherlands Agency for Energy and the Environment. November.
Heller, M., P. D. Shields, and B. Beloff. 1995. “Environmental Accounting Case Study: Amoco Yorktown Refinery.” In Green Ledgers: Case Studies in Corporate Environmental Accounting, edited by D. Ditz, J. Ranganathan, and D. Banks. Washington, DC: World Resources.
Hertwich, E. G., S. F. Mateles, W. S. Pease, and T. E. McKone. 2001. “Human Toxicity Potentials for Life Cycle Analysis and Toxics Release Inventory Risk Screening.” Environmental Toxicology and Chemistry 20:928–39.
Hutchins, M. 2010. Framework, Indicators, and Techniques to Support Decision Making Related to Societal Sustainability. Ph.D. Dissertation, Department of Mechanical Engineering, Michigan Technological University.
IISD (International Institute for Sustainable Development). 2002. Seven Questions to Sustainability. Task 2 Work Group, Mining, Minerals and Sustainable Development North America Project. www.iisd.org/publications/pub.aspx?id=456.
Institute of Management Accountants. 1990. Management Accounting Glossary. Statement No. 2A.
IPCC (Intergovernmental Panel on Climate Change). 2007. Climate Change 2007: The Physical Science Basis, edited by S. Solomon, D. Qin, and M. Manning. Cambridge: Cambridge University Press.
Japar, S. M., T. J. Wallington, S. J. Rudy, and T. Y. Chang. 1991. “Ozone-Forming Potential of a Series of Oxygenated Organic Compounds.” Environmental Science & Technology 25:415–20.
Kölsch, D., P. Saling, A. Kicherer, A. Grosse-Sommer, and I. Schmidt. 2008. “How to Measure Social Impacts? A Socio-eco-efficiency Analysis by the SEEBALANCE® Method.” International Journal of Sustainable Development 11(1):1–23.
Landsiedel, R., and P. Saling. 2002. “Assessment of Toxicological Risks for Lifecycle Assessment and Eco-Efficiency Analysis.” International Journal of Lifecycle Assessment 7(5):261–68.
Lashof, D. A., and D. R. Ahuja. 1990. “Relative Contributions of Greenhouse Gas Emissions to Global Warming.” Nature 344:529–31.
McDonough, W., and M. Braungart. 1992. “Hannover Principles.” www.mindfully.org/Sustainability/Hannover-Principles.htm.
NRC (National Research Council), Committee on Institutional Means for Assessment of Risks to Public Health. 1983. Risk Assessment in the Federal Government: Managing the Process. Washington, DC: National Academy Press.
Parris, T. M., and R. W. Kates. 2003. “Characterizing and Measuring Sustainable Development.” Annual Review of Environment and Resources 28: 559–86.
Postlethwaite, D., and N. de Oude. 1996. “European Perspective.” Chapter 9 in Environmental Life-Cycle Assessment, edited by M. A. Curran. New York: McGraw-Hill.
Postlethwaite, D., B. Quay, J. Seguin, and B. Vigon, eds. 1993. Guidelines for Life Cycle Assessment: A Code of Practice. Pensacola, FL: SETAC Press.
Pratt, G. C., P. E. Gerbec, S. K. Livingston, F. Oliaei, G. L. Gollweg, S. Paterson, and D. Mackay. 1993. “An Indexing System for Comparing Toxic Air Pollutants Based upon Their Potential Environmental Impacts.” Chemosphere 27(8):1350–79.
Ravishankara, A. R., A. A. Turnipseed, N. R. Jensen, S. Barone, M. Mills, C. J. Howard, and S. Solomon. 1994. “Do Hydrofluorocarbons Destroy Stratospheric Ozone?” Science 263:71–75.
Rosselot, K. S., and D. T. Allen. 1999. “Chlorinated Organic Compounds in the Great Lakes Basin: Impact Assessment.” Submitted to Journal of Industrial Ecology.
Rotmans, J. 1990. IMAGE: An Integrated Model to Assess the Greenhouse Effect. Maastrich, Dordrecht, The Netherlands: Kluwer Academic Publishers, pp. 205–24.
Saling, P., A. Kicherer, B. Dittrich-Krämer, R. Wittlinger, W. Zombik, I. Schmidt, W. Schrott, and S. Schmidt. 2002. “Eco-efficiency Analysis by BASF: The Method.” International Journal of LCA 7(4):203.
SETAC (Society for Environmental Toxicology and Chemistry). 1993. Guidelines for Life-Cycle Assessment: Code of Practice. Brussels, Belgium: SETAC Press.
Shields, P., M. Heller, D. Kite, and B. Beloff. 1995. “Environmental Accounting Case Study: DuPont.” In Green Ledgers: Case Studies in Corporate Environmental Accounting, edited by D. Ditz, J. Ranganathan, and D. Banks. Washington, DC: World Resources Institute.
Shonnard, D. R., and D. S. Hiew. 2000. “Comparative Environmental Assessments of VOC Recovery and Recycle Design Alternatives for a Gaseous Waste Stream.” Environmental Science & Technology 34(24):5222–28.
Shonnard, D. R., A. Lidner, Nhan Nguyen, et al. 2007. “Green Enginereing—Integration of Green Chemistry, Pollution Prevention, and Risk-Based Considerations.” In Kent and Reigel’s Handbook of Industrial Chemistry and Biotechnology, Volume 1, 11th ed. Springer Science and Business Media.
UNDSD (United Nations Division of Sustainable Development). 2001. Indicators of Sustainable Development: Guidelines and Methodologies. New York: United Nations. www.un.org/esa/sustdev/publications/indisd-mg2001.pdf.
U.S. Congress, Office of Technology Assessment (OTA). 1994. Industry, Technology and the Environment: Competitive Challenges and Business Opportunities. OTA-ITE-586. Washington, DC: U.S. Government Printing Office.
U.S. EPA (U.S. Environmental Protection Agency). 1995 An Introduction to Environmental Accounting as a Business Management Tool: Key Concepts and Terms. EPA 742-R-95-001. June.
___________. 2011. Ozone Layer Protection—Science Web site. www.epa.gov/ozone/science/ods/classone.html and www.epa.gov/ozone/science/ods/classtwo.html. Accessed March 8, 2011.
WCED (World Commission on Environment and Development). 1987. Report of the World Commission on Environment and Development. New York: United Nations.
WHO (World Health Organization). 2000. “Trichloroethylene.” Chapter 5.15 in Air Quality Guidelines, 2nd Edition. Copenhagen. www.euro.who.int/__data/assets/pdf_file/0005/74732/E71922.pdf.
WMO (World Meteorological Organization). 2007. Scientific Assessment of Ozone Depletion: 2006. Global Ozone Research and Monitoring Project—Report No. 50. Geneva, Switzerland: World Meteorological Organization.