
Overview of Functions
Efforts toward quality improvement should be made throughout the company. There are quality practices and considerations that can be used in each business function to make quality better. Figure 4.1 shows a typical organizational chart. For each of the functional groups, we will explore areas where changes can be made to improve quality. Collectively, these types of changes improve the overall quality level of the company.

Figure 4.1 Organization chart
Quality in Hardware Design and Development
Designing new products is the lifeblood of most companies. Creating something new and innovative is what sets you apart from the competition. But what can the designers do to contribute to a higher level of quality? Start with the end in mind. Do not just simply develop an innovative product. Develop an innovative product that customers want and can be produced at a competitive price. Here are a few areas where the design team can contribute to a higher quality product:
• Design reviews. Design reviews are cost-effective way to avoid major issues later. But they must be done right. One or two people huddled around a white board is not a design review. Get the design out in front of a cross-section of people from different functions (with different perspectives). It’s much easier and cheaper to fix something on paper than it is once the product is already developed.
• Design documentation. I am concerned that documentation has such a negative connotation. Too many development teams (in both large and small companies) avoid or even insist that design documents are not needed. I believe if you cannot (or won’t) take the time to clearly document your design, how can you correctly develop it? How can you share it? There should be levels (or a hierarchy) of documents, from a high-level architecture down to the details of a subassembly or module. This doesn’t need to be many, many pages. Just enough to effectively communicate with others. We will discuss this more when we get to testing.
• Defect rates. An early measure of product maturity (or immaturity) is tracking the defect rate during development. The key word being “rate,” meaning it is measured over time. If defects are growing exponentially, the product is not showing signs of maturing yet. Not until the rate of discovery starts to level out can you say your product has started to mature. Of course, this also depends on the volume of defects you are finding and the levels of testing being used to find them. There is value in tracking the rate at which defects are discovered, as well as the rate that defects are closed. Understanding the gap between opened and closed helps you to understand when your product might be ready for the next phase of testing and eventually for release.
• Design for X (DfX)—Design for Manufacturing, Design for Assembly, Design for Test. Take the time to gather the appropriate input from other functions so that DfX is included into your design goals. Yes, it will take additional time to plan. But it doesn’t do you much good to create an innovative product that is too error-prone for volume manufacturing. More on this under manufacturing.
Quality in Software Design and Development
In 2002, a study by the National Institute of Standards and Technology (NIST)1 reported that software bugs are costing the U.S. economy an estimated $59.5 billion each year. Improvements in testing could reduce this by a third, or $22.5 billion, but won’t eliminate all software errors. Jump ahead a few years. In a report on software failures, tricentis.com2 found that in 2017, software failures cost the U.S. economy $1.7 trillion in financial losses (up from $1.1 trillion in 2016). In total, software failures at 314 companies affected 3.6 billion people and caused more than 268 years collectively in downtime.
To make significant improvements, we need to consider quality throughout the entire software lifecycle and not just the test phase.
The causes for poor quality software can originate from a variety of inadequate practices, including:
1. Poorly written (or nonexistent) requirements
2. Lack of acceptance criteria for all requirements
3. Poor coding methods (or poorly trained developers)
4. Lack of structured development methods
5. Lack of structured test methods
6. Poor integration methods
7. Individuals working on too many things (due to being understaffed or lack of planning)
8. Thrashing between teams as they try to integrate their work
9. Little coordination for how work is given to teams, expecting teams to self-coordinate
10. Lack of alignment across the organization (i.e., across functional groups)
There is a definite impact from these issues. Typically, they result in some type of project delays, requiring additional time spent on:
• clarifying or rewriting requirements,
• finding bugs (fixing bugs does not take nearly as long as finding them),
• teams thrashing as they try to integrate various portions of code,
• working on the wrong things, due to poor communication or poorly developed specifications,
• fixing bugs,
• working on or removing features that are not useful (or would not have been selected had their true value been known), and
• working through complex code that is more complex than is needed.
The business benefits of including quality-oriented activities in all phases of the software development lifecycle are worth the additional effort. These activities will benefit the software effort by increasing predictability, reducing risk, and eliminating rework. They can also help to differentiate products from competitors. Most importantly, ensuring quality at all phases throughout the development cycle will always cost less than fixing issues after the fact.
In the article “The Software Quality Challenge,”3 Watts Humphrey suggested that once you have tested software, you can only be sure that it works under the conditions you tested it. But as software becomes more and more complex, it becomes nearly impossible to test all possible conditions in advance.
In the book, How Google Tests Software,4 the authors explain their approach toward quality. If a product breaks in the field, the first point of escalation is the developer who created the problem, not the tester who didn’t catch it. This means that quality is more an act of prevention than it is detection. Quality is a development issue, not a testing issue.
The key takeaway is that “find & fix,” in and of itself, is not an effective quality strategy for software. Defect prevention should be the priority in any software project (remember from Chapter 3—“prevention, not correction”). In most software organizations, the project team focuses on defect detection (test) and rework (fix and retest). A major assumption in these types of efforts is that you will catch all or at least most of the defects. Elaborate testing frameworks are built and maintained based on this assumption. Except, what if your fundamental design is wrong or you are missing requirements? It is surprising how often defect prevention is either neglected or not the priority. It is more effective to take measures that prevent the defect from being introduced in the product right from the earliest stages of a project. While the cost of such improvements is minimal, the benefits derived are significantly higher compared to cost of fixing defects at later a stage. What if you eliminated the defects during the development phase? How much earlier could you release a product if you only had to run your test cases once?
Thus, analysis of the defects at early stages reduces the time, cost, and the resources required. The goal is to gather the knowledge of how defects get injected and then develop methods and processes that enable the prevention of those defects. Once this knowledge is put into practice, the quality is improved, and it also enhances the overall productivity.
Here are some practices that can significantly improve software quality during the development process.
Clear requirements. I cannot overstress the importance of good, clear requirements. The requirements need to be fully analyzed by the design and test teams, so that there is clear understanding and agreement on feasibility and testability. There is plenty of evidence that shows at least 20 percent defects built into a product are due to poor or missing requirements.
Design reviews. Just as with hardware design, software products need to go through formal design reviews with a cross-functional team.
Static Analysis. There are plenty of tools available to provide a static analysis of your software, such as code coverage and complexity analysis. Understanding and managing the complexity of your software can save time and money. Reasons for measuring complexity include:
• You can achieve more predictability in managing software projects if you know the level of complexity of the code being maintained.
• You can lower the risk of introducing defects into production if you plan for and manage software complexity.
• You can lower software maintenance costs if you proactively keep your software from becoming excessively or unnecessarily complex.
• You can preserve the value of your software asset and prolong its useful lifetime if you keep it from becoming excessively complex.
• You can estimate when it is better to rewrite code than to keep maintaining it.
Controlled Integration. Most software defects happen at the interface points, that is, where two software modules communicate or pass information. These interfaces are often more difficult to code and more difficult to test, especially when different engineers write the modules that need to communicate. Do they have the exact same understanding of the requirements? This communication is also more difficult when these interfaces interact with a user environment that is minimally understood or controlled. Extra care and time spent on these interfaces during design can reduce defects later. Development should be structured using a building blocks approach. Care should be taken to introduce unknown functions/modules systematically in a controlled approach.
ODC. Orthogonal defect classification (ODC) is a tool that characterizes defect data used in defect analysis. ODC was developed at IBM in the 1990s by Ram Chillarege.5 It is a methodology that characterizes software defects and translates them into process defects. The intent with ODC is to analyze defects to determine root cause of the problem. Defects are categorized by attributes such as defect trigger, defect activity, defect type, and defect cause. ODC is a great way of providing feedback into the development team, for learning and preventing the same types of defects in future releases.
In Figure 4.2, the chart shows the different defect categories that we identified at the top of the chart. Across the bottom are the different points in the development process. The bars indicate the count for each of the defect categories found at each point in the process. This is where those defects were discovered (i.e., defect trigger). The value of ODC is to look at what can be done in the previous step to identify the defect earlier. At SanDisk, we called this the “shift left” approach.

Figure 4.2 ODC chart
Quality in Sales and Marketing
Typically, most quality improvement efforts are internally focused, and the sales and marketing teams are not actively engaged. I think that is a mistake.
Sales and marketing are the primary interface to your customers. They should have the most knowledge about customer expectations and the relationships. That said, there are some very specific ways for sales and marketing to be involved in quality improvement. We will take a closer look at the focus on customers in Chapter 6. But here are some key activities that can help to engage sales and marketing in quality improvement.
1. Voice of the Customer (VOC). VOC is a method for gathering information about your customers, in terms of their wants, needs, concerns, and business issues. The information can be gathered in a variety of ways, including but not limited to interviews, customer visits, surveys, focus groups, and feedback forms/e-mails.
2. VOC to PRD. The information captured in the VOC process then needs to be converted into clear product requirements. This usually takes the form of a Product Requirements Document (PRD).
3. Response time. Response time is always important to customers and it is measurable. Some customers require a service level agreement (SLA) to ensure specific response times are met for key items. Be clear on what is included and not included in your response time goals. It can include inquiries, request for quotes, sales order, fulfillment, follow-up, and response on issues/complaints. If whatever you decide to measure is inconsistent, take look at your process. Is there a process? Is it followed consistently? Is everyone involved trained on it?
4. Forecast. Forecasts are often difficult. This is especially true with small companies that do not have an established track record and new products that do not have historical data to work with. But forecasts impact many other areas of the company, such as the supply chain. How does procurement team negotiate the best pricing from suppliers if that cannot provide expected quantities? How can you perform capacity planning?
5. Customer satisfaction. Many companies do not formally measure and track their customer satisfaction. It is an important metric, but capturing the right data takes some thought. How do you determine the happy customers? Do you also follow up with unhappy customers? Lost customers? Make sure when you engage with customers for satisfaction feedback, the focus stays on quality and doesn’t turn into a business development exercise. Keep these two efforts separate. Develop questions to see how they feel about your level of quality. Quality questions around products, service, and the overall relationship are good areas to start.
6. Monthly/Quarterly Quality Review. A good way to build trust and confidence with your top customers is to plan regular quality reviews. These allow you to be more proactive, as opposed to urgent reactions to issues or problems. Partner with your lead quality person to show corrective action on previous issues, process improvement plans, data that shows trends that are hopefully going in the right direction. But if not, what you are doing to improve it? These types of reviews, if prepared for properly, can go a long way toward demonstrating to your customers that you really do take quality seriously.
Quality in Supply Chain and Operations
Supply Chain Quality
The supply chain has an important role in the outgoing quality of a product.
• Supplier Relationships. While it makes good business sense to have a backup supplier qualified for critical parts, there should be a primary supplier identified. The old style of managing suppliers was to squeeze them hard on price and delivery, then keep squeezing to drive down prices. That approach tends to build an adversarial relationship with your supplier. Is that really what you want? A better approach would be to develop a partnership, based on trust. Make sure they clearly understand your needs and you clearly understand their ability to meet those needs. Develop a relationship with them that benefits both of you. Treating them like a partner changes how you view them and also how they view you. Give them a chance to get to know your needs, your constraints, and your expectations. As you build these relationships, your suppliers are more likely to go that extra mile for you. What happens when you have issues? Or need something on short notice? You are much more likely to get the extra effort from a “partner” than you would from someone you’ve been beating up on price. You should always be looking to reduce pricing and costs. Establish your goals and then work on them together.
• Supplier Quality. Even after building a partnership with your supplier, there still needs to be accountability. This can be done with a supplier quality agreement. This type of document gives the supplier clear criteria on what your quality expectations are. A supplier quality agreement should have metrics defined that the supplier agrees to meet. But it should also define what happens when there are issues, how they will be contained, and your expectations for corrective action.
• Measure Everything. Consistent with the theme throughout this book, measuring what you do is critical for improvement. Using the methods and tools we have discussed earlier, there are three categories of metrics that apply to the supply chain: o Quality. Determine what the critical quality requirements are, such as yields, defects per unit (dpu), defects per million operations (dpmo), mechanical tolerances, and set appropriate goals.
![]() Time. Understand what time measurements will be important, such as cycle time, test time, lead times, on-time deliveries. Use the data collected to understand your constraints and drive improvements.
Time. Understand what time measurements will be important, such as cycle time, test time, lead times, on-time deliveries. Use the data collected to understand your constraints and drive improvements.
![]() Cost. What are your high costs? Materials (pricing increases, scrap), process (rework, retest, reinspection, unnecessary operations), or people (overtime, training)?
Cost. What are your high costs? Materials (pricing increases, scrap), process (rework, retest, reinspection, unnecessary operations), or people (overtime, training)?
• Traceability. Part of managing quality throughout the supply chain is having the controls in place for potential issues. It’s not easy to predict what issues may pop up. But building traceability into your process is good mitigation to have in case something does happen. For hardware products, it might be tracking critical components to a subassembly and or final assembly serial number or date code. For example, what if you receive a bad batch of controller chips that get built into your final product? By having your traceability in place, you can “contain” the issue to a specific set of serial numbers or a range of serial numbers. Not having that traceability could be a nightmare. It could be the difference between recalling dozens of products versus hundreds or thousands of products. Traceability also applies to software, by controlling and tracking releases and revisions. This allows you to notify any customers that may have the release/revision in question and quickly send them an update.
Manufacturing Quality
DfX. As mentioned in the hardware engineering section above, DfX, or Design for X, is important for quality. The X can be for manufacturing, assembly, or test. Before you actually move your product into production, save your manufacturing group some significant time and headaches. Have them work closely with your development team to design the product with volume manufacturing in mind. It is great to have an innovative product that is technically unique, and a jump above the competition. But if it is a nightmare to build and test, you have severely impacted your ability to deliver your product. The more steps it takes to build your product, the more opportunities to make a mistake. Similarly, if you failed to design in the proper test points or test capabilities, you cannot design a comprehensive test, or at least one that can be completed in a reasonable time. These problems get incrementally worse as your volumes increase. Spending the extra time during the design phase, can significantly reduce your cycle time and the opportunities for mistakes.
Here are some considerations for design for manufacturing/assembly:
• Minimize parts: combine multiple into one if possible.
• Modularize multiple parts into a single subassembly. Make it easy to assemble/disassemble.
• Allow for assembly to be easily accessible for a hand or tool to reach/maneuver.
• Provide easy orientation for insertion of parts using self-locking or alignment tabs, or clear markings for easy orientation.
• Standardize parts to reduce variety (e.g., using same size screws throughout).
• Design parts so they do not tangle (e.g., cables) or stick to each other (e.g. washers).
• Distinguish different but similar parts from each other by color or some other means to easily tell them apart.
• Prevent nesting or stacking of parts.
• If parts do need to be stacked, design so largest/widest part is at bottom and smaller parts on top (e.g., like a pyramid).
• Design mating parts for easy insertion. Design in allowances to compensate for dimension variation.
• Design so assembly can be done from top-down. Never require a product to be turned over.
• Minimize the use of fasteners (e.g., screws), where possible use snap fit designs.
• If fasteners are used, keep them away from obstruction. Allow proper spacing for fastener tools.
• Identify critical components that need tight control and high quality. Consider vendor selection, process capabilities (internal manufacturing and suppliers), and traceability.
• For part selection, consider availability, lead time, planned end of life, vendor selection, and creating a manufacturing part number. Also consider temperature restrictions and board flex restrictions.
• For components, consider cost/quality trade-offs for pick and place versus manual insertion.
• Design for inspection: define specification limits, special tools/gauges.
The considerations in design for test depend greatly on the type of product, as well as the expected volumes. For high-volume products, you are more likely to invest in test development and tooling that will save you cycle time and improve test coverage. For custom one-off products, you may need a different approach. Whatever your approach, better to plan for the testing during the design phase. Finding out that your testing is inadequate or will require a design change during production will be significantly more expensive than designing the proper test capabilities into to the product.
Looking to scale up a small business (or any business) can be both exciting and challenging. Often what worked for you in the early days or your initial release may not work as well at higher volumes. The stress of increasing volumes tends to break resources (people, processes, tools) if not carefully planned for. This can lead to missed commitments or defective products. Here are some suggestions, based on my experience working with multiple startups.
• Developing scalable processes. When you are starting out, a key person or two just know how to get things done. They work pretty independently and are able to make decisions on the fly. This is really helpful when you are starting out. But once you start growing and need more people to handle the volume, this approach becomes a problem. How do you know everyone is doing the work the same way? How do you know the decisions are being made consistently by different people? This leads to variation and a process that can quickly get out of control. Take the time to get your processes defined and understood by everyone. It makes it so much easier to scale.
• Bigger customers demand more. Starting out, just getting your product built and tested is enough for smaller customers that you hope to get feedback from. This works when you are dealing with proof of concept quantities. But once you start pitching to large customers and hoping to land some large orders, be prepared. Larger customers will want some assurances that you can be trusted to deliver—consistently. More importantly, they will want to see evidence. If you have put off documenting processes, collecting metrics, or putting a simple quality management system into place, be forewarned. This type of work doesn’t just happen overnight—no matter how amazing you think your team is. Waiting until you land that big contract to begin this work will be too late. Do not blow a big opportunity because of a lack of planning and preparation.
• Don’t just think about development and sales. Understandably, startups put plenty of focus on designing the product, marketing strategies, and proof of concepts. But even the most innovative products that fill a large need still need to be delivered. There needs to be a balance of resources between “product creation” and “product delivery.” If you haven’t prepared properly for product delivery, how do you expect to meet the demand? All too often I have seen so much attention (and resources) dedicated to development and sales. But when it comes to delivery on all those important orders, the operations team is set up for failure. If you have not staffed these functions properly, designed the product to be manufacturable, allowed them to fill the supply chain, provided them the tools and equipment needed to scale, how can you expect them to succeed? Once again, this is not something you can just “turn on” when you have that first big order. You should be building up your delivery capabilities at the same time you are developing your product and your sales pipeline. Make sure to allocate your resources equitably. Whenever there is an imbalance, it will cost you in quality, time, or both.
• Don’t forget about the support and administrative functions. Scaling can break more than just engineering or manufacturing. Think about all your company functions and systems. Think about what happens when you ramp up customers, customer orders, and staffing. You need to make sure that hiring, onboarding, ordering, billing, payroll, and all the other supporting functions are ready for the ramp up as well. Do you have enough automation and resources to handle the expected growth?
Process Control
Measuring and controlling your processes is important in all areas of your business. But unexpected issues in your manufacturing process could have a significant impact on your business. So, putting the proper controls in place to prevent surprises is paramount. Putting controls in place goes back to our GQM methodology. What are your goals, what questions need to be answered, and what metrics will help answer those questions? For manufacturing, some basic metrics to consider:
Yields. Yields will tell you how your overall process is performing. After collecting some initial process data (such as during an initial pilot run through the process), you can calculate the control limits. Then plot your data daily, weekly, monthly, or by build cycles. Calculating yields for your manufacturing test, would look like this:

You can also look at the inverse of the metric, which would be the percent defective (% defective):

Rolled Throughput Yield (RTY). RTY is a valuable measurement, as it gives you a collective measure of all your manufacturing steps. Let’s say your manufacturing process has these five critical steps, each with their own yield:
1. Post build inspection 95%
2. Bench test 93%
3. Postassembly inspection 97%
4. Functional test 92%
5. System test 98%
To calculate rolled throughput yield, you would multiple all these yields together:
RTY = 0.95 × 0.93 × 0.97 × 0.92 × 0.98 = 0.7726667 or 77.27%
This means your overall yield across the entire manufacturing process is 77 percent. This is important to know, because it tells you what your overall loss is for the entire process and how many extra pieces you need to build to achieve the final quantity needed. Here is an example:
Cost/piece |
Quantity Needed |
Passed |
Lost |
Required Build |
Added Cost |
$100 |
100 |
77.27 |
22.73 |
123.00 |
$2,300.00 |
$100 |
1000 |
772.67 |
227.33 |
1228.00 |
$22,800.00 |
As you can see, this starts to add up quickly. If all you are looking at is your final system test yield, you may consider your yield to be acceptable. If this is the case, you are missing all the costs associated with the earlier steps.
Defects per Unit (DPU). DPU is useful a product can have more than one defect. An example would be at an inspection station, where a single product could have a scratch, a burr, and a wrong component.

So, if you inspected 70 products and found a total of 122 defects, your DPU would be:
122 / 70 = 1.74
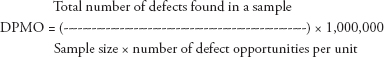
Defects per Million Opportunities (DPMO). This is another common metric when a product or unit can contain more than one defect. For this calculation, you will need to know the total number of defect opportunities. A defect opportunity is the total number of possible defects. For example, if each unit can potentially have up to five defects and we produce 100 units, our total defect opportunities would be 500. To calculate DPMO:
Manufacturing Readiness Review (MRR). Another method for managing and controlling your manufacturing process is to hold a manufacturing readiness review (MRR). This is similar to a release gate, to ensure all requirements needed for a successful production launch have been satisfied. This would include all dependencies or deliverables needed from both inside and outside the Operations team. A cross-functional team is used to review each deliverable and agree on the status. An example of a readiness checklist might include:
Requirements
• Design for Manufacturing (DfM) completed
• Design for Assembly (DfA) completed
• Design for Test (DfT) completed
• Mechanical engineering validation complete
• Electrical engineering validation complete
• Thermal analysis complete
• Assembly build time study
• New product design review with manufacturing/operations
• Manufacturing assembly instructions documented
• Manufacturing tools documented; samples provided
• Manufacturing test scripts updated for new product and verified
• Quality data plan complete
• Supplier quality plan in place
• Material review process defined to disposition defective/ obsolete material
• Packaging design plan in place
• Quality goals in place
• Agency/compliance testing is complete
• Environmental testing (shock/vibration) is complete
• Critical parts tolerance stack-up complete
• Supplier qualifications complete on new parts
• Capacity analysis for assembly is complete
• Capacity analysis for test is complete
• Manufacturing build pilot complete
• Manufacturing test pilot complete
As part of controlling the manufacturing process, you may periodically schedule a full or partial readiness review when there are changes made to the product or the manufacturing process. Examples of product and process changes could be:
• New or updated product software
• New supplier for a critical component or assembly
• Changes to the test process or tools
There are several different ways to trigger another MRR. Some examples would be:
• Design reviews
• Engineering changes to a product, software, assembly fixture, manufacturing process, packaging or the bill of materials (BOM)
• New testing software proposed for release
• New supplier to be added to approved vendor list (AVL)
Quality in Test Engineering
I stated previously in Chapter 1 that I believe it is incorrect to call a test function QA (short for quality assurance). It is very misleading in that it is such a narrow view of what the quality role should be inside of a company. But the term QA is so prevalent today, I do not expect that to change. Even though I feel QA as the only role for quality to be inadequate, that does not mean you can do away with testing. At least not until you have very mature development processes.
I have led many test groups throughout my career. But one particular development program stood out to me. This was at one of the larger companies I worked for, which happened to be very focused on total quality management (TQM) at the time. Early in the planning for this new product, I met with the head of the development team. I needed to put a test schedule together and was trying to estimate how many times we would need to go through our test suites before the product was ready to release. As we were meeting, we recalled that we found several issues in the previous generation product, as it moved from development to test (which was much improved from earlier generations where we found many issues after that transition). His response to me was, “Well, this time you won’t find any issues. We will make sure it is rock solid when it comes to you.” I’m glad I didn’t make a bet with him, because I would have lost. We really tried to beat up the product during our testing and it was in fact solid. I think we may have found one or two very minor issues, but nothing that required changes to the product or reasons for us to rerun our tests. Just to set the context for this accomplishment, the product was far from simple. This was the third generation of a very complex product that included hardware, robotics, storage, firmware, and management software. It remains my standard for what can be done when you design quality in from the start. As you might imagine, the product released on time (zero schedule slips), because we never had to go through that vicious cycle of “find and fix.”
I have always felt that testing needs to be tied to something. You need an anchor for your test development, so you don’t end of up with a collection of ad hoc tests. How do you know if you are adding good tests or bad ones?
The structured approach to testing that I have been very successful with is called requirement-based testing (RBT). Through this approach, we can clearly identify the functions and features of the product and how to best test them. With RBT, we also want to fully represent the voice of customer (VOC), as best we can, by understanding the operating conditions and environments under which the product will operate.
The requirement process and its associated change control process are therefore absolutely essential to be successful with the development a product. This requires a very proactive participation of the marketing organization to make sure that the VOC, which represents the high-level requirements for the product, is expressed thoroughly.
In today’s highly specialized world, it is very unlikely that an engineering organization is able to develop VOC requirements by itself, at least at the right level of detail. This is due to the fact that many products are integrated in very heterogeneous environments and have to cope with many different operational constraints. Therefore, the question of “what do we want to achieve with this product?” is more crucial than ever and requires a bullet proof process so that customer requirements can be successfully and efficiently implemented with feedback from multiple organizations. Without cross-functional feedback, the right questions may not get asked.
What Is a Requirement?
The first step toward understanding requirements management is to agree on a common vocabulary. Requirements in the context of product development are statements about the product (or service) you are developing. These statements should explain what the product is, what the product does, in what conditions or environments it should operate (or not operate). These statements should ultimately define what end user problem this product will solve or what condition(s) it will significantly improve. The success of the RBT methodology is directly proportional to the level of detail captured in the requirements. The requirements may start with the VOC, but should be thoroughly flushed out by sales, marketing, engineering, quality, and operations. Before development and test begin, you want to be convinced that the requirements clearly define the right product.
Benefits of Requirements-Based Testing
What makes RBT the right methodology for your business? If done early in a development program, you can expect the following benefits from RBT:
• Improved communication and increased accountability throughout the overall test effort
• An accurate scope of the test sizing through requirements analysis
• Requirement traceability through a documented requirements specification
• More accurate impact analysis for change management decisions with the requirements specification
• Efficient parallel testing, as a result of each group knowing their assigned requirements
• The assurance of test coverage and measurability of the requirements validation through the requirements scorecard
For RBT to work, a thorough analysis of the requirements is required. This involves breaking down each requirement into the lowest individual testable pieces and writing a test case for it. We called this “requirements leveling.” This included both normal (expected) paths and exception (unexpected) paths.
A simple example is shown here in Figure 4.3.

Figure 4.3 Requirements leveling
Another fundamental benefit of RBT is that it helps to answer the most common test question: “How do we know when we are done testing”? RBT allows you to answer this question by quantitatively measuring requirements coverage. Requirements coverage is accomplished by mapping test cases to requirements. This mapping provides traceability between requirements and the test cases needed to validate that requirement. So, when all the tests associated with a specific requirement have passed, that requirement can now be shown as complete. There is also the added benefit of using that traceability to manage control of your requirements and test cases.
If a requirement gets modified (as can often happen), you immediately know the test cases tied to that requirement need to be checked to make sure they still cover the modified requirement adequately. It can alert you that those test cases need to also be updated or additional test cases need to be added.
This method allows you track, in real time, how you are progressing with your testing activity. It makes charts like in Figure 4.4, easy to put together.
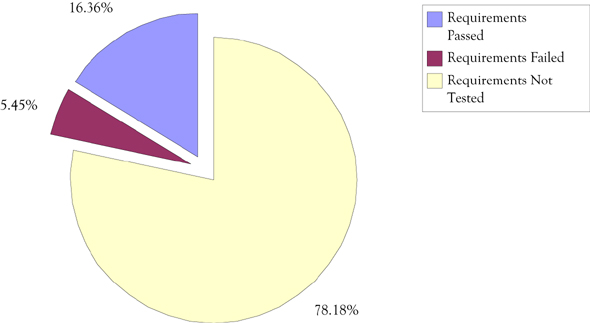
Figure 4.4 Requirements test status
We also built a scorecard that broke the requirements into the appropriate categories for better visibility. An example is shown below in Figure 4.5. The scorecard provides a method for assessing risk at any point in the process, by showing specifically the level of completion for each functional category. The scorecard can also be broken out by functional groups or individual testers, as well.
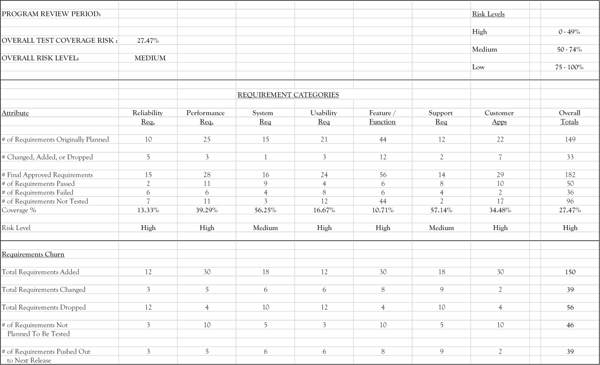
Figure 4.5 Requirements scorecard
RBT drives more parallel testing, as a result of each group knowing their assigned requirements to be tested (as long as the entrance criteria for each test function is met). It is an efficient “divide and conquer” type of approach that makes the test coverage clear. This facilitates a very measurable test process.
Finally, this methodology enables communication between the groups involved in testing while keeping the required separation between those groups. This is one of the main goals of a key entity called the cross-functional test team within an end-to-end test strategy.
Key Point
Requirements coverage is not the same as code coverage. Code coverage is a measurement of which statements in a body of software (code) that have been executed through a test run, and which statements have not. Requirements coverage is a measure of which product requirements have been validated and which have not.
Testing Lifecycle
The testing lifecycle closely parallels the product development lifecycle. The testing lifecycle provides a functional view of the process that is followed for any test activity undertaken. This lifecycle is intended to be used by each of test group or functions involved in the test effort. The key process phases are identified along with the key activities and key deliverables for each phase. The duration of each phase varies depending on the scope of product(s) under test. So, this same approach could be used in agile or in waterfall approaches.
The objective of this methodology is to add a measure of discipline and consistency to the test services performed from test group to test group. There is one final point to make on using this testing lifecycle approach. The amount of time you spend in each phase is dependent on the size of your test effort and your specific needs. It is more important to go through the thought process for each phase than to spend days or weeks documenting it. Just make sure to build whatever time you decide is needed for each phase into your schedule.
Using this test cycle discipline enables a more predictable and repeatable testing effort and better management of available test resources. Other advantages of using a testing lifecycle approach include:
• To establish consistency in techniques, terminology, tools, improved communication, and strategy across the test groups.
• Investment in the upfront requirements and planning phases provides large dividends during the execution phase, in terms of efficiency and effectiveness.
• By utilizing the same methodology, test groups are more likely to develop and maintain efficient and effective test processes.
• A well-defined model provides a means for training and developing new engineers, as well as when engineers move from one function to another.
• A common model provides management with a means for resource and product planning, scheduling, problem solving, and decision making.
Although execution is the most visible phase of testing, it is important to note that execution is only one step of the overall test process. Adequate time should be built into each program schedule to allow test groups appropriate time needed for requirements analysis, test planning, and test development (test tools/cases).
The following phase descriptions are intended as a guideline. The example shown below is for a hardware product but could be easily adapted for software testing. Utilizing these phases in this testing lifecycle will help with the planning and preparation needed for a productive and efficient test effort.
Test Phase 1: Requirements
During the requirements phase, the purpose of the test is defined. This is critical to the success of the overall test process as the tester cannot anticipate results nor satisfy the customer requirements without clearly understanding the purpose of the test. The requirement phase is when the tester gathers the necessary information to adequately plan the test. Also determined during this phase is the scope of the test. The scope sets boundaries around the test and specifically states what will and will not be tested, based on each test group’s role in the overall test process. Other factors considered during the requirements phase include specific test objectives, product contracts, functional specs, and time frames/ schedules.
Key Deliverables
A decision on the feasibility of performing the test, the test definition and scope are established. Dependencies and impacts/conflicts with other projects are identified.
Test Phase 2: Planning
During the planning phase, the test plan is developed. The focus is on determining what is required to perform the test (e.g., equipment, manpower, tools, facilities, and training), expected results, test schedules, writing appropriation requests for new equipment and risk/contingencies. As part of the test planning phase, the key assumptions and factors used as a basis for the test are documented in the test plan. A key part of the test planning process is the development of specific test plan and entry/exit criteria. The test plan is your roadmap to meeting your testing objectives, which should include purpose, assumptions, requirements, test approach, entry/exit criteria, and reporting.
Key Deliverables
Cost estimates, time estimates (test duration), entry/exit criteria, and the test plan are delivered.
Test Phase 3: Design
Phase 3 of the test process focuses on the actual test design. Depending upon the nature of the test, this may include designing, reviewing, and writing specific test cases; designing and building tools; beginning product and new technology training; defining test metrics, and developing procedures for test execution. Development should be involved in the review of the test designs and test cases.
Key Deliverables
Test tools, test designs, test cases, test procedures, and expected results are prepared.
Test Phase 4: Setup
The first part of this phase of the test process is the readiness assessment prior to starting the actual test. Are all the facilities and power in place? Are the test cases complete and debugged? Are the units to be tested available? Is all the required functionality available? Is product training complete? Is the required test equipment in place and functional? Are all the necessary support functions (i.e., problem tracking system) and procedures defined?
The second part of Phase 4 is the dry run or baseline test. This is the first time all the pieces are put together and tested out (e.g., test tools, units under test, procedures). It is the last chance to make changes before officially beginning the test.
Key Deliverables
Test personnel are trained, and engineering contacts and test environment are established.
Test Phase 5: Execution
The test execution phase is when product testing begins. During this phase the tester executes the tests, manages changes to the product, detects and reports problems, works with support groups to resolve problems, and provides test status. The execution phase may include multiple test cycles, based on the number of code deliveries from Development. Each additional code delivery (after the start of execution phase) may require some amount of regression testing to ensure previously run tests still pass.
Test execution (new testing and regression testing), test status, defect reporting, metrics, and risk assessments.
Test Phase 6: Closure
The test report is issued that includes test results, deviations from the test plan, conclusions, and recommendations for product improvement. Note: the test report should map to the test plan. It should confirm your approach and assumptions. If your results do not match would you expected, the report should explain why.
Key Deliverables
A final test report is delivered, and feedback is requested. A lesson learned review should be conducted to assess the benefits of the test and recommend improvements for future tests.
Test Phase 7: Sustain
The sustain phase of a product involves assembling a subset of tests that assure the integrity of all functions during the engineering change process. Sustaining testing occurs after the product’s release. As changes occur in hardware, system-level software, and firmware, the product is validated to assure reliable operation before release to customers.
Key Deliverables
Sustaining report and incident report are delivered.
V-Model
The V-model is used to illustrate how validation efforts align with the different levels of requirements and product specifications. Along the left side of the V, the different levels of requirements are shown. These requirements start at the top as high-level customer requirements and they get progressively more detailed as you move toward the bottom portion of the V where it is more likely to be low-level design specifications. The right side of the V illustrates the different levels of validation. Starting at the bottom of the V are low-level functional tests, which could be a specific function or component. Then going up the right side of the V, validation efforts become more complex—meaning more variables and environments are incorporated. The intent of the V-model is to show how different levels of requirements are related to different levels of testing. This can be shown visually by comparing a requirement level on the left to the corresponding validation effort, by going straight across the V from left to right. This can be seen below in Figure 4.6.6 These levels of tests provide different test perspectives, each tied to different levels of requirements, which can be coordinated through RBT. This results in a more comprehensive test effort. From a timeline perspective, each level of test is designed to build on the maturity of the previous level. While some planned overlap between levels is expected, running these phases in parallel can result in “thrashing” because the product may not be mature enough for that next level of testing. Jumping ahead can waste time and resources and usually causes a much longer overall test process. Additionally, it is not helpful to the development team if multiple testers are reporting the same issues. This can be avoided by developing clear entrance criteria for each phase of testing and sticking to that criteria.
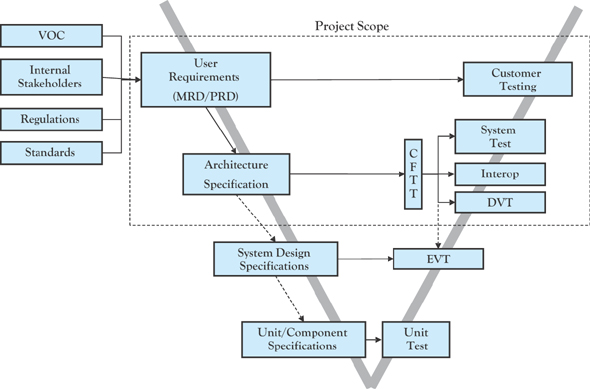
Figure 4.6 V-model
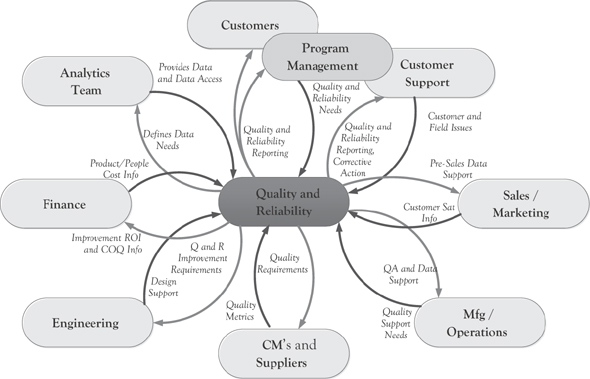
Figure 4.7 Quality and reliability engagement
Quality and Reliability (As a Functional Group)
While I have mentioned throughout this book that quality should be everyone’s job, there is still a need for a core group of expertise that helps develop, teach/coach, and lead the multiple efforts needed to developed and achieve that shared vision. The quality and reliability function should be highly visible and not buried deep under an engineering or operations function. In other words, they need to be seen and heard, as much (or more so) than the other key functions.
Ideally, a quality function becomes the hub that connects all the other functions together and leads everyone toward that shared vison of quality. This is illustrated in Figure 4.7.
Leading Quality
Leading quality today may be as challenging as it has ever been. As the workforce continues to turnover from generation to generation, much of the knowledge from the original quality gurus has been lost or forgotten. So have the lessons for developing a comprehensive view of quality that involves the entire company. In too many companies, the very aspect of using quality as a competitive advantage have been watered down to “testing quality into the product.”
I think the biggest impact that someone responsible for quality can do today is to educate. How many companies know what their cost of nonconformance is? How many companies know how much time and money they could save if they really focused on the processes and training to do things right the first time.
Someone needs to have the knowledge and experience to differentiate between all the various acronyms that get tossed around whenever the idea of improvement comes up (e.g., TQM, LSS, CMMI, PDCA, TPS, COQ). There are so many ideas and methodologies to sort through. One size does not fit all. Unfortunately, the decision on which method should be used for improvement is often decided by someone that has little or no quality experience. The best approach would be to hire or bring in someone that has experience in all, or at least most, of these methodologies. Let them work through the type of process we have been discussing throughout this book and develop an understanding for the needs and issues. Then let them use their experience to develop a plan for improvement. What if TQM would be a much better fit for your specific needs than Six Sigma? What if a combination of methods would be best? Jumping into the only method you know of is like the old saying, “If all you have is a hammer, then everything looks like a nail.”
There is an enlightenment that needs to take place before real improvement can start. The quality leader needs to create that sense of urgency. Until you have earned the legitimate interest of the executives, the models and methodologies do not matter. Crosby called this the “awakening” stage.
In his 1979 book, Quality Is Free,7 Crosby introduced his quality management maturity grid. While many of his concepts are just as true today as they were back then, I have modified the grid shown in Figure 4.8 to have the explanations and impacts be more in line with current organizational structures.

Figure 4.8 Quality management maturity grid (modified)
As part of the modification to this grid, I have added a cost of poor quality example for each of the phases, As you can see, the better control you have over quality costs, the less you spend on poor quality activities.
Quality Versus Reliability
Although they sometimes get used interchangeably, quality and reliability are different. While related, there is a time element that separates them. The quality of a product is measured prior to a customer’s initial use (as received). However, product reliability is measured throughout the customer’s use of the product. Here are some distinctions:
• Quality is based on the present (today) while reliability is based on the future.
• Quality can be controlled and measured with accuracy, while reliability is based on probability. We can ensure better reliability by controlling the quality.
• Quality is everything before it is put into operation time(t)=0 hours, while reliability is everything that happens after (t)=0 hours.
• Quality is a static measure of a product meeting its specification, whereas reliability is a dynamic measure of product performance over time.
• You buy based upon quality. You come back and buy again based upon reliability.
• From a reliability perspective, there are three distinct phases over the life of a hardware product, shown in Figure 4.9. These three phases are typically referred to as the bathtub curve.
Infant Mortality. This is when the product is new and there can be early failures (i.e., manufacturing issues, weak components) that should be removed through maturity of your product and processes, before sending to your customer. A typical method for removing weak components and improving maturity is called “burn-in,” where the product is run under stress (e.g., mechanical or temperature) to identify issues and drive improvements before shipping to customers.
Useful Life. This is when product has become mature and over the useful life of the product should experience only random failures (i.e., no particular pattern or trend) that occur within the expected failure rate. This is often referred to as “constant” fail rate. The useful life failure rate should be significantly lower than the early failure rate and remain in that “constant” range, based on your design and processes. The exception would be “special cause” failures, that is usually due to a change in your design, supply chain, or processes.

Figure 4.9 Reliability bathtub curve
Wear Out. Wear out, just as it implies, is when the product is reaching the end of life and parts begin to wear out. Understanding how your product follows this curve allows you to retire products before the failure rate significantly increases.
Hardware Versus Software Reliability
The primary drivers of hardware and software reliability differ in that hardware reliability, shown in Figure 4.10,8 is driven by stress or wear applied to components that stimulate physics of failures; while software reliability, shown in Figure 4.11, is driven by changes to the product or process. This can include changes to procedures, requirements, coding, and test processes.

Figure 4.10 Hardware reliability
The spikes in the software reliability curve are typically tied to new releases or updates, as a result of the changes mentioned above. As these updates get exposed to the user base, there is often a small spike of issues that eventually levels off until the next update. There is also the consideration that even when updates are available, it is up to the customer on when they will adopt them. While looking at updates is one view, it is also important to consider software reliability from a time to failure perspective. This looks at new bug discovery and the probability that a given product will fail over time.

Figure 4.11 Software reliability
Ultimately, the one common factor between hardware and software reliability is the dependency on good development disciplines.
Other Quality Roles
Quality Dashboards and Reporting. Once a quality vision and goals are established and measurements in place, sharing the information across the company is important. Using some type of online dashboard is an effective way to disseminate that information. More on this in Chapter 8.
Executive Quality Reviews. Having a standing meeting (weekly or monthly) with executives is important for the following reasons.
1. It provides an opportunity to share and ensure understanding of the dashboards and reports on a regular cadence.
2. Sharing progress on your quality vision and goals is essential to maintain executive commitment and engagement.
3. These reviews are an opportunity of to keep executives abreast of the top-quality issues (and the costs associated with them), as well as the corrective actions needed, and any resources or assistance required to complete.
4. Any critical decisions or prioritizations that are needed to address corrective actions can be made immediately.
Corrective and Preventive Action (CAPA)
While all efforts should be taken to focus on prevention of issues, it is inevitable that some issues will still occur. This is especially true while you are early in your quality journey. Corrective and preventive action (CAPA) is a method for driving improvements into your processes. It is typically a component of your quality management system (QMS).
Corrective and preventive action aspects of CAPA have traditionally been connected, but there is a significant difference between the two:
Corrective action is the elimination of the cause or causes of an existing nonconformity or undesirable situation in order to prevent recurrence.
Preventive action is the identification and elimination of the cause(s) of potential nonconformities in order to prevent occurrence.
A CAPA process involves the identification, documentation, and elimination of the root cause of a nonconformity or problem to prevent the problem from recurring. A formal corrective action report is typically required under more intense conditions than a typical improvement. Some customers may require a formal corrective action report as a response to an issue they have experienced with your product or service. Most corrective action procedures use a variation of the 8D (eight disciplines) problem-solving approach. The following are the typical steps in a corrective or problem-solving process, such as eight disciplines (8D):
D1: Select a team—Select and establish a team of people with product/process knowledge.
D2: Define and describe the problem. Specify the problem by identifying in quantifiable terms the who, what, where, when, why, and how.
D3: Develop a containment plan; implement and verify interim actions. Define and implement containment actions to isolate the problem prevent it from reaching any customers.
D4: Determine, identify, and verify root causes and escape points. Identify all applicable causes that could explain why the problem occurred. Also identify why the problem was not noticed at the time it occurred.
D5: Choose and verify permanent corrections for the problem or nonconformity. Quantitatively confirm that the selected correction will resolve the problem for the customer.
D6: Implement and validate corrective actions. Define and implement the best corrective action(s). Provide evidence that the action(s) worked.
D7: Take preventive measures. Modify the management systems, operation systems, practices, and procedures to prevent recurrence of this and all similar problems.
D8: Congratulate your team. Recognize the collective efforts of the team. The team needs to be formally thanked by the organization.
Customer Quality Reviews. There are typically two reasons for holding reviews with customers. One is reactive and the other is proactive. Issues are going to happen. You may be requested by a customer or customers to explain why that issue occurred and what you are doing about it. That is the reactive approach—having a review when a customer requests it. Alternatively, you can establish a monthly or quarterly review with your top customers. These reviews take some time, but they are proactive in nature. You can use these reviews to show quality data on how your products/services are performing, including trends and improvements you have made or are making. This builds the relationship and builds trust. You can still address recent issues but doing so in a regular review cycle is less stressful on your relationship with those customers.
Quality in Customer Support
As a primary interface to the customer, Customer Support can play a key role in quality improvement and customer satisfaction.
Response Time
When you call a support line for any type of support for any product or service you purchased, you expect to get a quick response when you file a complaint on a product. Whether you talk to a real person or you fill out an online form, don’t you want to get your question or issue addressed as quickly as possible? Poor response time is a big dissatisfier for customers. The only thing worse than having an issue with a new purchase you have made; it is going through multiple hoops to get the issue reported and resolved.
Decide what a responsible response time is for you and clearly communicate that commitment to your customers. Make sure that response time is achievable for your type of product and industry. Then establish a service level agreement (SLA) with your customers. Do not leave them guessing at when they should hear back from you. This is a key metric for customers. Be proactive and provide this information up front. Collect the data and strive to reduce your response times.
Root Cause Analysis
There is nothing more frustrating (or infuriating) than to have the same issue happen a second or third time. Root cause analysis (RCA) is critical for issues, especially those seen by customers. The only way to truly eliminate an issue is to determine the actual root cause of the problem and develop a fix or solution so that it never happens again. While the support team is likely not responsible for failure analysis, they can insist that the issue gets analyzed to root cause. They will likely have to explain it to the customer.
5 Whys. One simple approach to reaching root cause is the “5 Whys” method. By repeatedly asking the question “why” (five is a good rule of thumb), you can peel away the layers of symptoms, which can lead to the root cause of a problem. Very often the perceived reason for a problem will lead you to another question. Although this technique is called “5 Whys,” you may find that you may need to ask the question more or less than five times before you find the root cause for your specific problem. The method is remarkably simple. Essentially, you keep asking why until you determine the absolute root cause. When you get to the point you cannot dig any deeper, you follow it through with a resolution that prevents the issue from recurring.
Quality in Program Management
A Program Manager’s Role in Quality
A real-life example can help illustrate how a program manager (PM) can impact quality. Let’s say we are developing a new product. The PM pulls together a cross-functional team to start the planning. The team consists of representatives from each of the functional areas. As the product requirements get rolled out, the team starts to create their plan. The PM works with each member to define their tasks and resource requirements and estimate a schedule for their portion of the program.
A rolled-up program budget and schedule are submitted to executives, based on time, cost, and resources needed from all the functional groups involved. The time, cost, and resources are based on a defined scope (i.e., product requirements) and hopefully an agreed-to standard for quality. Once the plan is approved, the program team moves forward with the development and release of the new product. The program now has an official start date and an official end date or release date.
But what if not everything goes as planned? What if the scope of the program begins to change, such as new requirements being added? What if the design was more complex than originally thought? So, now instead of taking 8 weeks for development, it may be closer to 12 weeks? What does the PM do? Were the risks previously identified with the proper contingencies built in? Do you push the out the release date? But what if you have already committed that date to a key customer? Or, multiple customers?
These types of situations happen all the time. It causes some ugly trade-offs. Do you cut back on testing to meet the committed date and compromise quality? Do you add additional test resources to compress the test time? Although this can also impact quality, by adding new resources that may not know the product and the test tools. Do you drop other features to add the new features and hope it does not create other problems? What if the product is complete, but the test team is completely overwhelmed with the high number of issues they are finding? Or, what if engineering cannot fix them fast enough to meet the schedule? There is no easy answer. The PM and quality lead need to quantify the risks (and the impact of those risks) and present a recommendation to management. At least one of these factors from the original plan will be impacted. Will it be:
• Quality?
• Scope?
• Time?
• Cost?
• Resources?
• Customer confidence?
These exact situations are where you really find out about your commitment to quality. Given these types of circumstances, the right thing to do is to give your team the needed time to do it right. If that means you have a tough conversation with your customers on previous commitments, then so be it. Be honest and tell them you ran into issues and the product is not quite ready. It is much better to be honest with them upfront and tell them product is not meeting your quality standard than it is to ship the product before it is ready. If you choose the latter and they find the issues, they will conclude that you have no quality standard. Or at the least, one that is inadequate.
There is an ongoing debate on two popular methodologies, agile and waterfall. Waterfall is the traditional approach that is based on program phases. However, more businesses are now moving to agile, which is intended to be more flexible and responsive.
A great comparison of agile versus waterfall was provided by Arnold Okkenburg.9
Agile Versus Waterfall Comparison
Table 4.1 summarizes some of the differences between agile and waterfall identified by Okkenburg.
Table 4.1
Waterfall |
Agile |
|
Requirements Definition |
Clearly defined requirements, reviewed before starting design. |
Maintain a high-level product backlog and requirements defined as the design evolves. |
Planning Approach |
Emphasis on planning before starting design. |
Plan progresses over sprints. Tend to defer planning decisions. |
Scope Control |
Scope is managed through control of requirements. |
Change is expected as user needs change. |
General Perceptions
Process. Waterfall requires too much paperwork and is a cumbersome process. The reality is that you can define a process that has the appropriate level of control desired and design a sufficient level of flexibility into the process.
People. Waterfall has no empowerment and agile has empowered and highly motivated teams. The reality is that you can create a level of empowerment that is consistent with the control and the capabilities of the team. You can use the appropriate management/leadership to maximize motivation in either model.
Customer. Waterfall emphasizes documentation over working software and agile emphasizes working software over documentation. The reality is you can develop a customer collaboration approach the balances customer engagement against control of requirements. Instead of creating documentation because that is what you have always done, use documentation to fulfill a real need.
Planning. Waterfall has heavy focus on following a plan and agile focuses on responding to change rather than following a plan. The reality is you can choose the level of planning for either to manage risks with an appropriate level of change control.
Some key recommendations from Okkenburg:
• Don’t force-fit your business and projects to a methodology.
• Don’t assume that you need to pick a single methodology.
• Don’t destroy the methodology to fit a business culture that you know is dysfunctional.
• Do use agile as a catalyst for positive business change.
• Do tailor the appropriate mix of methodologies and practices to fit your business and products.
In my experience, I have seen both successful and unsuccessful use of waterfall and agile methods. As with anything, it depends the implementation and the people involved. For the sake of full disclosure, I admit that I have a bias toward waterfall. This is partly because I have more experience with it and many of the tools, I have recommended were designed for it. However, these tools can be easily adapted to work just fine with agile. I do have experience with agile development and I am completely confident that agile methods can work as well or better when the proper disciplines are adhered to.
Personal Observations
1. Agile works best when the development team is closely tied to the customer. When you have many customers and the development team has no direct connection or communication with them, agile has been less effective in my experience.
2. Even though agile is intended to be adaptable and quick to respond to changes, it is only as good as the discipline used by the development team. To this point, I have seen three major problems with an agile implementation and more importantly, I have seen this at multiple companies:
(a) While agile is intended to be highly adaptive, collaborative, and have direct feedback with the customer, I just have not seen this in product-based companies. Maybe this works well when developing a website or custom software. But when you have a large or hope to be large customer base, it will be difficult for the development team to get direct feedback on portions of functioning code.
(b) There is a disconnect when the development team is developing using an agile development process, but the rest of the company is working to a typical waterfall-like product development process (see Figure 4.13). So, all the program schedule deliverables are based on program phases, but the development team is working in a vacuum using their agile sprints. Nothing lines up exactly and deliverables get out of sync. This most often happens when there is a hardware component and a software component that makes up the final product. Most hardware efforts cannot adjust to changes as quickly as software can.
(c) While agile is intended to be less about planning and more about responding to change, undisciplined development teams use agile as an excuse to not document anything. They want to work in a vacuum and be “left alone” to do their creative work. Look back to an earlier chapter that showed a real-life example of a product defect that cost the company $11 million. That issue came out of an undisciplined agile development process that was disconnected from other functional areas.
A pure waterfall approach is not without its own issues. As Okkenburg clearly stated, it takes the right balance of discipline and agility. Issues with the waterfall phased approach:
1. Putting so much emphasis on documentation and document control, bogs down the entire product launch process, not to mention creativity. You need to stop and ask yourself—“what is needed” versus “what do we want—just in case.” Or ask yourself “do we need this because that’s what is needed or because that’s what we’ve always done”? The need for documentation should be determined by a cross-functional team. While it may not be important to the developers, it may be particularly important to functions like test, support, and operations. Do what is right for the entire program.
2. If you do allow yourself to get so bound by (unneeded) documentation, introducing a change becomes a time-consuming and convoluted process. Typically, when there is extensive documentation, there is also the requirement for lots of signatures. This quickly becomes the direct opposite of agile. So be specific about what is needed and how it is handled and streamline the approval process as best you can.
Process Gates and Checks
In those companies that do use a waterfall approach, the program manager (PM) is responsible for the phases and can contribute to improving quality by holding the program team to meaningful gate criteria. Typically, there is a gate review between each of the phases as shown below. Depending on the size of the company and the size of the project, you may choose not to have a review at every phase. Where there are gates, the PM can help to make sure there is valid criteria for each gate and that it is verified before a program moves on to the next phase. Allowing a program to move into the next phase based on a date is detrimental to your program and usually costs you more time and money in the long run. An example of program phases and program gates shown in Figure 4.12.
Work Breakdown Structure (WBS)
The work breakdown structure (WBS) defines the scope of the project and breaks the work down into components that can be more easily scheduled, estimated, monitored, and controlled. The idea behind the WBS is to subdivide a large complicated project into smaller tasks, until you reach a level that doesn’t make sense to further subdivide.

Figure 4.12 New product program phases
From a quality perspective, a WBS can help to provide a more accurate and realistic estimate for getting work done. The PM can work with individual program members to create a WBS for their portion of the project. This helps the PM build a more accurate project level plan. An example WBS shown in Figure 4.13.
Resource Loading
Manage resources realistically. Don’t load people up to 125 percent utilization and expect them to get their tasks done on time. If you want realistic schedules, be conservative when loading an employee’s task time. Plan a resource to be loaded to no more than 80 percent to complete 32 hours of planned work each week (40 hours of capacity), or 6 hours a day. The other 8 hours that week would be spent doing other work that was not planned or isn’t related to the assigned project (e.g., training, department meetings, administrative tasks, etc.). It all depends on your day to day work environment and how many things an employee must juggle.
Figure 4.13 Work breakdown structure
Quality in Finance
If you choose to make cost of quality (COQ) your primary metric, it is essential for the finance team to work closely with the quality team to gather the data and present the results of your improvement efforts.
Cost of Quality. To implement a meaningful COQ effort, the right data needs to be collected and organized into the right buckets. The quality and finance teams need to be in sync on this. The worst case would be to have quality present their COQ findings and have finance disagree with the results. Both teams need to work together on the approach, data capture, and reporting. At a high level, there should be four main buckets: prevention, appraisal, internal failures, and external failures.
If this is your first time looking at COQ, I can tell you from experience, you are almost certainly not collecting all the data you will need. You may be able to pull together some prevention costs (e.g., design review hours, training classes). You may also have some of the costs associated with external failures (e.g., replacement costs). But for many of the costs, you will need new mechanisms to be put in place. This would include costs such as the hidden costs shown previously in Figure 3.10.
ABC for COQ. Many of the costs associated with COQ are based on activities. This could include value-add activities (e.g., developing a requirements specification), as well as non-value-add activities (e.g., retesting a product that previously failed). A method that can be used to tie costs to activities is activity-based costing (ABC). It would be nontrivial to convert your accounting system over to ABC if you are currently using a traditional accounting system. But there are aspects of ABC that can be incorporated with some basic timekeeping. This can be done in a spreadsheet to start and later incorporated into a simple database or time tracking tool.
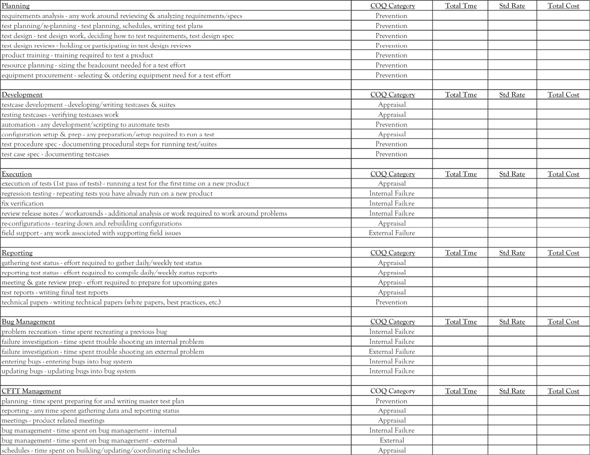
Figure 4.14 COQ time tracking
In Chapter 3, Figure 3.13 shows a spreadsheet that captures time for the different activities within the four COQ categories. Multiplying the total man-hours times a standard salary rate for that position gives you a cost for those activities.
We used an internally developed database to capture time on the different activities for a test organization. We had specific activities that we defined, so we better understood where we were spending our time, in terms of cost of quality. The goal was to start putting more effort toward prevention and reduce the time spent on failures. Having the data in a database made it easier to summarize by activity, COQ category, by position, or even by employee. We developed a simple interface that made this quick and easy for employees to enter their time at the end of the week. The specific activities we used for test are shown in Figure 4.14. I worked closely with our finance person to set this up. I used the data to drive improvements in our testing and she used the data for her finance reports.
Improving Finance Processes
The other way that finance can contribute to improving quality is to look at their own processes. Much like quality, finance touches every function across the company. So, both the efficiencies and inefficiencies are felt by everyone. Here are a few improvement opportunities for the finance group to consider.
1. Review your processes. There are many processes used by a finance group (e.g., purchase orders, payroll). Walk through those processes. Is everyone involved aligned on how the process currently operates? If you are consistently getting questions on the processes, there is either a training issue or the process it too complex.
2. Challenge the way it has always been done. Don’t keep doing things the same way, just because that is how it has always been done. Are there new and better ways to get the work done that are more effective and efficient?
3. Reduce complexity. Complexity leads to errors and mistakes. Look for opportunities to simplify. This includes eliminating waste, such as repetitive or unneeded steps.
4. Minimize manual data entry. The more manual data entry, the more opportunity for mistakes. Where you can, try to automate. But be careful. Make sure the process is solid before you automate. Automating a bad process, just results in creating errors faster.
5. Minimize approvals. For both small and large companies, waiting on countless approvals adds delay to getting things done. Do what you can to streamline the approval process. Set a goal for turnaround time and then measure it.
6. Minimize deadline emergencies. Accounting deadlines impact other activities. Try to plan for critical deadlines ahead of time. Develop a schedule and communicate it, so everyone knows in advance with deliverables are due. This should minimize those last-minute fire drills.
Human resources (HR) can play a significant role in quality improvement. Using the sustainable quality model, the foundation needs to be built on a culture of quality that embraces change. HR should own the process control for how that culture is doing. By that I mean, continuously monitoring and reporting on how the culture is doing and feeding that back to the management team.
There are all the standard responsibilities that HR is responsible for: talent acquisition, compensation, benefits. Those are all critical functions that are needed. But in addition, I do believe there are ways that HR can directly contribute to the quality effort.
1. Culture assessments. One way that HR can monitor the culture is to periodically use some type of culture assessment tool. Collecting and analyzing the data from these assessments can help you identify areas that may be drifting away from your desired targets. There are many culture assessments tools out there, from simple to much more sophisticated. You can decide how in depth you want to get with these assessments. I have created a culture assessment tool that aligns closely with the sustainable quality model. Please feel free to reach out to me to discuss further if interested.
2. Training plans. HR can help to take a global look at the training needs and help set the guidelines for how that information is captured and summarized. If there are high demands for specific skills, HR may be able to help coordinate cost-effective training across the company. For companies that want to be ISO-compliant, training records are a required quality record.
3. Overtime. Another area that HR may want to monitor is the amount of overtime being worked. This may vary greatly by groups and even individuals. While some amount of overtime is expected or even required, this needs to be managed so not to burn people out. Set up some policies or rules, so that individuals working long hours get periodic reprieves to rest and reload. There will be less frustration and they will likely perform better.
4. Structured interviews. I am a big believer in using structured interviews. Having a structured approach for how interviews are conducted will make them more effective and provide quantifiable results. What you put into interviews is what you get out of them. Very often in the tech world, people are so busy with their day to day activities, that they may not have the time to think about their interview until they are walking over to meet the candidate. Similarly, gathering feedback from the interviews in a timely manner can also be challenging. With a little pre-planning, you can have a much more effective interview process. We will talk about structured interviews more in Chapter 9. But this is certainly an area where HR can take the lead in setting up a consistent and effective interview process.
5. Onboarding. Another area where HR can take the lead is to establish a process for onboarding new employees. Hold the hiring manager accountable to have a plan. Create a checklist and make sure the new employee has the equipment and access they need. Make sure the manager provides the proper work guidance on what is expected over the first couple weeks. HR can help make sure all these items are in place before the new employee arrives.
6. Turnover. Anytime you lose an employee there is a cost. In fact, the cost to replace an employee can be as high as 50–100 percent of their annual salary. HR should work with the manager to get to the root cause of why that employee left. It may require digging a bit deeper than what is discussed on the surface. But to improve your retention, getting to root cause is important. Is your compensation not competitive? Are there not enough growth opportunities? Are the hours too long? Do you have a manager that is causing employees to leave?
7. Career Planning. Career planning ties back to the development plan in some ways. But development plans should be specific. Sometimes employees, especially those that are new to the workforce, just need help with the big picture. What are the possible career paths? Assisting an employee with some career guidance and coaching can help provide them with a sense of direction. Because they are not locked into a departmental view, an HR person may have a broader view of the workforce than a first level manager.
8. Independent Employee Advocate. Sometimes an employee just needs a safe place to turn to. Certainly, there are policies and procedures that need to be adhered to. But if there is harassment or bullying going on, an employee needs to know there is someone that they can talk to without bias or repercussions. There must be an element of independence between the HR and management. HR will not be trusted if they constantly side with management.
1 Tassey (2002).
2 Thorson and Wurst (2018).
3 Humphrey (2008).
4 Whittaker, Arbon, and Carollo (2012).
5 Lyu (1996).
6 INCOSE (2007).
7 Crosby (1979).
8 Tobias and Trindade (1995).
9 Okkenburg (2012).