
1
Tribological Assessment on Accelerated Aging Bones in Polymeric Condition
Ramdziah M. Nasir Law C. Gan and Abdul Y. Saad
University of Science, Malaysia, School of Mechanical Engineering, Engineering Campus, Nibong Tebal, 13400, Penang, Malaysia
1.1 Introduction
The global trends of doctor‐diagnosed arthritis and osteoporosis show a dramatic increase. According to a statistical survey by the Centers for Disease Control and Prevention (CDC), the percentage of adults suffering this disease has gradually increased for both women and men, especially the aged, as shown in Figures 1.1 and 1.2 [1]. Lack of exercise in daily life, obesity, and family‐inherited genetic problems are the main causes of the disease.

Figure 1.1 Sex‐specific prevalence of doctor‐diagnosed arthritis, National Health interview, from 2007–2009 [1].
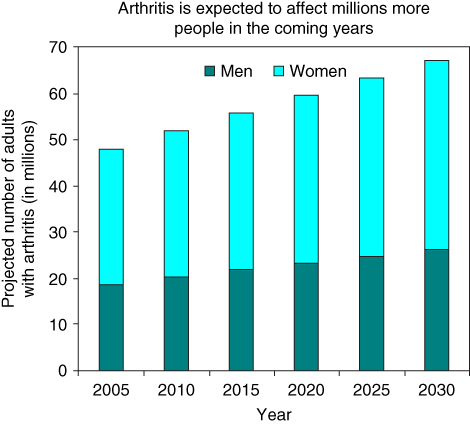
Figure 1.2 Projected prevalence of doctor‐diagnosed arthritis among adults 2005–2030 [1].
Recently, there has been much effort by researchers toward improving bone defects – for example, the transplant of scaffold for regeneration of new bones. However, most of the research is focused on the strengthening of defective bones by using the replacement method. There is a possibility to research on transplant of stronger bones from one person to another in the near future.
The first stage is to observe the changes in properties of stronger animal bones at different conditions that include temperature and relative humidity (RH). Research on human bones can help determine the factors that can strengthen the physical properties and enhance the elemental properties of bones. This project will study animal bones such as bovine and goat bones for strength and simulate the similarity between human bones and animal bones in terms of accelerating aging factors and conditions. The work will focus on selecting the most suitable animal model for the study to simulate human bones and to assess how daily activity and load bearing affect the properties of animal bones. Parameters such as temperature, hardness, and tensile forces that affect the properties of animal bones are assessed by comparing the structural changes of two samples of bone before and after exposure to different conditions.
1.2 Bone
In order to determine how the various environmental factors can affect the properties of the selected animal bone model, the basic knowledge of the composition of bones must be revisited. Much work has been done to explore how the various types of bones react in various environments. Bone is a composite that consists of minerals (calcium phosphate or hydroxyapatite) and protein (collagen) in a hierarchical architecture [2]. Approximately 20% of bone consists of water; 35% of the dry bone material consists of collagen, proteins, and glycosaminoglycans [3] and the remaining consists of other hybrids of organic and inorganic substances.
Basically, bone not only provides robust mechanical support for the whole human body but also protects the various organs from external impacts. The mechanical properties of bone are good owing to its strong structural hierarchical architecture in the human body, built with strong and stiff minerals and weak and soft proteins [2]. In the past, Isaksson et al. [4] reported that majority of mammal bones are similar to one another except for the presence of plexiform bone in large mammals such as pigs, cows, and goats [5]. Plexiform bone is primarily found in large rapidly growing animals and offers increased mechanical support for long periods of time. It is reported by Pearce et al. [6] that there are a few animal models that are suitable for use in testing of orthopedic and dental implants prior to clinical use in humans. Frequently used bones include dog, sheep, goat, pig, and rabbit models for the evaluation of bone–implant interactions. There were some minor differences in bone composition between the various species and humans. The pig has a good likeness with human bone but difficulties arise due to its size and ease of handling. So, the dog and goat were chosen as better animal models for testing of bone implant materials. Moreover, Pearce et al. [6] had proved that goat is the chosen species for 8.2% of animal studies published in the Journal of Orthopedic Research between 1992 and 1996. In comparison with sheep, goats tend to have a more inquisitive and interactive nature, which can make long time confinement easier than with sheep. Besides, in the Southeast Asian region, which has high temperature and humidity, goats are more tolerant toward ambient conditions than other species. According to biomechanical consideration of animal models used in tissue engineering, a small difference is apparent in the ashes density between goats and humans. This indicates that there is not much variation between anatomic sites of the same species. Besides, the goat has the same mineral composition as humans. Prothero et al. [7] had studied the attributes of hoofed mammals whereby the tarsal of the foot of the cow can be compared to the human foot. At this point, they had started to observe the structural and functional similarities between cow’s leg and the human foot.
According to ASTM E8, strip materials commonly used for tensile testing are in dog bone shape, with wide ends and a narrow middle [8]. According to ASTM [9], conducting the experiment and performing the milling process by using bone samples of “dog bone” shape for the bone‐shaped tensile specimen can lower the ultimate force at failure, which can reduce the stress concentration in the grips and concentrate failure in specific area for brittle mass. Besides, Subit et al. [10] had discovered that the gradual taper allows for a smooth transition of load distribution from the edge to the center. So, it can reduce the possibility of stress concentration from the sample edge and focus the failure in the gauge section of the sample. There were a few studies by the researchers on RH testing. Ajadi and Sanusi [11], Huynh et al. [12], and Karr and Outram [13] had studied the effect of RH on oven temperature of solar cabinet dryer. There were a few studies on tensile tests on bones [14–22].
In general, [22–25] have conducted nano‐indentation on bovine specimen surface, with a surface contact force of 30 mN and a constant loading rate of 2000 μN s−1. The hardness depression was held for a period of 5 s at the maximum load to eliminate creep behavior, before unloading at the rate of 2000 μN s−1. Rho et al. [26] also have performed nano‐indentation using nano‐indenter II, which is a fully automated hardness testing system. The load and displacements of the indenter used were 0.3 μN and 0.16 nm respectively. Sharp Berkovich diamond indenters, a three‐sided pyramid with the same area‐to‐depth ratio as the Vickers indenter, were also used. They reassessed the elastic modulus and hardness of secondary osteonal and interstitial bone through the cortex of human femora of various ages using the nano‐indenter [27]. To minimize the effects of viscoelasticity and creep on proper measurement, a long constant load hold period was introduced before final loading. The second constant load hold period was introduced near the end of the test, at 10% of the peak load, in order to establish the rate of thermal expansion or contraction of the testing apparatus to correct the displacement data for thermal drift. The nano‐indentation was conducted with a maximum load of 8 mN, with a loading rate of 400 μN s−1, which can produce a hardness impression with a depth of 700 nm. Three target areas from near the center of the specimen along the radial direction were selected in each endosteal, middle, and periosteal site of the specimens. Van had also determined the hardness of the cortical bone in goats at different preservation durations by conducting the Vicker test. In the experiment, a Vicker automatic hardness measurement device (Buehler 1600‐6400; Buehler, Lake Bluff, IL) was used to perform six measurements on each specimen [28]. The indentation was made using a diamond indenter and an indent weight of 50 g. Then, the Ominimet MHT software was used to analyze the indentation.
1.3 Methodology
The experimental methodology was divided into four phases. They include planning the parameters selection for the experiment, design of the experiment, observation, and analysis phases. Design of experiment (DOE) plays an important role in optimization of the temperature parameter in accelerated temperature testing. In order to determine the desired information, both the number of factors and levels of parameters must be predetermined.
1.3.1 Phase I: Planning
Before carrying out any experiment, the parameters for each experiment were studied and discussed. The information gained from journals on the experiments done by previous researchers, suggestions from the supervisor and laboratory technicians, and references from standards were all recorded for DOE settings.
After analyzing the information, decision making on the parameter settings for the experiments was carried out. In accelerated temperature testing, the parameters used were temperature and RH. The RH values in the closed oven depended on the temperature and were calculated based on the difference in the temperatures of the wet and dry thermocouples. The maximum load (N) and hardness values of each specimen were compared between bovine and goat bones in mechanical testing and using nano‐indentation respectively.
1.3.2 Phase II: Design of Experiment
In this study, the accelerated temperature testing has two dependent variables, temperature and RH. In the DOE, the temperature was set to three levels (low, medium, and high levels). Low level temperature was set at 22 °C, medium temperature at 55 °C, and high level temperature at 85 °C. Some bovine and goat bone specimens were tested similarly with each combination of temperature and RH. The accelerated temperature test was carried out for a duration of 10 h.
While RH was calculated based on the difference between the wet and dry thermocouple readings (T1 and T2 channel reading on thermometer) and by referring to the humidity chart (Appendix ). The average RH values (a, b, and c) were obtained for each set of experiment.
The independent variables were determined using the tensile test and hardness test. By referring to the ASTM International Standard [9], the specific standard was set for strain rate for the tensile test, and a constant load and constant load rate were set for the nano‐indentation test. The results of tensile test (j, l, m) and nano‐indentation test (x, y, z) were analyzed and compared for both bovine and goat bones. The parameters design for each testing is illustrated in the Table 1.1.
Table 1.1 Design of experiment.
| Condition | Levels | ||
| Low | Medium | High | |
| Temperature (°C) | 20 | 50 | 80 |
| Relative humidity (RH) | a | b | c |
| Tensile test | j | l | m |
| Hardness test (nano‐indentation test) | x | y | z |
1.3.3 Phase III: Conduct of Experiment
Goat and bovine bones were selected as the specimens for testing as they have similar properties to human bones. Firstly, the bones from cow and goat remains were collected. Then, these bones were dipped in water, boiled thoroughly, and flipped occasionally using a stirrer in the hot water pot for 4 h before the flesh was removed using a knife. The processes are shown in Figure 1.3.
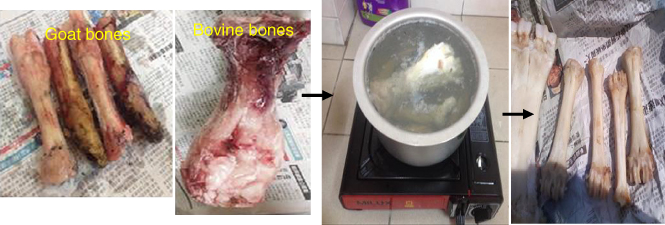
Figure 1.3 Bone processing from raw bone to boiling and de‐fleshing.
On completion of cleaning, the tray was placed under the hot sun for 10 h daily and dried for 30 days. In between, the bones were frozen at −4 °C to eliminate bacterial attack and fungus. After drying, these bones were wrapped with a transparent film and kept in a small desiccator in a freezer.
Prior to fabrication, the bones were cut along the longitudinal axis by using an abrasive water jet band saw as shown in Figure 1.4, cleaned, and polished using sandpaper and profiled. Then, the bone was ground into rectangular shape using a grinder machine for easier machining purposes later.
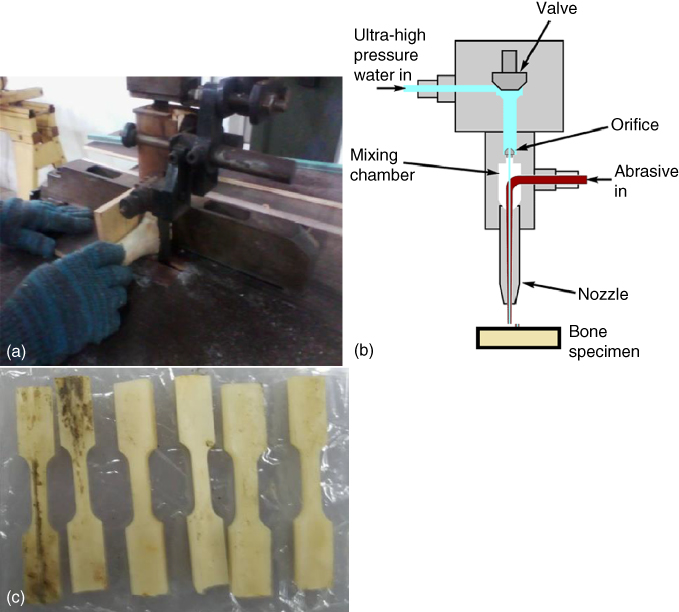
Figure 1.4 Cutting process: (a) manual band saw, (b) abrasive water jet, and (c) dog bone shaped specimen.
Afterwards, the bones were cut into dog bone shape through the abrasive water jet cutting process as shown in Figure 1.4b. In the process of abrasive water jet cutting, the high pressure pump produced a high pressure and directed the pressurized water from the pump to the cutting head through the high pressure supplies line. When the pressurized water came out from the nozzle, an extremely high velocity water jet was created. The solid abrasive particles were then mixed with the water jet. The resulting high‐speed abrasive water jet was focused on the bone material through the abrasive nozzle. Then, the kinetic energy of the abrasive particles was used to remove unwanted areas on the bones. The finished dog bone shaped specimen was prepared as shown in Figure 1.4c.
The dog‐shaped bones were then cleaned in ultrasonic machine for 3 min before being hot dried in the oven for 5 min. These initial bone structures were observed under scanning electron microscope (SEM) and the composition information analyzed under energy‐dispersive X‐ray analysis (EDAX). The procedures of SEM/EDAX inspection will be discussed in detail in phase III.
Thirty grams of epoxy resin and 10 g of curing agent HB‐2215 were mixed and stirred evenly for 10 min. The goat and cow bones were dipped into the solution separately for 5 min. These bones were then removed and put on a non‐sticky plastic sheet. After completing all deep coating processes on bones, they were cured at room temperature to avoid bubbles. Then, the non‐sticky plastic sheet together with bones was dried in a drying cabinet for 8 h at a temperature of 40 °C. After 8 h, the plastic sheet was removed. All the bones were put into transparent packaging separately. These bones were observed again under SEM/EDAX.
In the accelerated temperature testing, a laboratory oven was used. A wet–dry bulb hygrometer concept was used in the experiment. Two thermocouples and a digital thermometer were prepared. One of the thermocouples was tied with small pieces of wet cotton. Both thermocouples were connected to the digital thermometer channels (T1 and T2) separately. The laboratory oven was turned on and set to the desired temperature (55 and 85 °C). After reaching the stable temperature, the bovine and goat bones were put together inside the oven. The readings of T1 and T2 channels were taken every 15 min. It is important to take the exact reading for both T1 and T2 channels when they have reached the stable state. The experiment was carried out for 7 h and a total of 28 readings were taken. The RH in the laboratory oven was calculated based on the humidity chart. The setup of temperature measurement is illustrated in Figure 1.5.
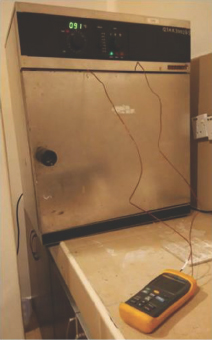
Figure 1.5 Temperature measurement using wet–dry bulb hygrometer concept.
The tensile test was performed using Instron Table Mounted Universal Tensile Machine (UTM) with a 30 kN load cell. Before carrying out tensile test, the gauge length, width, and thickness of each bone was measured five times and the average value was obtained. Each specimen has a different thickness and width but same gauge length as shown in Table 1.2. The first bone sample was mounted on the grip and safely secured by closing the grips. The test lasted for about 1 min. For strain evaluation, the cross‐head speed was set at 0.025 mm s−1. All the tests for different bone specimens used the same cross‐head speed. The gauge length was set at 10.5 mm apart.
Table 1.2 The dimension of both bovine and goat specimens.
| Specimen | Average thickness (mm) | Average width (mm) | Gauge length (mm) |
| B3 | 4.144 | 2.944 | 10.500 |
| B4 | 3.308 | 3.114 | 10.500 |
| B2 | 4.110 | 2.992 | 10.500 |
| G3 | 1.986 | 2.892 | 10.500 |
| G4 | 2.648 | 3.006 | 10.500 |
| G2 | 2.126 | 2.762 | 10.500 |
B: Bovine bone, G: goat bone.
After the tensile test, the bone specimens were tested for their hardness properties by using Micro Materials Nano Test nano‐indenter. The machine offers a complete range of nanomechanical and nanotribological tests in a flexible and user‐friendly instrument. The bone samples to be measured must be ideally flat with fine surface finish. Then, the specimen was mounted on the stub using a small quantity of cyanoacrylate adhesive.
1.3.4 Phase IV: Observation and Analysis
In order to inspect the microstructure inside the bone, the SEM Hitachi S‐3400N was used. SEM has a better resolution of 10 nm at 3 kV and it is computer eucentric, which has a five‐axes motorized stage with −20°/+90° tilt. Before the inspection is done using SEM machine, the bone specimen was coated with a conductive layer of coating in the sputtering unit. Besides, SEM is an analytical specimen chamber with an optimum geometry that is used for simultaneous accommodation of analytical techniques such as energy‐dispersive X‐ray spectroscopy (EDS), wavelength‐dispersive spectroscopy (WDS) system, and electron backscatter diffraction (EBSD) analysis. By integrating these three analytical techniques on a single platform, it can provide a complete materials characterization solution, which is called EDAX.
1.4 Results and Discussion
1.4.1 Accelerated Weathering Study
Before carrying out the accelerated weathering study, the bovine and goat bones were prepared. The appearance of both bones with fleshes before cooking and without fleshes after cooking and removing of fleshes is shown in Table 1.3. Boiling process is done to decompose the soft muscle tissue remaining on the bone surface.
Table 1.3 Bone appearance before and after removing fleshes.
| Condition | Bovine | Goat |
| Before cooking | 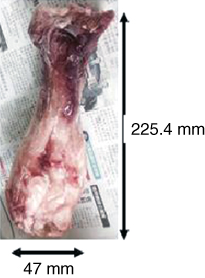 | 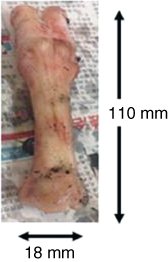 |
| After cooking and defleshing | 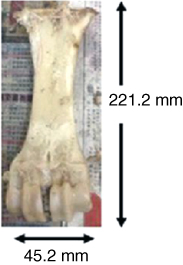 | 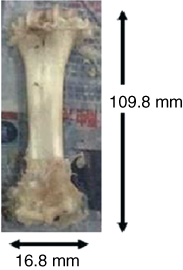 |
After cooking and removing the fleshes, the length and width of the bone changed and the bone became smaller. The bone color changed from totally white during cooking to slightly yellowish after being dried up.
During the accelerated aging, there was a significant change in the mass of bone after 10 h. There was not much difference in the appearance of the bone such as color changes or surface fracture before and after the experiment. The reason is that the duration of aging is short and the temperature is low and it does not bear much effect on the bone. This is quite a different result compared to previous work. Previously, Ubelaker [29] proved that the color of bone fragments is affected by high temperature as a function of duration and temperature, and oxygen availability. Most experiments done previously have shown that fresh bone follows the trend from brown through black, then gray–blue–white to white with increased temperature [30].
The first set of bovine and goat samples were placed at room temperature around 22 °C. The second and third sets of samples were placed in the laboratory oven at temperatures of 55 and 85 °C respectively. The RH at different temperatures is plotted in Figure 1.6.
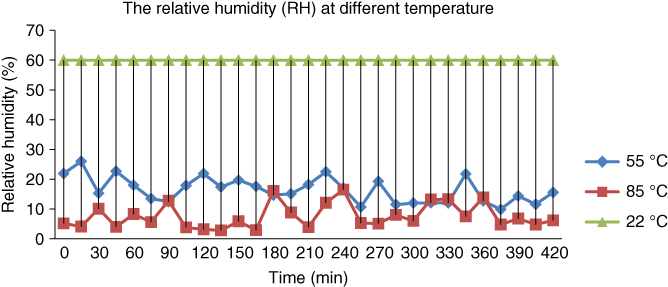
Figure 1.6 Relative humidity versus time at different temperatures.
There is one assumption made, that is, the RH of bovine and goat bones at room temperature is assumed to be around 60% [12, 31]. The first desired temperature was chosen to be 22 °C. It is assumed the bones undergo aging due to weathering at room temperature. Another sample was tested at the desired temperature, that is, 85 °C, under dry condition. The reason is that micro‐organisms (thermophilic microbes) play a role in decomposition of bodies as they can live up to 80 °C. The last temperature chosen was 55 °C, which is the average between 22 and 85 °C.
From the graph in Figure 1.6, it can be seen clearly that RH has different values at different temperatures. Increasing the temperature will lower the RH while lowering the temperature will increase the RH. RH varies significantly when the temperature changes, even when the actual amount of water vapor is constant. In this case, lowering the temperature can result in a rise in RH even though there is no water source or water vapor added into the laboratory oven while heating the bones. The amount of water vapor present at saturation is less at lower temperatures. So, there is a higher percentage of saturation air for the existing amount of water vapor in the oven.
The humidity of weathering in the atmosphere fluctuates from day to day in tropical countries. The temperature and RH are recorded for day 1 (25 °C, 84% RH – dry day) and day 2 (26 °C, 84% RH – cloudy day). All the climatic variables such as temperature and humidity can affect each other. The change in temperature can cause a change in water evaporation and air saturation, and can directly lead to change in humidity.
Besides, the air temperature differences between different locations can cause air pressure differences, which can produce different air movements in the oven. The initial reading of wet and dry thermocouples is different for every temperature reading taken. When both thermocouples are inserted into the oven and the temperature reading at different points measured, the final temperature reading taken is different. The principle is likely similar to the statement by Heritage [32].
However, there was a significant change in the mass of the bone after 10 h of accelerated aging. The mass of the bone specimen was measured before and after the accelerated aging process. There was not much difference in the appearance of bone such as color or cracks but the mass changed dramatically. A comparison of the mass loss is made in Table 1.4.
Table 1.4 Comparison of mass loss for bovine and goat specimen.
| Mass loss, ∆m (g) | ||||||
| Bovine bone | Goat bone | |||||
| B1 (22 °C) | B2 (55 °C) | B3 (85 °C) | G1 (22 °C) | G2 (55 °C) | G3 (85 °C) | |
| Before accelerated aging (g) | 2.018 | 1.574 | 2.128 | 0.866 | 1.262 | 0.875 |
| After accelerated aging (g) | 2.016 | 1,549 | 2.08 | 0.864 | 1.239 | 0.858 |
| Mass loss percentage (wt%) | 0.099 | 1.588 | 2.256 | 0.231 | 1.823 | 1.943 |
B: Bovine, G: goat.
Based on Table 1.4, it can be seen that the maximum mass loss occurred in B3 specimen (2.256%) and minimum mass loss occurred in B1 specimen (0.099%). There is an increasing trend of mass loss when the temperature is increased.
Accelerated aging leads to changes in bone cells and tissues. These changes result in changes in bone mass due to maceration of bone. Maceration is a process where a clean skeleton is obtained from the animal carcass inside a closed and ventilated container. During the process, decomposition occurs, whereby the protein cells in the bone are broken down and consumed by bacteria. The mass of the bone reduces after exposure to accelerated aging conditions. The density of the bone is reduced with mass loss. The bone will become less dense. Thus, the bone becomes weaker and has high risk of fracture or lifetime osteoporosis.
With respect to determining the change in characteristics due to accelerated aging of the bones, it is important to determine the mechanical properties such as tensile strength. There are two different observations obtained from the experiment. The first section will discuss the effects of increase of temperature on the tensile strength of both bovine and goat bones. The Section 1.4.2 discusses the effects of an increase in temperature based on the physical activity of the cow and the goat.
1.4.2 Effects of Increase in Temperature and Decrease in Relative Humidity (RH) on Maximum Load Withstood by Bone
As the bovine and goat bone specimens were aged at increased temperatures, there was a significant change in tensile strength. When the bone specimens were aged at room temperature around 22 °C, the maximum load withstood by the bovine and goat bones (B3 and G3) was 667.41 and 713.06 N respectively as shown in Figures 1.7 and 1.8.
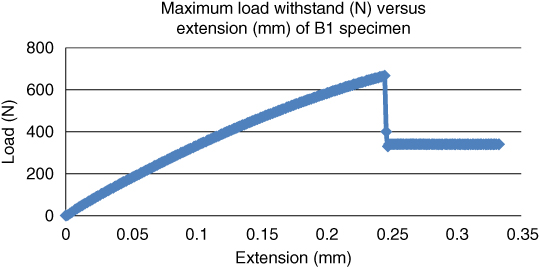
Figure 1.7 Maximum load withstood (N) versus extension (mm) for bovine bone at a temperature of 22 °C.
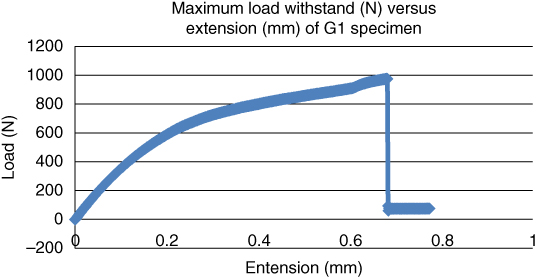
Figure 1.8 Maximum load withstood (N) versus extension (mm) for goat bone at a temperature of 22 °C.
It shows that the goat bone can withstand a higher load than the bovine bone specimens. This indicates that the goat bone has higher strength than bovine bone under normal weathering condition at 22 °C.
When another set of bovine and goat bone specimens were heated at a temperature of 55 °C with a tolerance of ±5 °C, the maximum load withstood by the bovine and goat bone specimens (B4 and G4) increased to 958.18 and 1031.88 N respectively as shown in Figures 1.9 and 1.10.
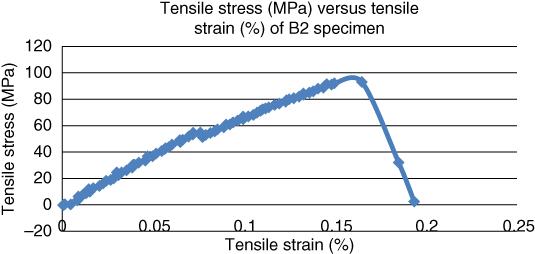
Figure 1.9 Maximum load withstood (N) versus extension (mm) for bovine bone at a temperature of 55 °C.
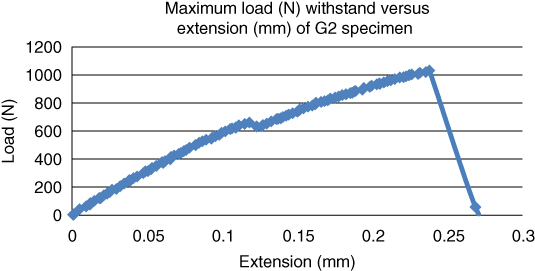
Figure 1.10 Maximum load withstood (N) versus extension (mm) for goat bone at a temperature of 55 °C.
The maximum tensile strength of bovine bone increased from 667.41 to 958.18 N. Similarly, the tensile strength of goat bone also increased from 713.06 to 1031.88 N. When the bovine and goat specimens were aged at a temperature of 85 °C with a tolerance of ±5 °C, the maximum load withstood by the bovine and goat bone specimens (B2 and G2) was 501.64 and 713.06 N respectively as shown in Figures 1.11 and 1.12.
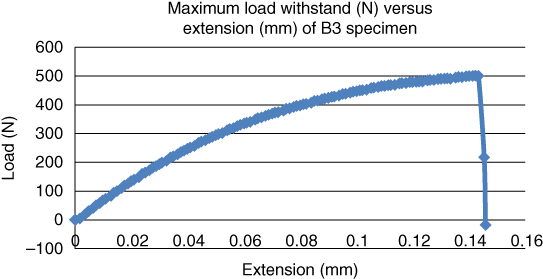
Figure 1.11 Maximum load withstood (N) versus extension (mm) for bovine bone at a temperature of 85 °C.
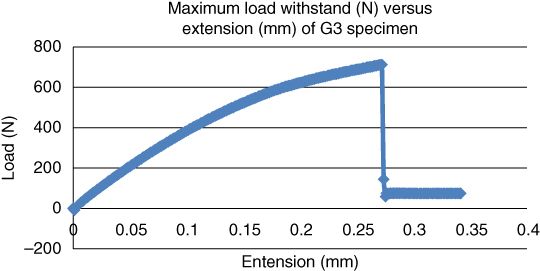
Figure 1.12 Maximum load withstood (N) versus extension (mm) for goat bone at a temperature of 85 °C.
By comparison, the maximum tensile strength of bovine bone aged at 85 °C was lower than that of bovine bone aged at 55 °C. Again, the goat bone exhibited superior capability to withstand a maximum load of 713.06 N at 85 °C.
All the maximum loads that can be withstood by both bovine and goat bones are summarized in Table 1.5 and illustrated as a bar chart in Figure 1.13.
Table 1.5 Comparison of maximum load withstood by bovine and goat bones at different temperatures.
| Temperature/average relative humidity (RH) | Maximum load withstood (N) | |
| Bovine | Goat | |
| 22 °C (60 ± 5% average RH) | 667.41 | 976.35 |
| 50 °C (15.08% average RH) | 958.18 | 1031.88 |
| 80 °C (7.39% average RH) | 501.64 | 713.06 |
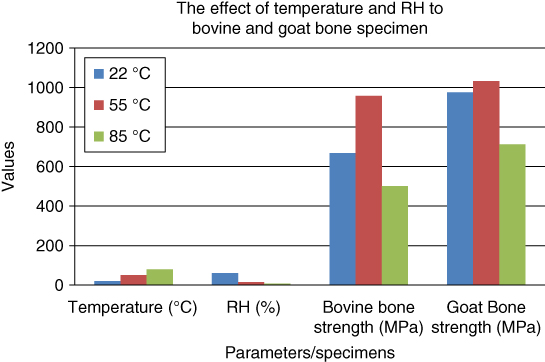
Figure 1.13 The relationship of temperature and relative humidity (RH) to bovine and goat specimen strength.
Based on Table 1.5, both bovine and goat bones have the maximum tensile strength at a temperature of 55 °C. This is followed by the bone specimen aging at 22 °C and the lowest loading at 85 °C. From this observation, it can said that the optimum aging of bone for improving the tensile strength is at 50 °C with an average RH of 15.08%.
Based on Figure 1.13, it can be seen that bovine and goat bones can withstand an average load at room temperature (low temperature, high RH). When aging at medium temperature (55 °C) and relatively medium RH, the bone can withstand a higher load before fracture. But, the bone aged at high temperature (85 °C) and low average RH is incapable of withstanding a higher tensile load. From the observation, it is clear that the bone has the strongest mechanical strength at moderate humidity and temperature. At relatively low temperatures, the average RH is high. So, it can create a suitable moist environment, and the wet bone is highly susceptible to mold growth. Mold is a simple microscopic organism that destroys organic materials. The mold will digest the organic material in bone (collagen) and destroy it, and eventually spread to destroy the adjacent collagen network.
When a bone is aged at a very high temperature, bone deterioration occurs. The bone responds to the changes of RH by expanding and contracting to different degrees in longitudinal, radial, and tangential directions. During the aging process, the outer surface of the bone will dry and evaporate while the inner surface is still wet and expands internally. This may cause a big area to shrink, crack, and warp when the bone structure deteriorates gradually. Hence, it can affect the mechanical properties of the bone.
1.4.3 Comparison of Bovine and Goat Bone Strength at Normal and Increased Temperatures
From Figure 1.14, it can be seen that the goat bone has greater strength compared to the bovine bone at room temperature and at increased environmental temperature (55 °C). It proves that the bone structure of goat bone specimen is better than that of bovine bone specimen. It may be due to the effect that lifelong exercise has on the bone properties. The goat is predicted to perform more physical activity than the cow. More exercise can improve the properties of bone and its collagen network [4].
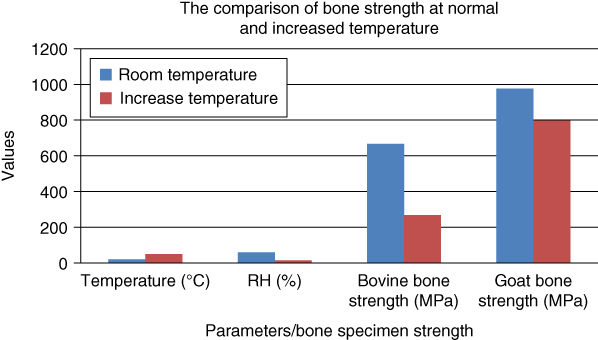
Figure 1.14 Comparison of bone strength at normal and increased temperatures.
Even though goat bone size is smaller than that of bovine bone, it has greater mechanical properties. It may be due to porosity and stiffness. Porosity in structural materials exerts a strong influence on mechanical properties. The strength and stiffness vary inversely with increased porosity [18]. This indicates that the microstructure in goat bone has a more compacted arrangement compared to bovine bone.
It is believed that the material properties of the goat bone tissue resulted in increased elastic modulus and a stiffer bone is formed. Comparison of the Young’s modulus shows that goat bone (7.057, 82.49 GPa) has a higher strength than bovine bone (3.15, 82.22 GPa) at 22 and 55 °C respectively. However, at 85 °C the goat bone (4.616 GPa) has relatively lower Young’s modulus than bovine bone (7.046 GPa). This is comparable to the results from Guocheng and Zreiqat [20].
There is a hypothesis that both bovine and goat bones aged at the highest temperature (85 °C) have the highest number of cracks than those aged at 22 and at 55 °C. The reason is that when exposed to high temperature, the bones experience higher mass loss and breakdown of hydroxyapatite. These losses result in cracks and fissures on the surface of the bones [33]. Table 1.6 shows the fracture appearance of different specimens.
Table 1.6 Comparison of how the bone fracture in bovine and goat bone appears.
| Bovine specimen | Goat specimen |
B1(C3)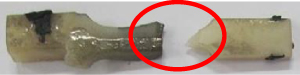 | G1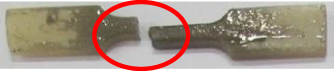 |
B2(C4)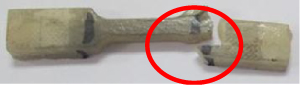 | G2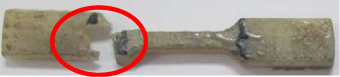 |
B3(C2)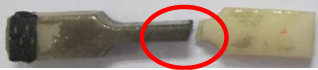 | G3 |
From Table 1.6, it can be seen that fractures happen at different parts of the bone, such as at the middle or the end of the gauge length. This is because cracks occur at the weak structural areas of bone due to tensile load when the specimen is pulled. Normally, the larger void spaces between organic and inorganic materials will be more susceptible to fracture. Besides, sliding occurs in undesirably oriented crystals before the tensile stress reaches the yield point. When loaded with tensile force, sliding happens along the crystalline plane of grains. Because the elastic properties of each crystal are different in different directions, the tensile stress may not be uniformly distributed [30, 32].
Moreover, the calcium contents in the bone itself can influence the fracture of bone. Calcium is an essential nutrient for strong bones. Calcium is needed to support the bone structure and for its hardness. When the calcium content is high, more calcium oxide is formed to form the bone. Hence, fractures will not occur easily. For example, the goat bone has higher calcium content (9.03 wt%) compared to bovine bone (5.67 wt%). So, it is harder for the goat bone to sustain a fracture regardless of the thickness compared to bovine bones.
Table 1.7 shows a comparison of the elastic modulus, tensile strength, and ductility between bovine and goat bones.
Table 1.7 Mechano properties of bovine and goat bones.
| Specimen | Temperature (°C) | Elastic modulus (MPa) | Tensile strength (MPa) |
| B3 | 20 | 3.15 | 54.27 |
| B4 | 50 | 82.22 | 91.37 |
| B2 | 80 | 0.6 | 0.41 |
| G3 | 22 | 7.06 | 128.25 |
| G4 | 55 | 82.49 | 129.64 |
| G2 | 85 | 0.78 | 1.20 |
B: Bovine, G: goat.
On comparing the bovine and goat mechano properties in Table 1.7, the test results show an almost consistent trend for each bone specimen. At 55 °C, both bones have the highest elastic modulus, highest ultimate tensile strength, and lowest ductility. At 85 °C, the bones have the lowest elastic modulus, lowest ultimate tensile strength, and medium ductility. Comparatively, the mechanical properties of goat bone are better than those of bovine bone. The elastic modulus of goat bone was higher than that of bovine bone. The high elastic modulus indicates that the goat bone has higher rigidity. It is a stiffer material and needs a high load to elastically deform.
Although the goat bone has higher modulus of elasticity and ultimate tensile strength, it exhibits brittleness behavior. Brittleness is the tendency of a material to fracture when there is no or little plastic deformation before failure. Figure 1.15 shows the stress–strain curve where curve “A” would be considered brittle, and curve “B” would be considered ductile [33]. By comparing this, it can be seen that the graph obtained from the experiment most likely follows curve “A” apart from having low ductility as observed in Figures 1.8–1.13.
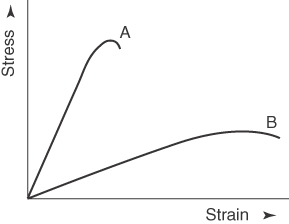
Figure 1.15 Stress–strain curve.
Source: Asmussen 2009 [33]. Reproduced with permission from Elsevier.
After conducting the tensile test, the hardness of both bovine and goat bone specimens were tested and analyzed under a micro/nano‐indenter. From Figure 1.16, the general shapes of the loading and unloading curves are similar to the observation gained from human cortical and trabecular bones [26].

Figure 1.16 Load versus indentation depth graph for bovine bone specimen.
A summary of the nano‐indentation results for both bovine and goat bones at different temperatures is presented in Table 1.8. The hardness, maximum depth of indentation, maximum load of indenter applied, and reduced modulus were recorded.
Table 1.8 Nano‐indentation results for bovine and goat bones at different temperatures.
| Specimen | Hardness (GPa) | Max indentation depth (nm) | Maximum load (mN) | Reduced modulus (GPa) |
| B3(20) | 0.666 63 | 1567.49 | 30.03 | 14.043 7 |
| B4(50) | 0.181 09 | 3636.29 | 30.03 | 1.466 92 |
| B2(80) | 0.040 77 | 8934.23 | 30.03 | 0.208 47 |
| G3(20) | 0.245 99 | 1523.72 | 8.03 | 3.634 81 |
| G4(50) | 0.036 62 | 7096.85 | 30.03 | 0.679 08 |
| G2(80) | 0.299 98 | 1308.03 | 8.03 | 4.349 41 |
B: Bovine, G: goat.
Based on Table 1.8, the hardness of both bovine and goat specimens was almost similar to that of the femur bone in humans with a hardness of 0.55 ± 0.15 GPa [32]. In comparison, other implants such as metallic biomaterials including stainless steel and Co‐based alloy had low surface hardness of about 38 ± 8.2 MPa, which is lower than that of human femur bone. From Figure 1.17, the average hardness of metallic implant is relatively higher than the lowest hardness of bone by about 3.77% as compared with data from Guocheng and Zreiqat [20].
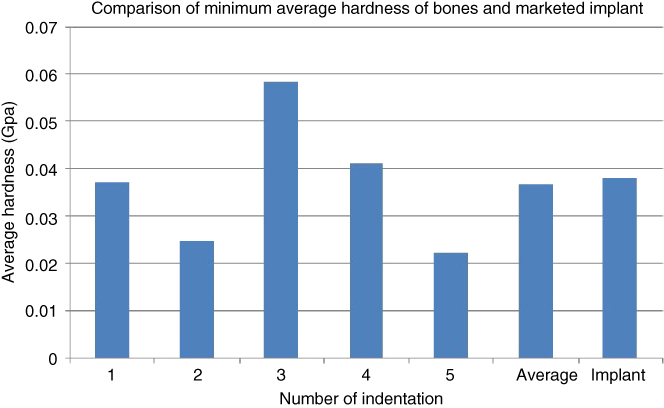
Figure 1.17 Comparison of minimum average hardness of bone and implant.
In comparison with the normal bone with the highest average hardness, the marketed implants had lower hardness values of about 43% as shown in Figure 1.18. Hence, the bovine and goat bones still have higher hardness properties compared to metallic biomaterials. Moreover, these metallic implants had a high tendency for corrosion and wear in biological environments [20].
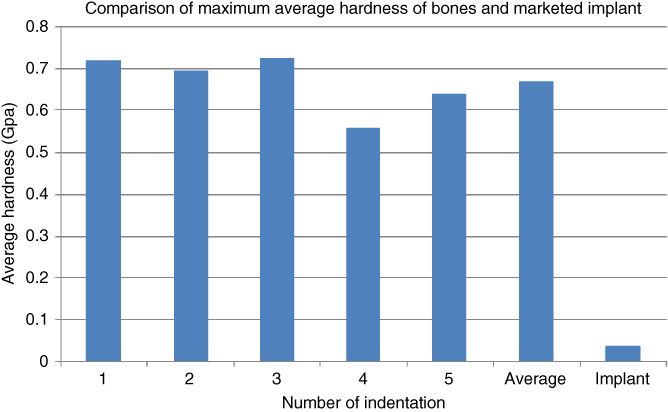
Figure 1.18 Comparison of maximum average hardness of bone and implant.
The bone chosen for implant must be strong enough to withstand the mechanical loads. When it has better mechanical strength properties, it can sustain itself in the human body for long periods of time without undergoing repeat surgery. The weak mechanical properties of implant materials necessitate consistent replacement or repairing.
The present results and previous work done by researchers are slightly different. This may be due to the different anatomical location of animal body bones. In this experiment, the bone used originated from the femur of both bovine and goat models. But previously, most researchers had done the work on measuring the elastic modulus and hardness by using rib bone [23]. Moreover, it may due to different collagen orientation and distribution in bovine and goat bones. When the orientation and distribution are different, the tissue depth is different under the same load. This statement is also proved by ASCENZI that different distribution of osteon types can be differentiated by collagen fiber orientation and it can make the average properties distinctive [22].
From Table 1.8, one can observe the likely similarity to the result obtained by Rho. He also had shown that hardness is closely related to the Young’s modulus [28]. It can be seen that when the hardness increases, Young’s modulus also increases. In Malaysia, cow slaughtering in public is not much encouraged and cow bone is prohibited to be implanted due to religious issues. On the other hand, goat bone can be a better choice since it has relatively significant hardness properties and is widely accepted by every religion in Malaysia.
At the same time, it can be seen that both bovine and goat bone specimens have better hardness properties after adding a resin coating. A comparison of hardness with and without resin coatings is shown in Table 1.9.
Table 1.9 Comparison between bone with resin and bone without resin.
| Bone coating | Hardness (GPa) | |
| Bovine | Goat | |
| Without resin | 0.024 91 | 0.069 73 |
| With resin | 0.666 63 | 0.245 99 |
From Table 1.9, it is seen that the bovine and goat bone’s hardness without resin hybrid is 0.024 91 and 0.069 73 GPa respectively. It increased to 0.666 63 and 0.245 99 GPa respectively after the bone was coated with resin hybrid. Epoxy resin is a thermoset that consists of single molecules of epoxyl resin and curing agents (hardeners). Both epoxyl resin and hardeners combine together chemically and form long chain of molecules [1]. When it is cured in the drying cabinet, it can become a hard polymer due to the formation of stable adhesive cross‐linkages [24].
In order to investigate the microstructure of bones, the fracture surface specimens were observed by using SEM. Figure 1.19 shows the fracture structure for bovine bone specimen, which had broken at the edge of gauge length after tensile testing.
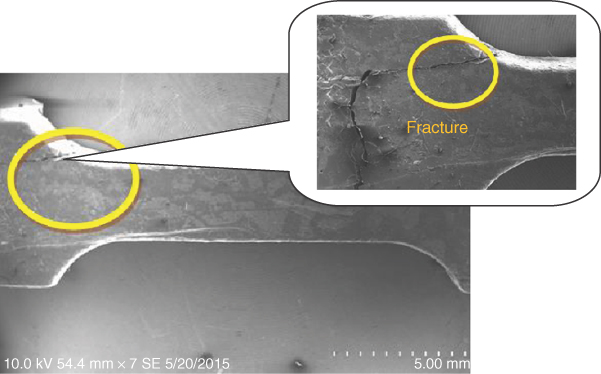
Figure 1.19 The fracture structure of bone.
The SEM image in Figure 1.20 shows the abrasive elongation of bone while tensile loading is applied in the direction of elongation (yellow arrow) outward from the point where the voids propagation initiates and breaks at the end.
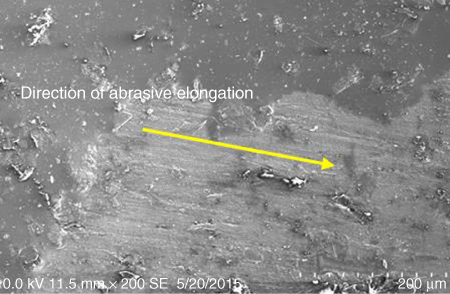
Figure 1.20 Abrasive elongation of bone.
The abrasive wear elongation can be calculated by measuring the average distance between two parallel lines (yellow lines) as shown in Figure 1.21. The average distance for the wear elongation before breaks of the bovine bone specimen (C3/B3) is 19.643 mm.
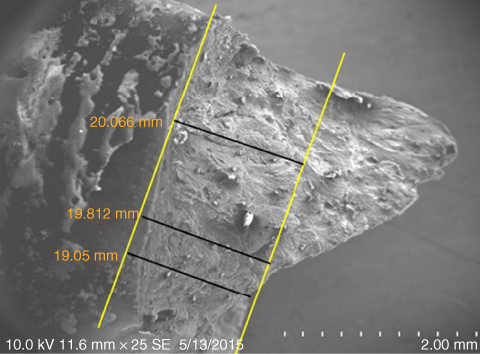
Figure 1.21 The abrasive wear elongation of bone.
When the cross‐section areas of bone were analyzed, it is noticeable that porosity exists in both bovine and goat bones as shown in Table 1.10.
Table 1.10 Comparison of porosity in bovine and goat bones.
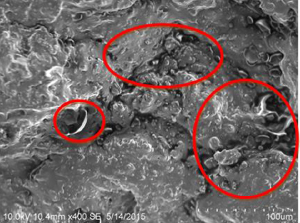 Bovine bone at 22 °C (B1) | 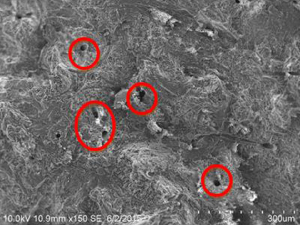 Goat bone at 22 °C (G1) |
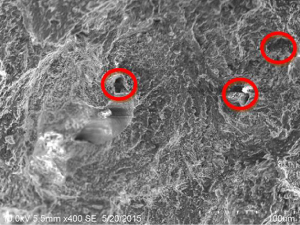 Bovine bone at 55 °C (B2) | 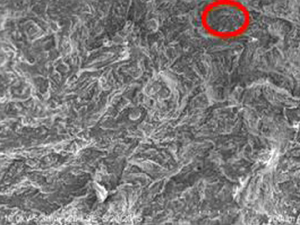 Goat bone at 55 °C (G2) |
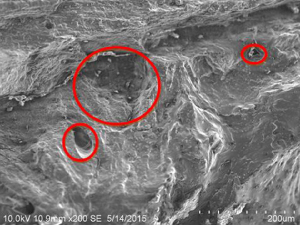 Bovine bone at 85 °C (B3) | 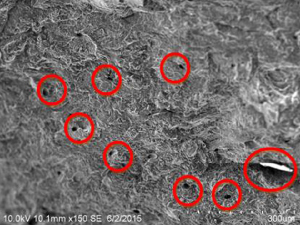 Goat bone at 55 °C (G3) |
On comparison of bovine and goat specimens as shown in Table 1.10, the goat bone has less porosity than bovine bone. The goat bone has smaller and narrower void spaces while the bovine bone has larger and wider void spaces. When monitoring the accelerated weathering at room temperature, the bovine bone has long‐chain small interconnected porosity but the goat bone has more of small porosity. At 85 °C of weathering, the bovine bone has large volume porosity and goat bone has more of small size porosity. This has proved that when the porosity is high, the strength of the bone is less. The hypothesis that stated that both bovine and goat bones have the highest tensile strength is accepted.
Based on the results of EDAX analysis as shown in Figures 1.22–1.25, both bovine and goat bones were not pure organic biomaterials because they consist of other inorganic elements such as sodium, magnesium, and aluminum. From Figure 1.22 it can be seen that bovine bone consists mainly of carbon and hydrogen.
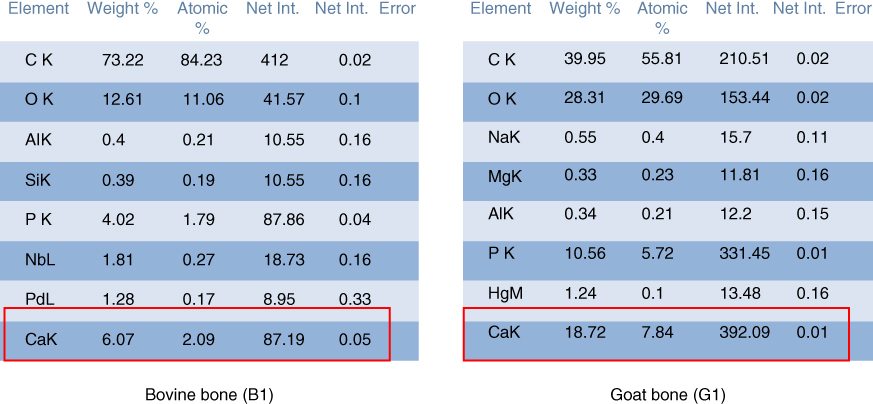
Figure 1.22 Calcium composition in bone specimens at 22 °C (B1 and G1).

Figure 1.23 Calcium composition in bone specimens at 85 °C (B1 and G1).
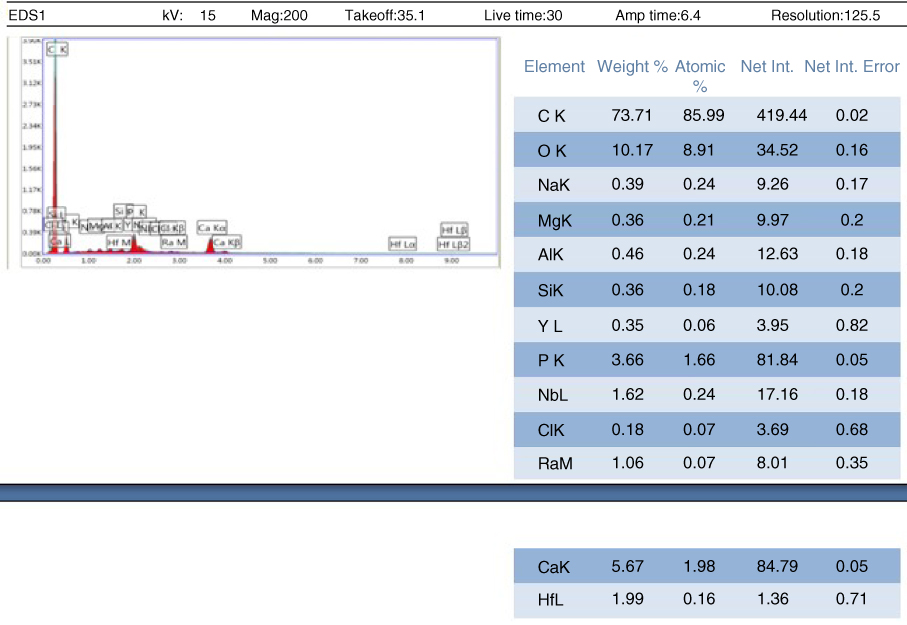
Figure 1.24 EDAX analysis for bovine specimen for testing at 85 °C (B3).
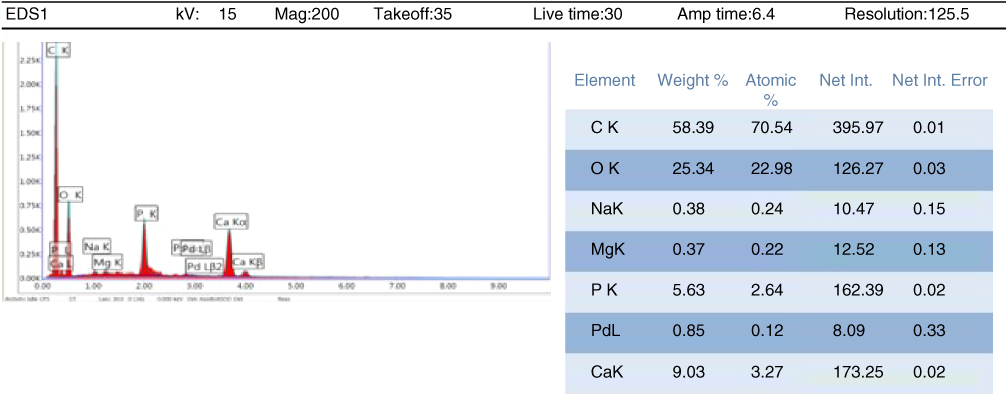
Figure 1.25 EDAX analysis for goat specimen for testing at 85 °C (G3).
Besides, the EDAX analysis has shown that calcium content in goat bone is higher than that in bovine bone. Figures 1.22 and 1.23 show the overall calcium composition in both bovine and goat bone specimens prepared for testing at 22 °C (B1 and G1) and 85 °C (B3 and G3).
Figures 1.24 and 1.25 show that the goat bone has relatively higher calcium content compared to bovine bone. Higher composition of calcium can enhance the tensile strength of bone. So, the hypothesis that goat bone is stronger than the bovine bone is accepted.
1.5 Conclusion
Exposure of animal bones to accelerated aging condition changes their mechanical properties. When a bone is exposed to high temperature environment for a long time, the mass loss of the bone is higher. Based on the results obtained, it can be concluded that the highest tensile strength (958.18 N for bovine bone and 1031.88 N for goat bone) was obtained at moderate temperature (around 55 °C) and moderate RH (15.08% RH). At low temperatures such as room temperature, the bone has lower tensile strength due to greater susceptibility to mold growth in high humidity environment. At very high temperatures, the bone deteriorates and cracks easily due to an over‐drying environment. Hence, the lowest tensile strength is obtained for bovine (501.64 N) and goat bones (713.06 N) at 85 °C.
Besides, the goat bone is a better choice with good mechanical properties because it has higher tensile strength compared to bovine bone. The reason is that the physical activity in goat is more frequent than in the cow and hence its collagen network in bone is enhanced. Calcium element content in goat bone during EDAX analysis is higher than that in bovine bone. From the micrograph obtained from SEM analysis, it is seen that the porosity in goat bone is lesser, smaller, and narrower than that in bovine bone. All of these results prove that goat bone has better tensile strength compared to bovine bone.
In hardness test, both bovine and goat bones have shown good hardness properties, which are nearly similar to the human bone’s hardness (0.55 ± 0.15 GPa). They have shown higher hardness (ranging from 0.181 09 to 0.6663 GPa) compared to the existing marketed metallic implants (38 ± 8.2 MPa). However, bovine bone biomaterials must be carefully selected to avoid any sensitive religious issues, in Malaysia particularly. For this reason, the goat model may still be considered as a good option.
1.A Relative Humidity Chart

References
- 1 A. Wadham. “Module 1‐basic material properties and how they can be altered”. Canteach, 2 June 1993. Available from: https://canteach.candu.org/Content%20Library/20040901.pdf (accessed 23 June 2015).
- 2 Qwamizadeh, M., Zhang, Z., Zhou, K., and Zhang, Y.W. (2015). On the relationship between the dynamic behavior and nano‐scale staggered structure of the bone. Journal of the Machanics and Physics of Solids 78: 17–31.
- 3 Pilitsis, J.G., Lucas, D.R., and Rengachary, S.R. (2002). Bone healing and spinal fusion. Neurosurgical Focus 13 (6), e1. PMID 15766227.
- 4 Isaksson, H., Tolvanen, V., Finnilä, M.A.J. et al. (2009). Long‐term voluntary exercise of male mice induces more beneficial effects on cancellous and cortical bone than on the collagen matrix. Experimental Gerontology 44 (11): 708–717.
- 5 Hiller, M.L. and Bell, L.S. (2007). Differentiating human bone from animal bone: a review of histological methods. Journal of Forensic Sciences 52 (2): 249–263.
- 6 Pearce, A.I., Richards, R.G., Milz, S. et al. (2007). Animal models for implant biomaterial research in bone: a review. European Cells and Materials 13: 1–10.
- 7 Prothero, D.R., Manning, E.M., and Fischer, M.S. (1988). The phylogeny of the ungulates. In: The Phylogeny and Classification of the Tetrapods, vol. 2 (ed. M.J. Benton), 201–234. Oxford: Oxford University Press.
- 8 ASTM (1997). E8 Standard Test Methods of Tension Testing of Metallic Materials. s.l.:s.n.
- 9 ASTM (1997). Standards methods of testing small clear specimens of timber. Annual Book of ASTM Standards Des. ASTM D 143‐94, vol. 4.10.
- 10 D. Subit, E.D.P. de Dios, J. Valazquez‐Ameijide, C. Arregui‐Dalmases, J. Crandall, 2013. Tensile material properties of human rib cortical bone under quasi‐static and dynamic failure loading and influence of the bone microstructure on failure characteristics. Biological Physics, v2, 1–22. Available from: http://arxiv.org/pdf/1108.0390v2.pdf.
- 11 Ajadi, D.A. and Sanusi, Y.K. (2013). Effect of relative humidity on oven temperature of locally design solar carbinet dryer. Global Journal of Science Frontier Research Physics and Space Science 13 (1).
- 12 Huynh, T.T., Aarnink, A.J., Verstegen, M.W. et al. (2005). Effects of increasing temperatures on physiological changes in pigs at different relative humidities. Journal of Animal Science 83 (6): 1385–1396.
- 13 Karr, L.P. and Outram, A.K. (2012). Bone degradation and environment: understanding, assessing and conducting archaeological experiment using modern animal bones. International Journal of Osteoarcgaeology 25: 201–212.
- 14 Magargee, J., Cao, J., Zhou, R. et al. (2011). Characterization of tensile and compressive of microscale sheet metals using a transparent microwedge device. Journal of Manufacturing Science and Engineering 133 (6): 064501.
- 15 Zhang, W., Tekalur, S.A., Baumann, M., and McCabe, L.R. (2013). The effects of damage accumulation on the tensile strength. Journal of Biomechanics 46 (2013): 964–972.
- 16 Feng, L. and Jasiuk, I. (2010). Effect of specimen geometry on tensile strength of cortical bone. Journal of Biomedical Materials Research Part A 95 (2): 580–587. doi: 10.1002/jbm.a.32837.
- 17 Warhatkar, H., Chawla, A., Mukherjee, S., and Malhotra, R. (2008). Experimental study of variation between quasi‐static and dynamic load deformation properties of vovine medial collateral ligaments. SAE International, 09B‐0276 also in Biomechanics, 2009 – SP‐2225.
- 18 Schaffler, M.B. and Burr, D.B. (1988). Stiffness of compact bone: effects of porosity and density. Journal of Biomechanics 21 (1): 13–16.
- 19 Kohan, N., Via, B.K., and Taylor, S. (2011). A comparison of geometry effect on tensile testing of wood strands. Forest Products Journal 62 (3): 167–170.
- 20 Guocheng, W. and Zreiqat, H. (2010). Functional coatings or films for hard‐tissue applications. Materials 3: 3994–4050. doi: 10.3390/ma3073994.
- 21 Reilly, D.T. and Burstein, A.H. (1975). The elastic and ultimate properties of compact bone tissue. Journal of Biomechanics 8 (6): 393–405.
- 22 Lau, M.L., Lau, K.T., Yeo, Y.D.Y. et al. (2010). Measurement of bovine bone properties through surface indentation technique. Materials and Manufacturing Processes 25 (5): 324–328.
- 23 Lau, M.L., Lau, K.T., Ku, H. et al. (2012). Measurement of heat treatment effects on bovine cortical bones by nanoindentation and compression testing. Journal of Biomaterials and Nanobiotechnology 3 (1): 105–113.
- 24 Tiwari, A. (2012). Nanomechanical analysis of hybrid silicones and hybrid epoxy coatings – a brief review. Advances in Chemical Engineering and Science 2 (1): 34–44.
- 25 Bensamoun, S., Fan, Z., Brice, I. et al. (2008). Assessment of mechanical properties of human osteon lamellae exhibiting various degrees of mineralization by nanoindentation. Journal of Musculoskeletal Resarch. 11 (3): 135–143.
- 26 Rho, J.Y., Tsui, T.Y., and Pharr, G.M. (1997). Elastic properties of human cortical and trabecular lamellar bone measured by nanoindentation. Biomaterials 18 (20): 1325–1330.
- 27 Rho, J.Y., Zioupos, P., Currey, J.D., and Pharr, G.M. (2002). Microstructural elasticity and regional heterogenity in human femoral bone of various ages examined by nano‐indentation. Journal of Biomechanics 35: 189–198.
- 28 Rho, J.Y. and Pharr, G.M. (1999). Effect of drying on the mechanical properties of bovine femur measured by nanoindentation. Journal of Materials Science Materials in Medicine 10 (8): 485–488.
- 29 Ubelaker, D.H. (2009). The forensic evaluation of burned skeletal remains: a synthesis. Forensic Science International 183 (2009): 1–5.
- 30 Stiner, M.C., Kuhn, S.L., Weiner, S., and Bar‐Yosef, O. (1995). Differential burning, recrystallization, and fragmentation of archaeological bone. Journal of Archaeological Science 22: 223–237.
- 31 Anthony Wilkes, D.W. (2015). Measurement of humidity. Anaesthesia and Intensive Care Medicine 16 (3): 128–131.
- 32 Heritage, C. (2015). Conservation of Wet Faunal Remains: Bone, Antler, and Ivory. Canada: Canada Conservation Institutes Notes 4/3. Available: https://www.canada.ca/content/dam/cci‐icc/documents/services/conservation‐preservation‐publications/canadian‐conservation‐institute‐notes/4‐3‐eng.pdf?WT.contentAuthority=4.4.10 (accessed 20 March 2017).
- 33 Asmussen, B. (2009). Intentional or incidental thermal modification? Analysing site occupation via burned bone. Journal of Archaeological Science 36 (2): 528–536.