Chapter 8. SSRS Reporting Features
In This Chapter
![]() Creating Custom Color Palettes
Creating Custom Color Palettes
![]() Demonstrating Report Drillthroughs
Demonstrating Report Drillthroughs
![]() Demonstrating Custom Color Palettes
Demonstrating Custom Color Palettes
![]() Demonstrating Adding Reports to SSRS
Demonstrating Adding Reports to SSRS
SQL Server Reporting Services (SSRS) allows you to integrate advanced features into reports. This chapter discusses several of these features, including drilling through to different reports, setting custom color palates, and adding reports to your SSRS website.
You can use actions on items to allow drillthrough to different reports. When you do this, you enable the reader to navigate from an overview of data to a detailed view on a specific item or area without having to navigate through the SSRS website or close and open separate reports. Parameter values for reports can also be passed through such an action, based on the value selected in the parent report.
You can further customize the look of reports to better match your company’s branding by setting custom color palettes. You can set a color palette to include a list of colors that are cycled through when set on chart items. You can also use custom color palettes to associate colors with specific values in a report. You can set an expression on any color property in a report, and based on the returned value in the item, the matching color can be used; for example, you might set a table row’s background color to red to identify systems that are missing patches.
Another useful feature is the ability to add reports to your SSRS website for your readers to view. This chapter discusses two methods of adding reports: manually adding a report from the SSRS website and publishing a report from SQL Server Data Tools Business Intelligence (SSDT-BI) directly to SSRS. Once a report is available in SSRS, subscriptions can be added if required. Subscriptions can send reports through email or place reports on file shares.
Using Report Drillthroughs
A report drillthrough provides a way to navigate from one report to another without requiring the user to exit and launch separate reports individually. Chapter 7, “Intermediate Reporting Concepts,” used a pie chart to show how to add an action to go to a more detailed report. The associated demonstration asked you to create an action to go to a detailed report while passing a parameter to see specific hardware information. Not only can actions be set on chart items, they can be added on any object in SSDT-BI for Visual Studio 2013, such as a table’s cell, text boxes, image items, and so on.
Adding an Action on a Table Cell’s Value
To help you understand the steps to set an action on different objects, this section discusses creating an action on the cells under the PC Name column of the Patch Compliance Progression report. The action’s purpose is to open a new report that provides the computer hardware information specific to the selected system. Begin by making a copy of the _Template (8.5x11in).rdl report that you created in Chapter 7 and renaming the copy Detailed Computer Information.rdl. After copying and renaming the report, perform the following steps to create a detailed report that will be drilled through from another report:
1. In the Solution Explorer, double-click the Detailed Computer Information.rdl report to open it.
2. In Design mode, rename the report title placeholder Detailed Computer Information.
3. To create a new data source, in the Report Data section in SSDT-BI, right-click the Data Sources folder and click Add Data Source. In the Data Source Properties dialog, enter a name for the data source, such as DetailedPCDS1. Select Use shared data source reference and use the dropdown to select your shared data source (SSRS US in this example). When you are done with this dialog, as shown in Figure 8.1, click OK.

4. To add a new dataset to the report, in the Report Data section in SSDT-BI, right-click the Datasets folder and click Add Dataset. In the Dataset Properties dialog, set the name to PCDataset, and select Use a dataset embedded in my report. Under Data source, use the dropdown to select the data source created in step 3. Under the Query section, enter the query shown in Listing 8.1. Click OK when the Dataset Properties dialog is complete, as shown in Figure 8.2.

LISTING 8.1 Detailed Computer Query
SELECT DISTINCT
CS.Name0,
CS.UserName0,
CS.Manufacturer0,
CS.Model0,
ws.LastHWScan
FROM
v_GS_COMPUTER_SYSTEM CS
LEFT JOIN v_gs_workstation_status ws on ws.resourceid = CS.resourceid
WHERE
CS.Name0 = @PC
5. To add a customized table item to the body section of the report, from the toolbox on the left, drag the table item into the report. Make the following changes to the table (see Figure 8.3):
![]() Add two extra columns to the table, for a total of five, and drag each column of the dataset to the table.
Add two extra columns to the table, for a total of five, and drag each column of the dataset to the table.
![]() Modify the labels of the headers for each column to appropriate titles that represent the data. Add spaces between words and remove the trailing 0.
Modify the labels of the headers for each column to appropriate titles that represent the data. Add spaces between words and remove the trailing 0.
![]() Set the font style of the header row to bold and the background color to red.
Set the font style of the header row to bold and the background color to red.
![]() Adjust the widths of the column so the table spans the width of the report.
Adjust the widths of the column so the table spans the width of the report.

6. Save the report and open the Patch Compliance Progression report.
7. In the Patch Compliance Progression report, right-click the [Name0] cell and select Text Box Properties, as shown in Figure 8.4.

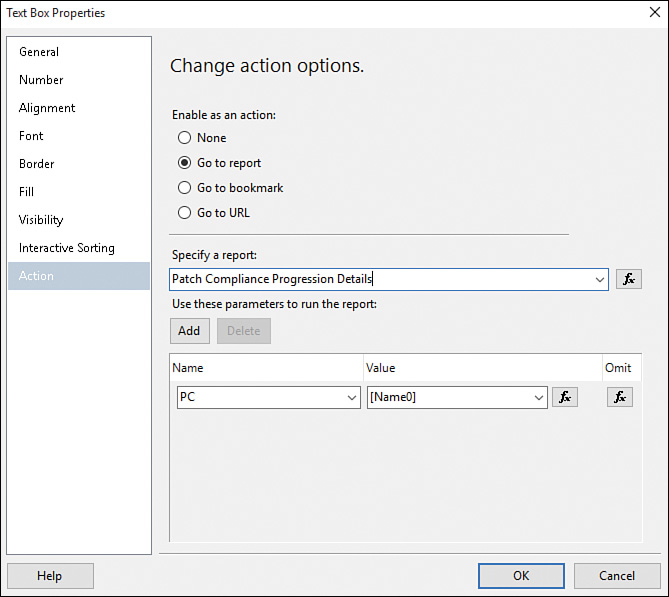
8. In the Text Box Properties dialog, select the Action tab and then select the Go to report option. Under Specify a report, select Detailed Computer Information from the dropdown list. Select Add under Use these parameters to run the report. At the Name field, select the PC parameter and as the Value field select the [Name0] value from the dropdown list. Click OK when you’re done with these changes, as shown in Figure 8.5.

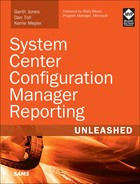
9. Preview the Patch Compliance Progression report. At the prompt, select a collection and click View Report to execute the report. When the report is populated, click a PC name in the table. You are now redirected to the Detailed Computer Information report, which displays information specific to the PC name you clicked, without requiring any additional prompts (see Figure 8.6).
Adding Hyperlinks to a Report Item
Hyperlinks are very similar to report drillthroughs, but rather than navigating to a different report, a hyperlink provides a link to a website. Hyperlinks are typically set on logos to provide a link to a company’s website. They are also often found on software updates from a patching report to link a patch to its Microsoft Knowledge Base article for additional information (as demonstrated in the next section, “Adding a Subreport Item”). To set a hyperlink on a logo for a company website, follow these steps:
1. Open the Patch Compliance Progression Chart report by double-clicking it in the Solution Explorer.
2. In Design mode, right-click the company logo in the footer section and select Image Properties, as shown in Figure 8.7.

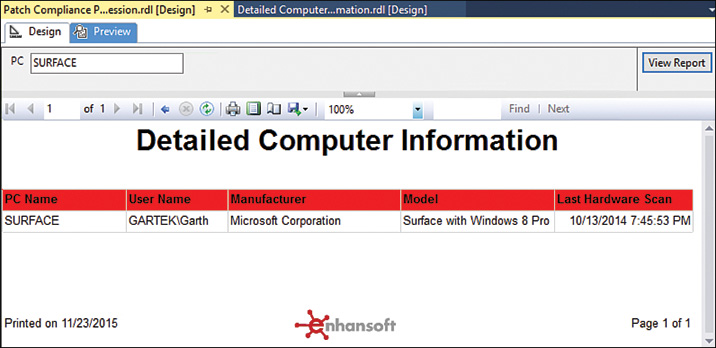
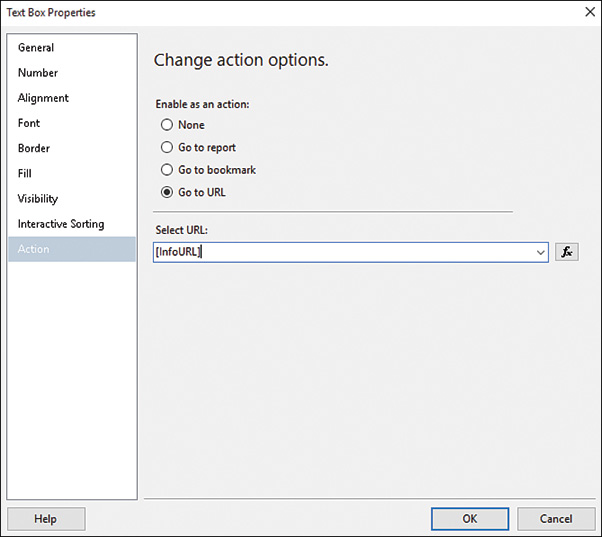
3. In the Image Properties dialog, select the Action tab. Select the Go to URL action, and in the Select URL field, enter the company website address, as shown in Figure 8.8. Click OK to apply the changes.
4. Preview the report and click on the company logo in the footer where the action was added. Confirm that the company’s website is launched from your browser.
Adding a Subreport Item
Subreport items provide the ability to display a report within the body of a parent report. A subreport can contain parameters that are passed from its parent. Using subreports is very convenient when you want to provide additional information in a detailed report without having to add additional queries or parameters to the parent report or have the reader navigate to a separate report. To demonstrate subreport items, this section shows you how to create a new report, Patch Compliance Progression Details, that provides a list of missing patches for a specific computer. You will give this report a subreport to display the computer hardware information, using the previously created Detailed Computer Information report.
Make a copy of the _Template (8.5x11in).rdl report, created in Chapter 7, and rename the copy Patch Compliance Progression Details.rdl. Then perform the following steps to create a detailed report that includes a subreport item:
1. In the Solution Explorer, double-click the Patch Compliance Progression Details.rdl report to open it.
2. In Design mode, rename the report title placeholder Patch Compliance Progression Details.
3. To create a new data source, in the Report Data section in SSDT-BI, right-click the Data Sources folder and select Add Data Source. In the Data Source Properties dialog, enter a name for the data source, such as DetailedPatchDS. Select Use shared data source reference and use the dropdown to select your shared data source (SSRS US in this example). When you are done with this dialog, click OK.
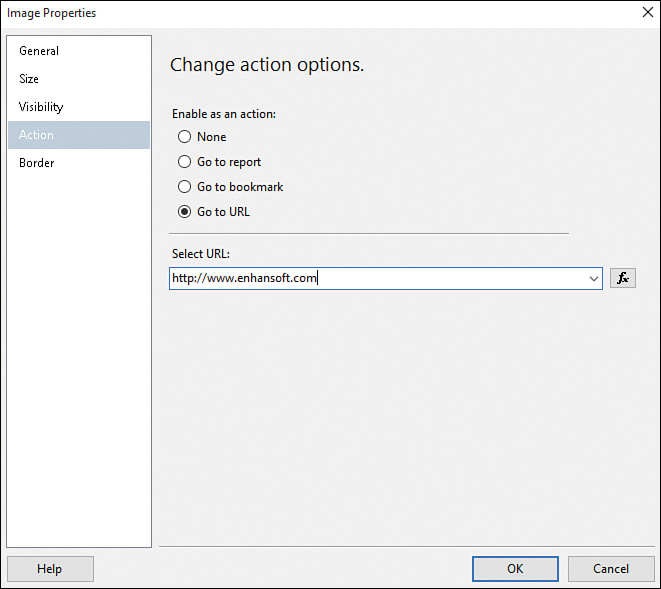
4. To add a new dataset to the report, in the Report Data section in SSDT-BI, right-click the Datasets folder and select Add Dataset. In the Dataset Properties dialog, set the name to PatchDataset and select Use a dataset embedded in my report. Under Data source, use the dropdown to select the data source created in step 3. In the Query section, enter the query shown in Listing 8.2. Click OK when the Dataset Properties dialog is complete, as shown in Figure 8.9.
LISTING 8.2 Detailed Patch Compliance Query
SELECT DISTINCT
ui.BulletinID,
ui.ArticleID,
ui.Title,
ui.dateposted,
ui.InfoURL
FROM
v_UpdateComplianceStatus UCS
LEFT OUTER JOIN dbo.v_GS_COMPUTER_SYSTEM CS on CS.ResourceID = UCS.ResourceID
JOIN v_CICategories_All catall2 on catall2.CI_ID = UCS.CI_ID
JOIN v_CategoryInfo catinfo2 on catall2.CategoryInstance_UniqueID =
catinfo2.CategoryInstance_UniqueID
and catinfo2.CategoryTypeName = 'UpdateClassification'
LEFT JOIN v_fullcollectionmembership FCM on FCM.resourceid = CS.resourceid
JOIN v_UpdateInfo ui on ui.CI_ID = UCS.CI_ID
WHERE
UCS.Status = '2'
AND cs.Name0 = @PC
ORDER BY
ui.ArticleID
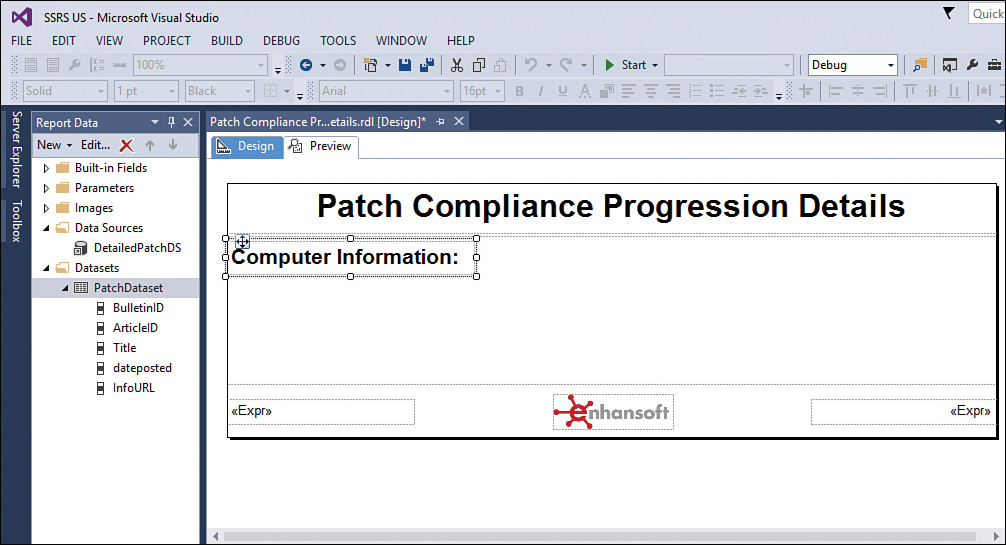
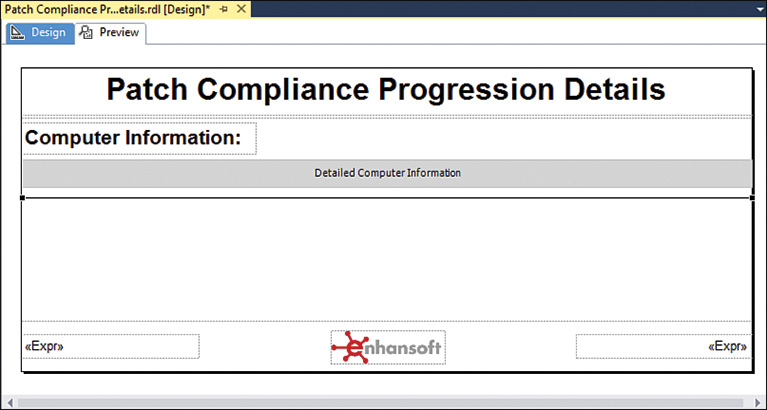
5. Add a text box item to the top-left corner of the body section. Change the text in the text box to Computer Information. Increase the font size to 16pt and set the style to bold. If required, expand the text box item’s size so that it displays the entire value, as shown in Figure 8.10.
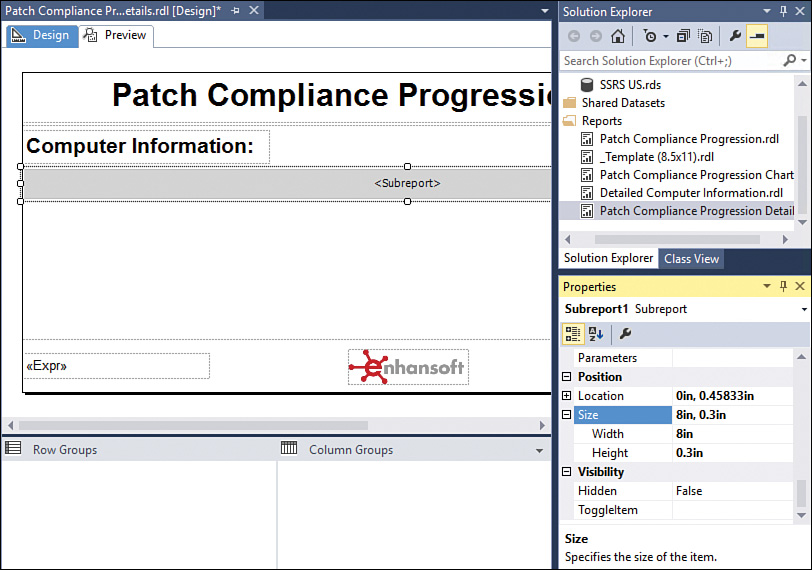
6. From the toolbox, add a subreport item to the body section of the report. Move the subreport item to the top-left corner, below the Computer Information text box created in step 5. Select the subreport item and from the Properties section, in the bottom-right corner of the screen, expand the Size property, and set the Width value to 8in and the Height value to 0.3in, as shown in Figure 8.11.
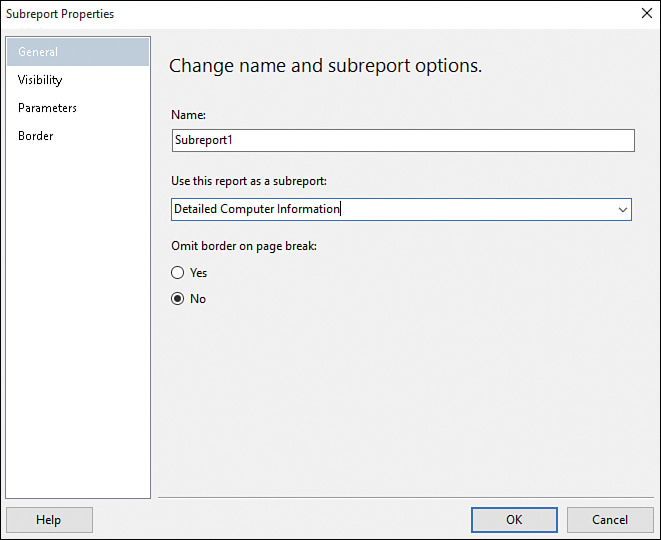
7. Right-click the subreport item and select Subreport Properties. From the General tab of the Subreport Properties dialog, use the dropdown under the Use this report as a subreport field to select the Detailed Computer Information report (see Figure 8.12).
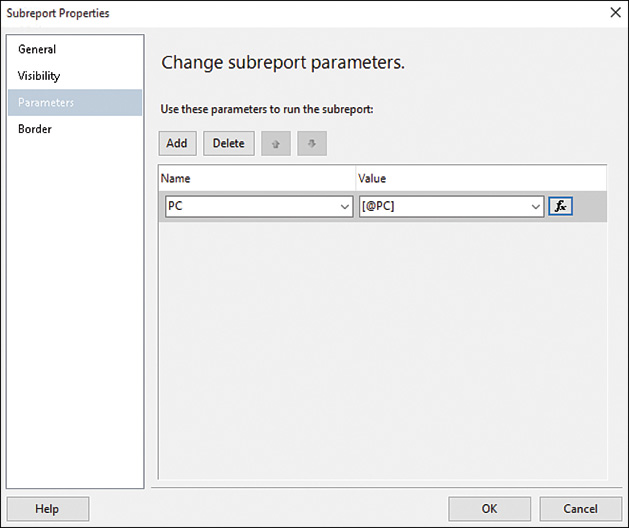
8. Select the Parameters tab of the Subreport Properties dialog and change as follows:
![]() Click Add to add and define a parameter.
Click Add to add and define a parameter.
![]() Set the Name field to PC using the dropdown lists.
Set the Name field to PC using the dropdown lists.
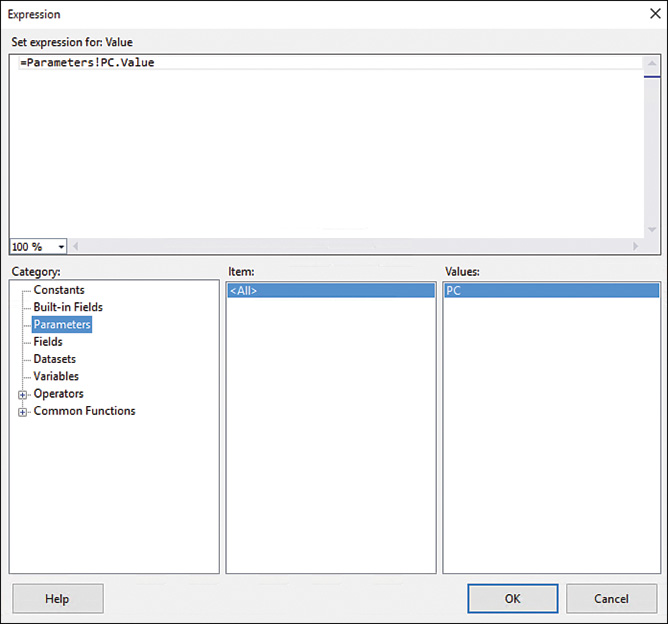
![]() Next to the Value field, click the expression button (fx). In the Expression dialog, under the Category section, select Parameters. Under the Values section, double-click PC to add it to the expression, as shown in Figure 8.13. Click OK to close the Expression dialog.
Next to the Value field, click the expression button (fx). In the Expression dialog, under the Category section, select Parameters. Under the Values section, double-click PC to add it to the expression, as shown in Figure 8.13. Click OK to close the Expression dialog.
![]() Confirm that the parameter value field is set to [@PC]. Click OK when the Subreport Properties dialog looks similar to Figure 8.14.
Confirm that the parameter value field is set to [@PC]. Click OK when the Subreport Properties dialog looks similar to Figure 8.14.
9. From the toolbox, drag the line item to the body of the report. Position the line item below the Subreport item. Resize the line item by stretching its edges to make a horizontal line that stretches across the report page, as shown in Figure 8.15.
10. Add another text box item to the left side of the body section, below the horizontal line. Change the value of the text box to Missing Patches. Increase the font size to 16pt and set the style to bold. If required, expand the text box item’s size so that it displays the entire value.
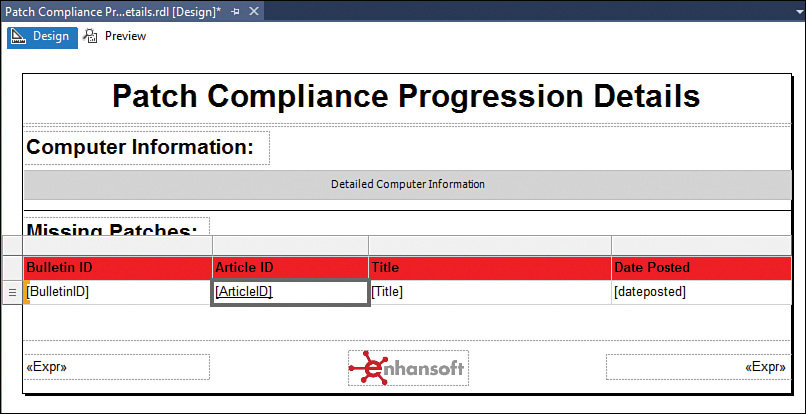
11. To add a customized table item to the body section of the report, from the toolbox on the left side, drag the Table item into the report. Make the following changes to the table (see Figure 8.16):

![]() Add an extra column to the table, for a total of four columns, and drag these columns of the dataset to the table: BulletinID, ArticleID, Title, and dateposted.
Add an extra column to the table, for a total of four columns, and drag these columns of the dataset to the table: BulletinID, ArticleID, Title, and dateposted.
![]() Modify the labels of the headers for each column to appropriate titles that represent the data and add any required spaces between words.
Modify the labels of the headers for each column to appropriate titles that represent the data and add any required spaces between words.
![]() Set the font style of the header row to bold and the background color to red.
Set the font style of the header row to bold and the background color to red.
![]() Adjust the widths of the columns so the table spans the width of the report.
Adjust the widths of the columns so the table spans the width of the report.
![]() Add interactive sorting on each column header; see Chapter 6, “Building a Basic Report,” for details.
Add interactive sorting on each column header; see Chapter 6, “Building a Basic Report,” for details.
12. As previously discussed in the “Adding Hyperlinks to a Report Item” section, add a hyperlink on the ArticleID column to open the URL for the update. To add the hyperlink, right-click the [ArticleID] cell and select Text Box Properties, as shown in Figure 8.17.

13. Select the Action tab in the Text Box Properties dialog. Select the Go to URL option. Under the Select URL field, select [InfoURL] from the dropdown. Click OK when the Text Box Properties dialog is complete, as shown in Figure 8.18. A link is now added on the ArticleID column to the URL provided in the InfoURL column of the query.
Tip: Action Visibility
To help readers identify which columns or cells in a table contain actions, the authors recommend setting the font style on cells that contain actions to underline. When running a report, readers will easily notice values that are underlined and will be aware that these values contain clickable links. Notice in Figure 8.19 that the Underline style has been set for the [ArticleID] cell.
14. Save the Patch Compliance Progression Details report and open the Patch Compliance Progression.rdl report.
15. In the Patch Compliance Progression report, change the action on the [Name0] cell to go to the Patch Compliance Progression Details report. To do this, right-click the [Name0] cell and select Text Box Properties. Select the Action tab and change the Specify a report field to Patch Compliance Progression Details. Leave the parameters section set to PC as the Name, and [Name0] as the Value. Click OK when the Text Box Properties dialog is complete, as shown in Figure 8.20, and then save the report.
16. Preview the Patch Compliance Progression report. At the prompt, select a collection and click View Report. Once the report is displayed, click a PC Name from the table.
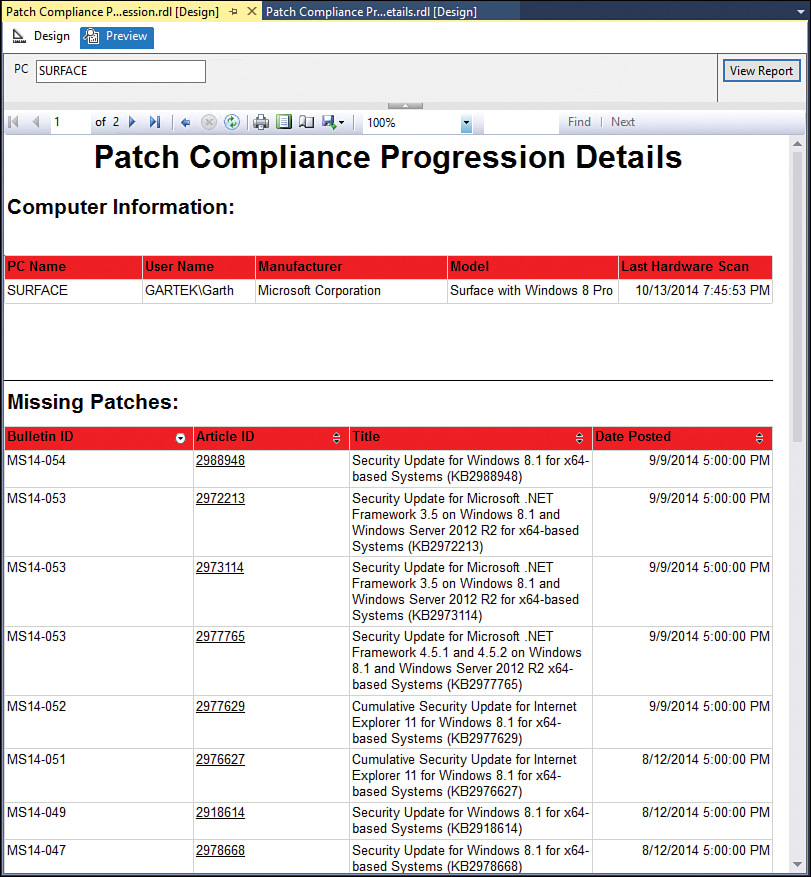
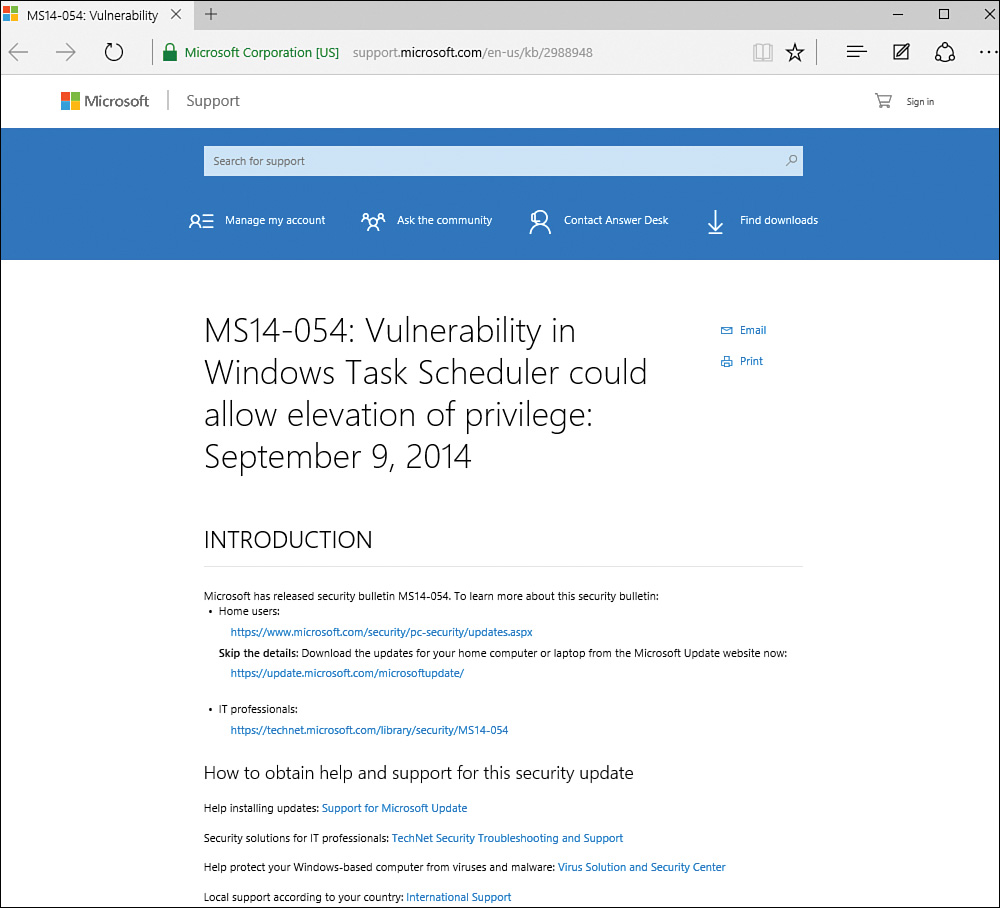
The Patch Compliance Progression Details report is now displayed, as shown in Figure 8.21. The PC Name value you clicked was passed to the report without requiring further information. Notice that the subreport item is populated with the Detailed Computer Information report for the PC Name selected, and a list of all missing patches for the PC are provided in the table item, below the Missing Patches label. In the table of missing patches, an action was added to the [ArticleID] cell. Clicking one of the listed article IDs opens the Microsoft Knowledge Base article for that patch. For example, clicking the article ID 2988948 for Bulletin MS14-054 opens its support page (see Figure 8.22).
Creating Custom Color Palettes
As you create SSRS reports, the authors recommend integrating company branding into the reports to give the readers a familiar, company-specific feel to the data being presented. This can be achieved in many ways, such as adding the company’s letterhead, color scheme, or logo. The selection of available out-of-the-box color palettes is very limited when it comes to chart items in reports. Customizing and adding a custom color palette to be used for charts can help you further match the company’s branding. The following sections discuss how to use the available color palettes and how to create a custom color palette and group result values to specific colors.
Available Out-of-the-Box Color Palettes
Before discussing how to create custom color palettes for your report, let’s look at the out-of-the-box palettes available. Although there are not many options to choose from, the palettes for chart items can easily be changed via the Properties section in SSDT-BI. Follow these steps to select one of the predefined palettes:
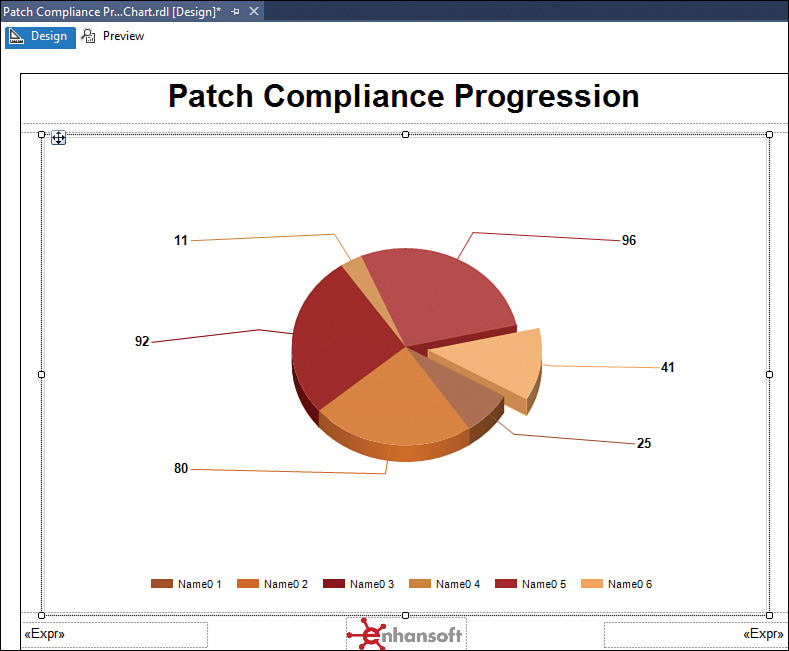
1. Using the Patch Compliance Progression Chart.rdl report as a basis, select the chart item in the body of the report.
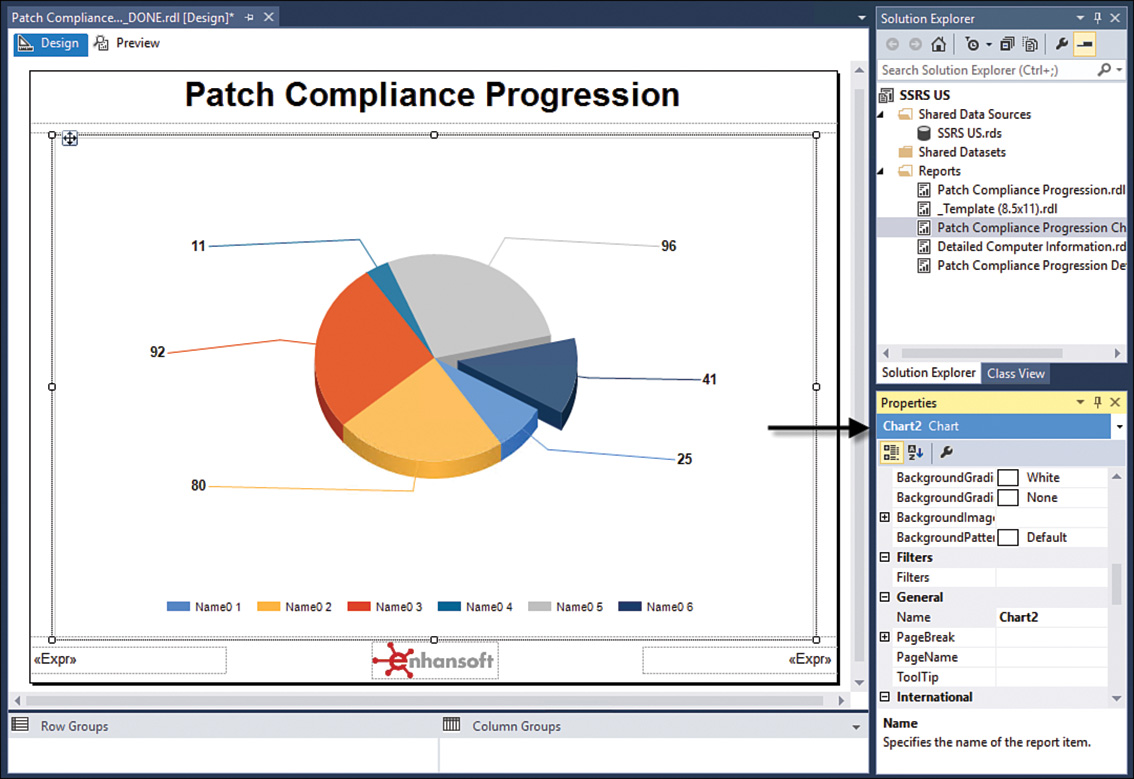
2. In the Properties section at the bottom right, ensure that the focus is set to Chart, as shown in Figure 8.23.
3. In the Properties section, click the dropdown list next to the Palette value, shown in Figure 8.24, to select from the list of available color palettes.
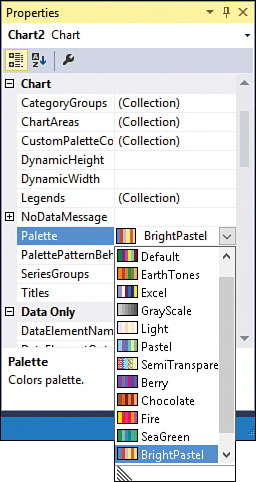
4. Select a different palette to immediately update the chart in Design mode (see Figure 8.25), so you can view your selection without having to preview the entire report.
Setting Custom Color Codes
You can use custom color codes to provide a color scheme for a report. You can define color schemes in different ways, either by providing a list of colors to cycle through or by grouping a color to a specific value. You can use both the color name and the color’s hex value when specifying color codes for reports. To set a color palette that cycles through the provided colors, using custom codes, follow these steps:
1. Open the Patch Compliance Progression Chart.rdl report.
2. From the SSDT-BI toolbar menu, select Report -> Report Properties, as shown in Figure 8.26.

3. In the Report Properties dialog, select the Code tab. On the Code tab, under the Custom Code field, enter the expression shown in Listing 8.4. When the Report Properties dialog is complete, as shown in Figure 8.27, click OK to apply the changes and close the dialog.

LISTING 8.4 Custom Color Code Expression
Private colorPalette As String() =
{"#0000FF", "Red", "Green", "#FFFF00", "Orange", "#800080"}
Private count As Integer = 0
Private mapping As New System.Collections.Hashtable()
Public Function GetColor(ByVal groupingValue As String) As String
If mapping.ContainsKey(groupingValue) Then
Return mapping(groupingValue)
End If
Dim c As String = colorPalette(count Mod colorPalette.Length)
count = count + 1
mapping.Add(groupingValue, c)
Return c
End Function
The colors that will be used are defined on the first line between the curly brackets. Include your own colors by specifying color names or color hex codes.
The expression identified in Listing 8.4 is set to cycle through the colors in the order in which they appear between the curly brackets on the first line. If the expression has cycled through all available colors, it restarts the cycle with the first color.
4. Right-click the pie section of the chart item and select Series Properties. In the Properties dialog, select the Fill tab. In the Color section, click the expression button (fx). In the Expression field, enter the expression shown in Listing 8.5 (see Figure 8.28) and click OK. In the Series Properties dialog, click OK again to apply your changes and close the dialog.
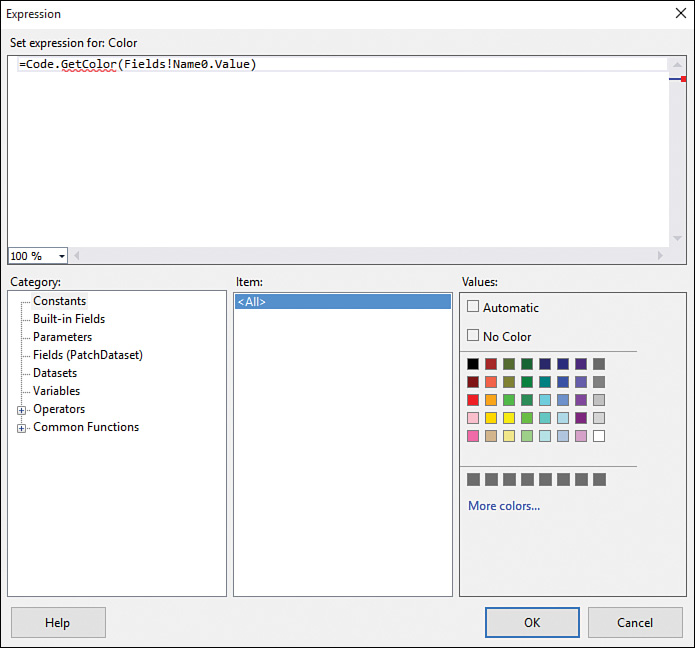
=Code.GetColor(Fields!Name0.Value)
Tip: Color Expression
The Name0 field in Listing 8.5 indicates the dataset column that is used as the chart’s Category field. This is the field of the chart where the colors from the custom color code will be applied.
5. Notice when using color expressions that the chart item’s colors are not updated based on the color codes; the previously selected palette is still shown in Design mode. To confirm that the custom color codes are functioning as expected, preview the report, and you get a view like that shown in Figure 8.29.
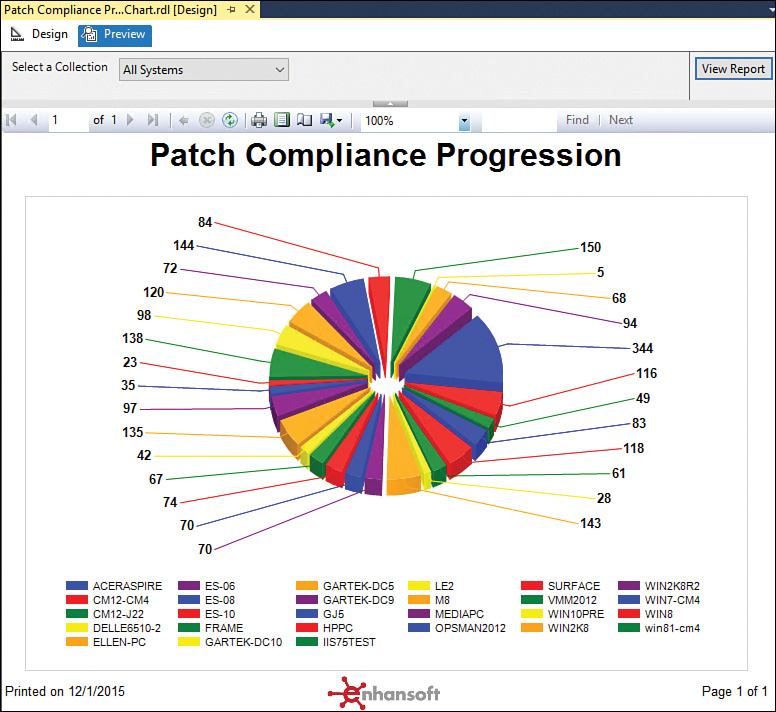
Tip: Multiple Same Colored Wedges
In Figure 8.29 there is more than one wedge of the same color (blue) in the pie chart. This occurs when a chart item contains more categories than the number of colors defined in your custom color palette. In this scenario, the colors repeat through the palette’s cycle. To avoid having multiple wedges of the same color, define more color codes than you have expected values.
Setting Custom Color Codes by Values
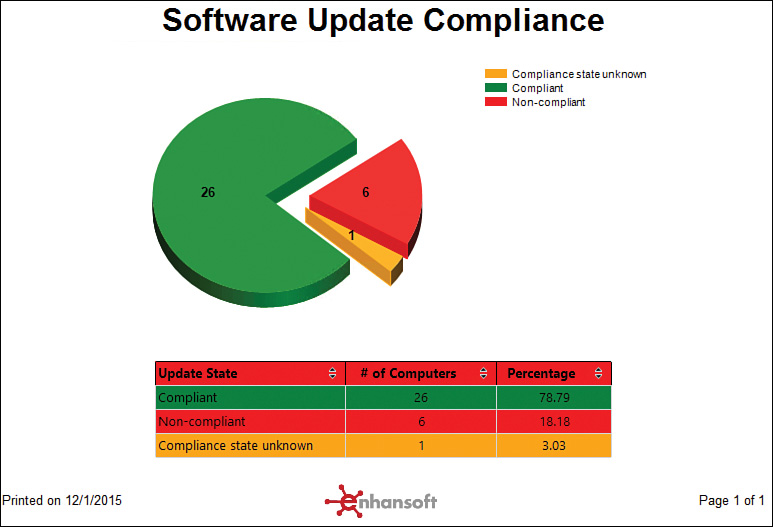
Another method of using custom color codes is to set colors based on specific values returned in a report. This section uses a new Software Update Compliance report to demonstrate associating colors with specific values. This report is provided as an extra to the book, available for download. (For information on obtaining these extras, see Appendix C, “Available Online.”) The Software Update Compliance report is similar to the Configuration Manager (ConfigMgr) out-of-the-box report named Compliance 1 - Overall compliance. The new report returns a count of systems in a compliance state (compliant, noncompliant, or unknown), based on a specified collection and update list from your ConfigMgr environment. It includes a pie chart as well as a table to illustrate system compliance. To create a custom color palette based on values, follow these steps:
1. From the SSDT-BI toolbar menu, select Report -> Report Properties.
2. In the Report Properties dialog, select the Code tab. On the Code tab, in the Custom code field, enter the expression shown in Listing 8.6. Click OK when this is complete, as shown in Figure 8.30, to apply the changes and close the dialog box.

LISTING 8.6 Custom Color Code by Value Expression
Public Function GetColor(ByVal groupingValue As String) As String
Dim c As String
If groupingValue = "Compliant" Then
c = "Green"
elseif groupingValue = "Non-compliant" Then
c = "Red"
elseif groupingValue = "Compliance state unknown" Then
c = "Orange"
End if
Return c
End Function
Tip: Color Code By Value
The GetColor function shown in Listing 8.6 associates a color based on the defined groupingValue variables. As shown, the compliant state will be displayed in green, the noncompliant state in red, and the unknown state in orange. To add more values, simply add another elseif statement with a different value and color.
3. Right-click the pie section of the chart item and select Series Properties. In the dialog, select the Fill tab. Under the Color section, click the expression button (fx). In the expression field, enter the expression shown in Listing 8.7 and click OK to apply your changes and close the Series Properties dialog.
LISTING 8.7 Color Expression Based on Status Values
=Code.GetColor(Fields!Status.Value)
4. Much as with the custom color code example in the “Setting Custom Color Codes” section of this chapter, the chart item is not updated based on the color codes in Design mode. To confirm that the custom color codes are functioning as expected, preview the report to see a result like the example shown in Figure 8.31.

Much as when applying a custom color code on a chart item, you can apply the color value expression in Listing 8.7 to any chart item that displays information based on the Status value. Follow these steps to set a color value expression on a table item’s background color:
1. Select the data value row of a table item. In the Properties section at the bottom-right, under the Fill section, set the BackgroundColor property value to the expression shown in Listing 8.7 (see Figure 8.32) by selecting Expression from the dropdown list.

FIGURE 8.32 Setting the color expressing from Listing 8.7 as the BackgroundColor value.
2. Preview the report, as shown in Figure 8.33. Notice that the table’s background color is set based on the Status value for the row.
Adding Reports to SSRS
This book has discussed multiple aspects of report writing, from creating SQL queries in SQL Server Management Studio to creating SSRS reports in SSDT-BI. However, these reports are not yet available or published to the ConfigMgr reporting services point or SSRS website. The following sections describe different methods of adding or publishing completed reports to the SSRS website for users to run. They also detail how to configure subscriptions for users to automatically email or save a report.
Once reports are added to the SSRS website, they also become available from the ConfigMgr console under the Reports folder in the Monitoring workspace. Even though all reports can be launched and run from the console, the authors recommend running reports from the SSRS website, as this provides better performance and also means you do not have to deploy the console to users who only need to run and view report data.
Manually Adding a Report to SSRS
A simple method of adding a report to SSRS is to manually browse to the SSRS website and upload a report by browsing for the .rdl file. The downside of this method is that only one report can be uploaded at a time. To manually add a report to the SSRS website, follow these steps:
1. Open a web browser and browse to the SSRS report website. For this example, the SSRS website address is http://CM16/Reports, as configured in Chapter 1, “Installing SQL Server Reporting Services,” and Chapter 2, “Installing and Configuring Configuration Manager Reporting” (see Figure 8.34).
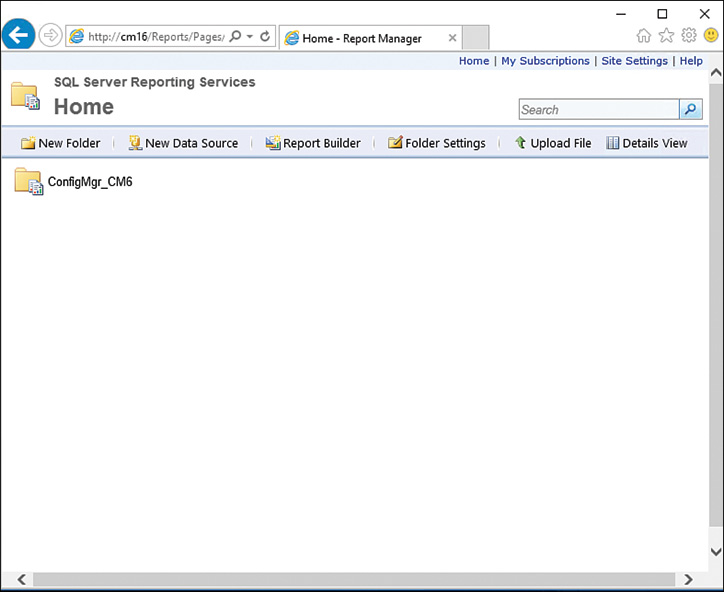
2. From the SQL Server Reporting Services home page, click the ConfigMgr_CM6 folder, which you specified during the ConfigMgr reporting services point installation in Chapter 2. A list of ConfigMgr folders is displayed; these folders are created during the installation of the reporting services point in ConfigMgr and contain out-of-the-box reports.
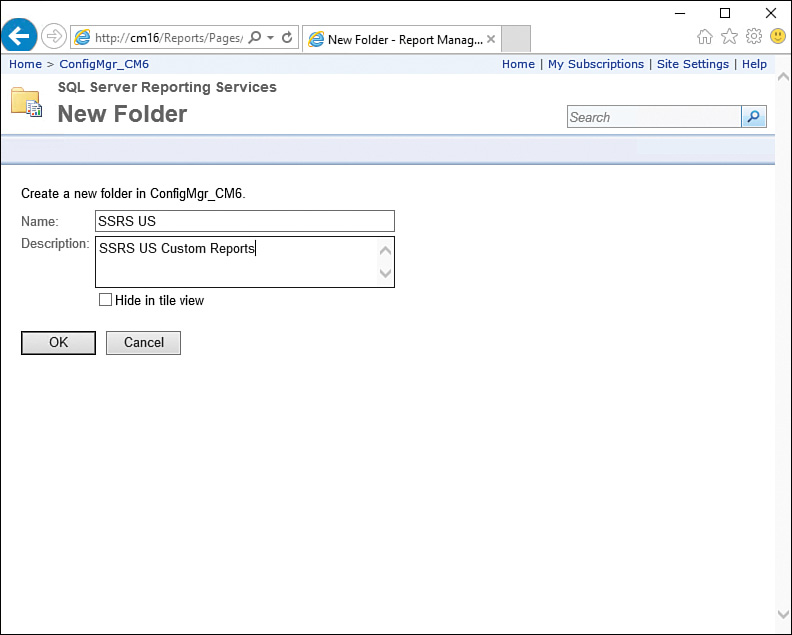
3. Create a new folder to store your custom reports by clicking New Folder, as shown in Figure 8.35, and specifying a Name for the new folder, as shown in Figure 8.36. You can also add a description for the folder, although it is not required. Click OK.

Tip: Permission Error
If you receive an error saying that you do not have permissions to add a folder or upload a report, you need to grant your user account the appropriate permissions. Only accounts with the system administrator permission can create new folders and upload reports. To grant this access, launch your browser by specifying Run As a different user and entering an account with administrator privileges to the SSRS server. From the browser, navigate to the SSRS home page (http://<SSRS servername>/reports) and select Site Settings in the top-right corner. Click the Security tab on the left to view current permissions. Either add your user account to one of the groups that already has the system administrator role or click New Role Assignment to add your user account to the system administrator role.
4. From the list of folders, click the folder just created in step 3.
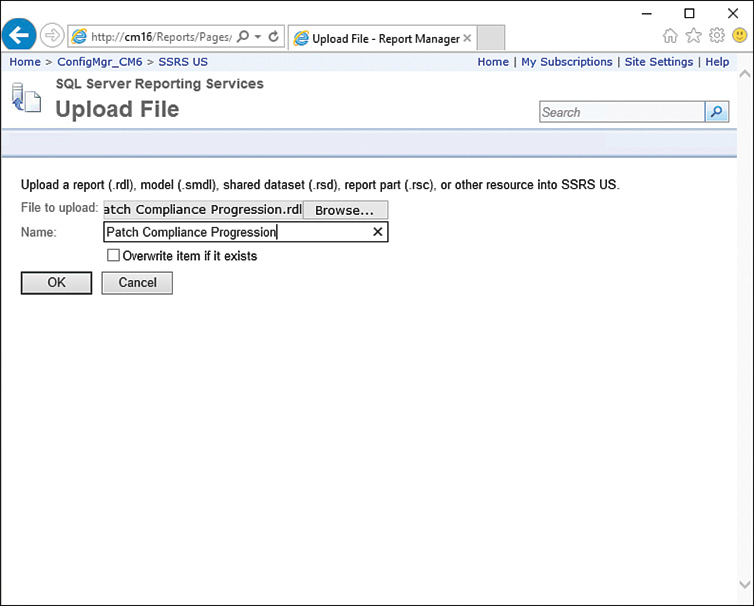
5. In the new folder, click Upload File. At the Upload File page, select Browse next to the File to upload field. Browse to your SSDT-BI project location, select a report RDL file to upload, and then click Open. The Name field for the report is populated by default with the name of the RDL file, and you can change it if desired. Click OK when you are ready to upload the selected report, as shown in Figure 8.37.
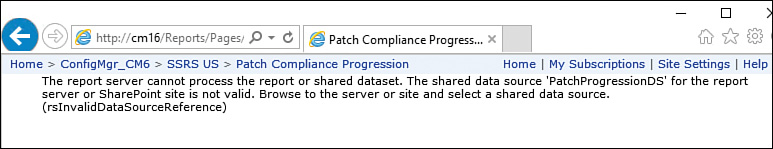
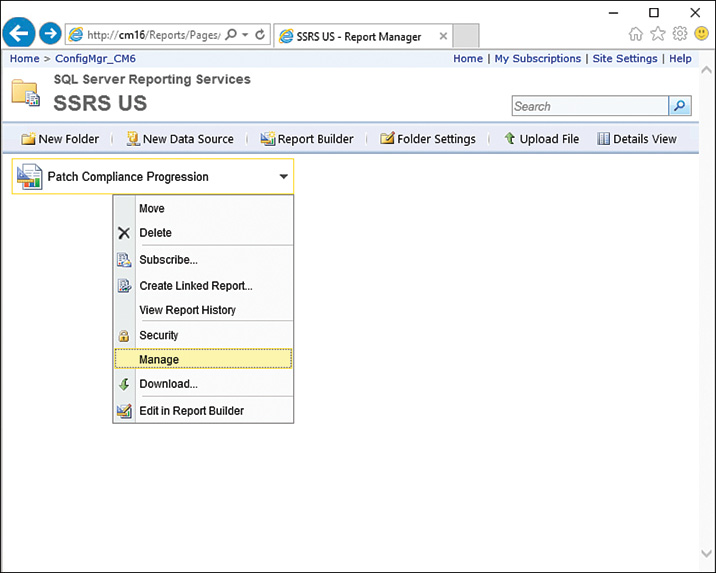
6. When you are redirected to the folder view where the report was uploaded, click the newly added report to execute it. You receive the error shown in Figure 8.38, which indicates that the shared data source is not valid for use from the SSRS website. To fix the error, you must update the report’s data source in the properties of the report on the website. To do so, go back to the folder view, hover your cursor over the report name, click the downward arrow that appears, and select Manage, as shown in Figure 8.39.
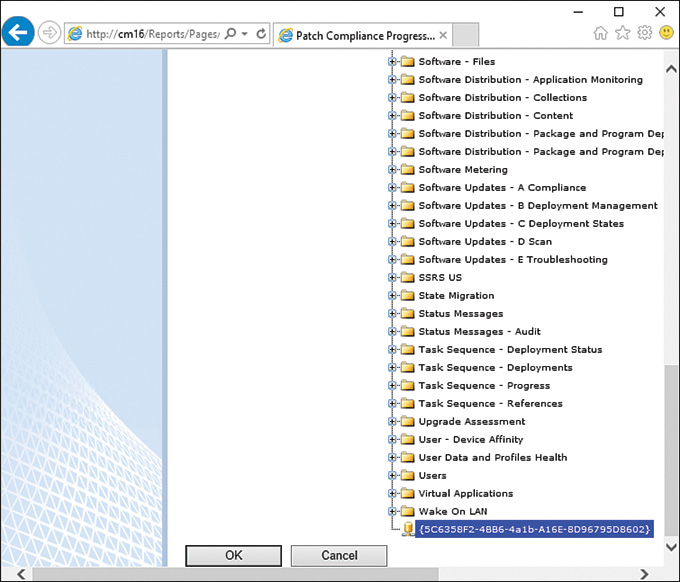
7. From the report’s properties page, select the Data Sources tab in the left pane. Click Browse next to the Select a shared data source option. Under the location field, expand the ConfigMgr folder, scroll to the bottom of the list, and select the data source item (the last item identified by the long unique ID between curly brackets), as shown in Figure 8.40. Click OK.
8. Back at the Data Sources page shown in Figure 8.41, click Apply at the bottom of the page to save the changes.

9. To test the changes and run the report, click the report name at the top of the page or go back to the folder view and click the report. Confirm that the report now runs without errors and displays properly, as shown in Figure 8.42.

10. To add additional reports now that a folder has been created, repeat steps 5 through 9.
Tip: Printing and Exporting from SSRS
SSRS allows you to export reports to the same file formats as described for SSDT-BI by clicking the diskette icon in the bar above the report title shown in Figure 8.42. SSRS also allows you to print reports on paper by using the printer icon. Also available from SSRS reports is the Find field, to the left of Export, which looks up specified text across all pages of a report.
Publishing Reports from SSDT-BI to the SSRS Website
Manually adding each individual report to the SSRS website may be acceptable for several reports; however, this can be very time-consuming if you have dozens of custom-created reports. SSDT-BI provides an option to deploy reports directly to the SSRS website. Perform the following steps to configure the required deployment options and publish reports from SSDT-BI without having to manually upload each one:
1. In SSDT-BI, open the SSRS project that contains your custom reports.
2. From the SSDT-BI menu at the top, select Project and click Properties, as shown in Figure 8.43.

3. Click Configuration Manager from the top-right of the Project Properties page.
4. In the Configuration Manager page, in the Configuration column of the project row, use the dropdown list to change the value to Release, as shown in Figure 8.44. Ensure that the Build and Deploy column values are checked and then click Close.

5. On the Properties page, under the Deployment section, enter the SSRS virtual directory URL under the TargetServerURL value. For this example, the value is http://cm16/ReportServer. Optionally, to set the folder in SSRS to store your reports, set the folder path as the TargetReportFolder value. The value is set to ConfigMgr_CM6/SSRS US to store the reports under the same folder created in the “Manually Adding a Report to SSRS” section of this chapter. Click OK when the Properties page is finished, as shown in Figure 8.45, to apply the changes.

Tip: TargetSErverURL Value
To get the correct TargetServerURL value, find the web service URL in the Reporting Services configuration on the SSRS server (described in Chapter 1). By default, this path is http://<SSRS servername>/ReportServer.
6. Before a report can be published to SSRS, you must first publish the shared data source created in SSDT-BI. To publish the data source, expand the Shared Data Source folder in the Solution Explorer, right-click the .rds object, and select Deploy, as shown in Figure 8.46.

7. Once the shared data source is deployed to SSRS, right-click a report in the Solution Explorer and click Deploy.
8. To confirm that the report is deployed, use a web browser to navigate to the SSRS website and browse to the folder identified in the TargetReportFolder value from step 5. Verify that the report is listed in the folder and runs successfully without errors.
Tip: Deploying an Entire Project
Rather than deploying one report at a time, you can deploy an entire project to SSRS by right-clicking the project name under the Solution Explorer and selecting Deploy. All shared data sources and all reports are published to SSRS. Once all reports are deployed, any actions set on objects to go to a report will function as they did in the SSDT-BI Preview mode.
Creating Report Subscriptions
Report subscriptions in SSRS allow for reports to be run on a schedule and either exported to a file share or emailed directly to users. This feature is often used for compliance reports emailed to users on a weekly or monthly basis as a reminder to verify the status of specific compliance data or keep an audit record of the specific results for that environment. Report subscriptions are set on individual reports and can specify parameters for the report to run, if applicable. To create a report subscription, follow these steps:
1. Open a web browser and browse to the SSRS report website (http://CM16/Reports).
2. From the SQL Server Reporting Services home page, browse to the folder that contains the report where you want to add a subscription.
3. Hover your cursor over the report name. Click the downward arrow that appears to the right of the report and select Manage, as shown in Figure 8.39, earlier in this chapter.
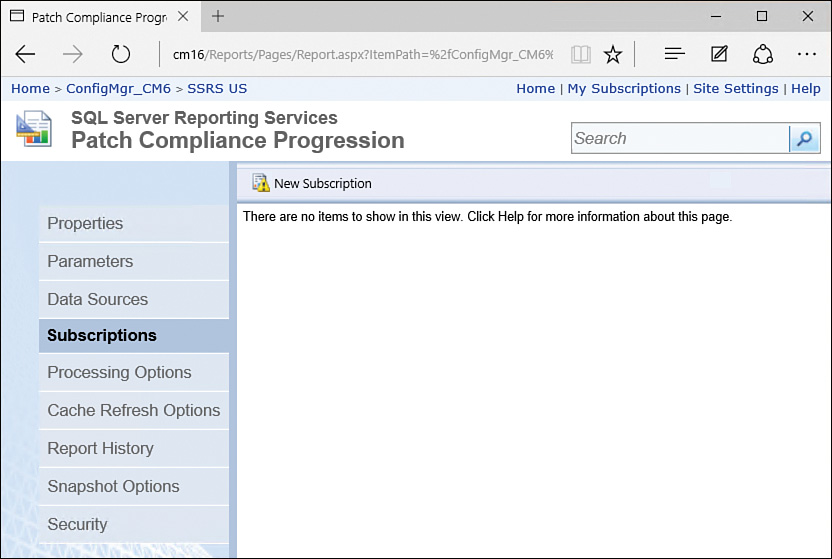
4. Click the Subscriptions tab on the left side and click New Subscription at the top of the page, as shown in Figure 8.47.
Tip: Subscription Error
When you click New Subscription, you could receive an error stating that the subscription cannot be created because of the credentials used. This typically occurs because the shared data source used for the report is set to use Windows integrated security. The authors recommend always changing the data source of reports once they have been added to the ConfigMgr reporting services point or SSRS website to use the default Microsoft-created data source, described in the “Manually Adding a Report to SSRS” section of this chapter. While this might add an extra step to publishing reports, it ensures that all reports are consistent and support the creation of subscriptions, as it uses the service account specified during the configuration of the ConfigMgr reporting services point when running reports.
From the New Subscription page, there are two subscription types available for reports:
![]() Windows File Share
Windows File Share
![]() Email
Email
These methods are described in the following sections.
Windows File Share Subscriptions
You can configure a Windows File Share subscription to export the selected report to the specified file type and store it at the share path identified. Follow these steps to configure a Windows File Share subscription:
1. From the Delivered dropdown, select Windows File Share. The subscription detail fields changes based on the selected delivery format. Figure 8.48 shows the options for Windows File Share delivery.
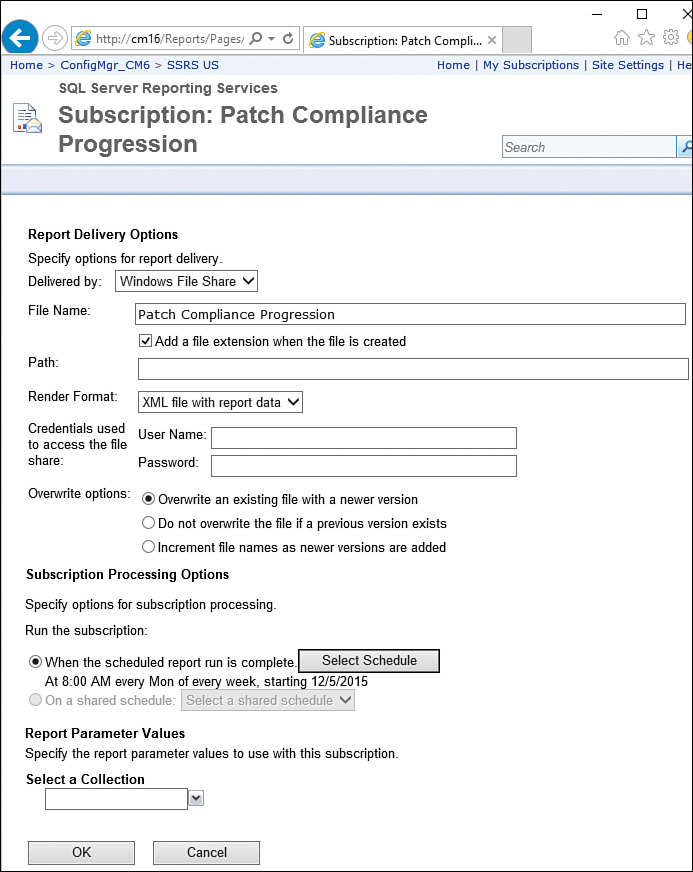
2. For the Path field, enter the share path where the report export file should be stored.
3. From the Render Format dropdown, identify the file type for the report export, as shown in Figure 8.49.

4. For the Credentials used to access the file share field, specify the username and password of an account that has access to save the report to the share.
5. For the Overwrite options field, select the behavior that should occur if the exported report already exists on the share. Select to either overwrite the existing file, not overwrite the file (it will not be exported), or increment the file names as newer versions are added (which is the ideal option if you need to keep track of reports over weeks, months, years, and such).
6. In the Subscription Processing Options section, specify a schedule for the report to run by clicking Select Schedule.
7. If the report contains any parameters, the Report Parameter Values section appears. The parameter prompts here look similar to when you’re running the report: simple textbox, dropdown list, or multi-value select. Specify the parameter used to run the report for the subscription.
8. Click OK to create the subscription.
Email Subscriptions
An email subscription sends an email to specified addresses and attaches the export of the selected report. To configure an email subscription, follow these steps:
1. At the Delivered by field, select E-Mail from the dropdown. The subscription detail fields change based on the selected delivery format. Figure 8.50 shows the options for email delivery.

2. In the To, CC, and BCC fields, specify the email addresses for the recipients of the report.
3. Optionally specify an email address in the Reply-To field that will appear when a recipient replies to the automatic subscription email.
4. Use the Subject field to specify the email’s subject.
5. Select from the Render Format dropdown to identify the file type for the report export.
6. Under the Subscription Processing Options section, click Select Schedule and specify a schedule for the report to run.
7. If the report contains any parameters, the Report Parameter Values section appears. The parameter prompts look similar to when you’re running the report: simple textbox, dropdown list, or multi-value select. Specify the parameter used to run the report for the subscription.
8. Click OK to create the subscription.
Demonstrating Report Drillthroughs
The purpose of this demonstration is for you to become familiar with the different ways to create reports that allow users to drillthrough to detailed reports. You will create reports that contain many of the features discussed in the “Using Report Drillthroughs” section, including Go to report actions, Go to URL (hyperlinks), and subreport items.
Patch Compliance Progression Drillthrough Series
Follow the procedure in the “Using Report Drillthroughs” section of this chapter to create the following items and features. You will be creating new reports and modifying existing ones. Ensure that you have completed the previous demonstrations in Chapters 6 and 7 before proceeding with the following actions:
![]() Make a copy of the _Template (8.5x11).rdl report and name the copy Detailed Computer Information. Do the following for the Detailed Computer Information report:
Make a copy of the _Template (8.5x11).rdl report and name the copy Detailed Computer Information. Do the following for the Detailed Computer Information report:
![]() Create a data source for the report with reference to your shared data source.
Create a data source for the report with reference to your shared data source.
![]() Create a dataset using the query from Listing 8.1.
Create a dataset using the query from Listing 8.1.
![]() Add a table item to the body section of the report. The table should contain all five columns from the dataset, proper labels for the column headers, and interactive sorting. The header row should be set to bold font style with a red background color, and the table should span the width of the page.
Add a table item to the body section of the report. The table should contain all five columns from the dataset, proper labels for the column headers, and interactive sorting. The header row should be set to bold font style with a red background color, and the table should span the width of the page.
![]() Preview the report to ensure that it displays properly and then save the report.
Preview the report to ensure that it displays properly and then save the report.
![]() Make a copy of the _Template (8.5x11).rdl report and name the copy Patch Compliance Progression Details. Do the following for this report:
Make a copy of the _Template (8.5x11).rdl report and name the copy Patch Compliance Progression Details. Do the following for this report:
![]() Create a data source for the report with reference to your shared data source.
Create a data source for the report with reference to your shared data source.
![]() Create a dataset using the query from Listing 8.2.
Create a dataset using the query from Listing 8.2.
![]() Add a horizontal line in the middle of the body section to split the body in two.
Add a horizontal line in the middle of the body section to split the body in two.
![]() In the top half of the body section, add a text box that contains the text Computer Information. Add a subreport item below the text box with reference to the Detailed Computer Information report, as detailed in the “Adding a Subreport Item” section of this chapter.
In the top half of the body section, add a text box that contains the text Computer Information. Add a subreport item below the text box with reference to the Detailed Computer Information report, as detailed in the “Adding a Subreport Item” section of this chapter.
![]() In the bottom half of the body section, add a text box that contains the text Missing Patches. Add a table item below the text box. In the table item, add the BulletinID, ArticleID, Title, and DatePosted columns from the dataset. Set the header row font to bold and the background color to red. Ensure that the table spans the width of the page. Enable interactive sorting on each column header.
In the bottom half of the body section, add a text box that contains the text Missing Patches. Add a table item below the text box. In the table item, add the BulletinID, ArticleID, Title, and DatePosted columns from the dataset. Set the header row font to bold and the background color to red. Ensure that the table spans the width of the page. Enable interactive sorting on each column header.
![]() Set an action on the [ArticleID] cell to go to the URL specified in the [InfoURL] column of the dataset.
Set an action on the [ArticleID] cell to go to the URL specified in the [InfoURL] column of the dataset.
![]() Set a hyperlink on the image item of the footer to go to a specific website address.
Set a hyperlink on the image item of the footer to go to a specific website address.
![]() Save the report.
Save the report.
![]() Modify the Patch Compliance Progression report to add an action on the [Name0] cell to go to the Patch Compliance Progression Details report. Save the report.
Modify the Patch Compliance Progression report to add an action on the [Name0] cell to go to the Patch Compliance Progression Details report. Save the report.
![]() Preview the Patch Compliance Progression report and test the drillthrough functionality set on the PC Name values of the table.
Preview the Patch Compliance Progression report and test the drillthrough functionality set on the PC Name values of the table.
When clicking on a PC Name value, ensure that the Patch Compliance Progression Details report is displayed and the PC Name value is passed to the report’s parameter without a prompt. Confirm that the subreport item is also displayed with information for the selected PC. Verify that the ArticleID values contain a link that opens the specific Microsoft Knowledge Base article in your browser and that clicking the image in the footer opens the URL that was specified.
Computer Hardware Information Drillthrough Series
For this part of the demonstration, you will create a drillthrough series of reports based on the Computer Hardware Information report. You will need to create a new report from the Computer Hardware Information Chart as well as modify the Computer Hardware Information Prompt report. The information to create this drillthrough series follows:
![]() Make a copy of the Computer Hardware Information Chart.rdl report and name the copy Hardware Model Chart.rdl. Modify this new report as follows:
Make a copy of the Computer Hardware Information Chart.rdl report and name the copy Hardware Model Chart.rdl. Modify this new report as follows:
![]() Modify the Dataset query to add the
Modify the Dataset query to add the WHERE statement shown in Listing 8.3.
![]() Set the Chart Data Value section to Count(Model0) and the Category Group section to Model0.
Set the Chart Data Value section to Count(Model0) and the Category Group section to Model0.
![]() Enable Show Data Values on the pie chart.
Enable Show Data Values on the pie chart.
![]() Remove all actions from the pie chart.
Remove all actions from the pie chart.
![]() Save the report.
Save the report.
LISTING 8.3 WHERE Statement for the Hardware Model Chart Report
WHERE
CS.Manufacturer0 LIKE @Make
![]() Open and modify the Computer Hardware Information Prompt.rdl report as follows:
Open and modify the Computer Hardware Information Prompt.rdl report as follows:
![]() Add a subreport item in the body of the report, above the existing table item.
Add a subreport item in the body of the report, above the existing table item.
![]() Set the subreport item’s size to 3×3in.
Set the subreport item’s size to 3×3in.
![]() Set the subreport value to the Hardware Model Chart. Add to the subreport a parameter with the Name field set to Make and the Value field set to an expression for the Parameter value Manu.
Set the subreport value to the Hardware Model Chart. Add to the subreport a parameter with the Name field set to Make and the Value field set to an expression for the Parameter value Manu.
![]() Save the Computer Hardware Information Prompt.rdl report.
Save the Computer Hardware Information Prompt.rdl report.
![]() Open and Preview the Computer Hardware Information Chart.rdl report. From the pie chart, click on a manufacturer’s pie wedge.
Open and Preview the Computer Hardware Information Chart.rdl report. From the pie chart, click on a manufacturer’s pie wedge.
Clicking a pie wedge displays the Computer Hardware Information Prompt report. The subreport item should be populated with a chart of all computer models for that specific manufacturer, and the table item should provide a list of every system from that manufacturer. Ensure that the reports are working as detailed before proceeding.
Demonstrating Custom Color Palettes
The purpose of this demonstration is to practice creating custom color palettes and applying the colors both in a cycle and for specific values. For these demonstrations, you will update both the previously created Patch Compliance Progression Chart and Computer Hardware Information Chart reports. Ensure that these reports are up to date from previous demonstrations and are working as intended before continuing.
Applying a Custom Color Palette to Cycle Through Color Codes
For this demonstration, using the Patch Compliance Progression Chart.rdl report, add a custom color palette with color codes of your choice. This color palette should cycle through all specified colors. Set the pie chart’s color value to the newly created color palette.
Remember to preview the report to ensure that the color palette is properly applied to the chart item, as you will not see any indication while in Design mode. Specify enough unique colors to reduce the number of times the same colors are repeated in the chart.
Applying a Custom Color Palette Based on Values
Modify the previously created Computer Hardware Information Chart.rdl report by adding a custom color palette. The color code function should display a specific unique color for each manufacturer name value in the chart.
Run the report and take note of all manufacturers returned in the report. Then create your color code function, associating each manufacturer with a unique color. Set the pie chart’s color value to the newly created color palette, using an expression, as demonstrated in the “Setting Custom Color Codes by Value” section of this chapter.
When you are finished, preview the report to validate that the colors specified for each manufacturer are displayed correctly.
Demonstrating Adding Reports to SSRS
The purpose of this demonstration is to add the reports created throughout the book to your SSRS website. This will help you become familiar with the different methods of manually adding reports, publishing reports, and setting subscriptions in SSRS for your environment. At the end of this demonstration, you should have a good understanding of the benefits and effort involved with each method and should be able to determine the best approach for your environment.
Manually Adding Reports to the SSRS Website
For this section of the demonstration, manually add the reports listed below to your SSRS website. Begin by creating a new folder under the ConfigMgr_<SiteCode> folder in SSRS. Set a name for this folder. Manually add the following reports to the folder by using the Upload File button in SSRS:
![]() Patch Compliance Progression.rdl
Patch Compliance Progression.rdl
![]() Patch Compliance Progression Chart.rdl
Patch Compliance Progression Chart.rdl
![]() Patch Compliance Progression Details.rdl
Patch Compliance Progression Details.rdl
![]() Detailed Computer Information.rdl
Detailed Computer Information.rdl
Run each report to ensure that there are no errors and to ensure that the reports display properly. Remember that you need to modify the data sources value of each report once it is added to SSRS for it to run without errors. When running the report, try clicking the actions on items within the report to ensure that they function as expected; for example, click a system name in the Patch Compliance Progression report to verify that the Patch Compliance Progression Details report is displayed without further prompts.
Publishing Reports to SSRS
For this demonstration, you will update the SSDT-BI project properties to allow publishing of reports directly to SSRS. Begin by opening the project properties page. Set the report configuration to Release (by clicking the Configuration Manager icon). On the properties page, set the TargetServerURL value to your SSRS Web Service URL and the TargetReportFolder value to the folder path of the new folder created in the previous demonstration (see “Manually Adding Reports to the SSRS Website”). Before publishing reports to SSRS, publish the shared data source. Then publish the following reports to SSRS:
![]() Computer Hardware Information.rdl
Computer Hardware Information.rdl
![]() Computer Hardware Information Prompt.rdl
Computer Hardware Information Prompt.rdl
![]() Computer Hardware Information Chart.rdl
Computer Hardware Information Chart.rdl
![]() Hardware Model Chart.rdl
Hardware Model Chart.rdl
Open the SSRS website and run each report to ensure that there are no errors and to ensure that each report displays properly. When running a report, try clicking the actions on items within the report to ensure that they function as expected; for example, click a pie wedge in the Computer Hardware Information Chart report to verify that the Computer Hardware Information Prompt report is displayed and the Subreport item is populated without errors or further prompts.
Creating a Subscription
For this part of the demonstration, add a subscription to one of the newly added reports of your choice at the SSRS website. To add the subscription, hover over a report title from the folder view, click the downward arrow that appears beside the name, and select Manage. On the Subscriptions tab, create a new Windows File Share subscription. Have the subscription create a PDF format of the report and store it on a share. (If you do not have a share available, create one on your ConfigMgr server for test purposes.) Enter the user name and password for an account that has read and write access to the share. Set the subscription schedule to run once and enter a start time a few minutes ahead of your current time. Remember, if you are using a published report instead of a manually added report, you must modify the data source on the report before creating the subscription.
Summary
This chapter has discussed many advanced features available in SSRS reports to help you create a more complete and enhanced reader experience. You have learned how to enable readers to view high-level reports and then seamlessly drillthrough to more detailed and specific reports by adding actions on report items. With SSRS reports you can also link software updates to Microsoft Knowledge Base articles. In this chapter you have also learned how to create custom color palettes for reports and apply them to items such as charts. In addition, you have learned how to define custom colors for specific values and how to apply custom colors to any report item, such as table rows.
You have already created many reports throughout the book. This chapter has explained and demonstrated how to make these reports available from an SSRS website. The chapter has discussed different methods for this, and the demonstrations at the end of the chapter have provided opportunities to both manually add reports to the SSRS website individually and publish reports from the SSDT-BI tool directly to SSRS. Once reports are added to SSRS, you can create subscriptions to allow users to automatically receive reports either by email or by retrieving them from a network share.