
This appendix is a compilation of the “OpsMgr by example” articles published in our Operations Manager (OpsMgr) blog (http://ops-mgr.spaces.live.com) that discuss configuration and tuning tips for several of the OpsMgr 2007 management packs. The intent is to provide a 5000-foot/meter perspective as well as show the details for a particular type of tuning performed in a sample deployment.
For new “by example” information and updates to existing articles, be sure to check http://ops-mgr.spaces.live.com. We expect to continue adding to the “by example” series on the blog.
Because so much of Windows hinges on a successful implementation of the Active Directory (AD), we will begin by looking at installation, configuration, and tuning tips for the AD management pack.
Perform the following steps to install the AD MP:
Download the Active Directory management pack (http://www.microsoft.com/downloads/details.aspx?FamilyId=008F58A6-DC67-4E59-95C6-D7C7C34A1447&displaylang=en) and the Active Directory Management Pack Guide (http://www.microsoft.com/downloads/details.aspx?FamilyID=4b945737-e77f-4851-a11c-c4f79c36c360&DisplayLang=en).
Read the Management Pack Guide from cover to cover. This document spells out in detail some important pieces of information you will need to know.
Import the AD management pack, using either the Operations console or PowerShell.
Deploy the OpsMgr agent to all domain controllers (DCs). The agent must be deployed to all DCs. Agentless configurations will not work for the AD management pack.
Get a list of your domain controllers from the Operations console. In the Authoring space, navigate to Authoring -> Groups -> Domain Controllers. Right-click the group(s) and select View Group Members.
Enable Agent Proxy configuration on all DCs identified from the groups. This is in the Administration space, under Administration -> Device Management -> Agent Managed. Right-click each domain controller, select Properties, click the Security tab, and then check the box labeled Allow this agent to act as a proxy and discover managed objects on other computers. Perform this for every domain controller, even if the DC is added after your initial configuration of OpsMgr.
Configure the Replication account in the Operations console, under Administration -> Security (full details for this are in the AD MP Guide). This also has to be done for every domain controller, even if a DC is added after your initial OpsMgr configuration.
Validate the existence of the MOMLatencyMonitors container. Within this container, subfolders should be created for each DC, with the name of each domain controller. If the container does not exist, it is often due to insufficient permissions. (See information on configuring the Replication account within the AD MP Guide for details.)
Open the Operations console. Go to the Monitoring space and navigate to Monitoring -> Microsoft Windows Active Directory -> Topology Views. You may have to set the scope to the AD Domain Controllers Group to get these views to populate.
Check to make sure Active Directory shows up under Monitoring -> Distributed Applications as a distributed application that is in the Healthy, Warning, or Critical state. If it is in the Not Monitored state, check for domain controllers that are not properly installed or are in a “gray” state.
We encountered and resolved the following alerts while tuning the Active Directory management pack:
Alert: AD Replication Monitoring – Access denied.
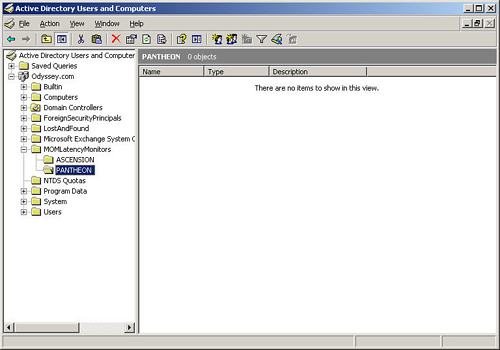
Issue: This occurred on one domain controller. There was also an alert telling us the MOMLatencyMonitors container could not be created. We validated the container by logging in to the domain controller and opening up Active Directory Users and Computers. We specified View/Advanced Features and verified the container (and the two existing domain controllers as subcontainers) did exist, per Figure A.1.
Resolution: The issue was already resolved because the Management Server Action account (MSAA) had the permissions required to create this container. We validated the MOMLatencyMonitors container existed and that the container included subfolders matching the name of each domain controller. (If the container does not exist, it is often due to insufficient permissions; see the AD MP Guide for configuration information for the Replication account.)
Alert: The Op Master PDC Last Bind latency is above the configured threshold.
Issue: The bind from the domain controller identified in the alert to the PDC emulator is slower than 5 seconds for a warning, and slower than 15 seconds for an error. This occurred in a remote site connecting to a central site with the PDC emulator role.
Resolution: The alert is caused by a slow link between the two locations, or by a condition where one of the two servers identified may have been overloaded. In this particular case, it was caused by a domain controller that was overloaded due to insufficient hardware and had to be decommissioned.
Alert: Session setup failed because no trust account exists: Script – AD Validate Server Trust Event.
Issue: Specific computer accounts were identified multiple times as not containing a trust account.
Resolution: This is caused by systems that believe they are part of the domain but no longer are, or by imaged systems. Resolve this by dropping and rejoining the system to the domain, or closing the alert if the system is no longer online.
Alert: KCC cannot compute a replication path.
Issue: KCC detected problems on multiple domain controllers.
Resolution: Connectivity was lost from the central site to a remote site for a period of several hours. The remote site was down due to a power outage, and errors were logged every 15 minutes from when it was down until when the site was back online.
This also occurred when a domain controller was shut off, but still existed from the perspective of Active Directory. This can also occur in environments where the site topology automatically generates the site links, but the network is configured such that some sites cannot see other sites. (As an example, consider a configuration with a hub in Dallas and sites in Frisco and Plano, where both sites can see Dallas but cannot see each other.)
Alert: A problem was detected with the trust relationship between two domains.
Issue: The domain controllers (DCs) could not connect to the domain controller in the other domain. This was due to a routing issue between the specific domain controllers and the domain controller in the remote domain. Remote sites were connected via VPN and could not route to that subnet.
Resolution: Provide routing from the domain controllers to the domain controller in the other domain.
Alert: AD Replication is slower than the configured threshold.
Intersite Expected Max Latency (min) default 15.
Intrasite Expected Max Latency (min) default 5.
Issue: This alert will also occur if connectivity is lost between sites for a long enough period of time.
Resolution: If the alert is not current and not repeating, and if replication is occurring and the Repadmin Replsum task comes up clean, this alert can be noted (to see if there is a consistent day of the week or time at which it occurs) and closed. We added a diagnostic to the AD Replication Monitoring monitor for the critical state, taking the information from the Repadmin Replsum task (you must have the admin utilities installed on the DC for this to work):
<LINELENGTH>90</LINELENGTH><Configuration> <ApplicationName>REPADMIN.EXE</ApplicationName> <SupportToolsInstallDir>%ProgramFiles%Support Tools</SupportToolsInstallDir> <CommandLine>/replsum</CommandLine> <TimeoutSeconds>1200</TimeoutSeconds> </Configuration>We created the diagnostic to run automatically using the following:
Program—REPADMIN.EXE
Working Directory—%ProgramFiles%Support Tools
Parameters—/replsum
Available options included changing the replication topology to replicate every 15 minutes and configuring overrides. To resolve the issue, we tried creating a custom group for the servers in the location (see the article “Creating Computer Groups Based on AD Site in OpsMgr” at http://cameronfuller.spaces.live.com/blog/cns!A231E4EB0417CB76!950.entry for additional information). We created an override for the new group, changing the Intersite Expected Max Latency to 120, making it double the configuration in AD Sites and Services.
We performed this configuration for each remote location that did not have a 15-minute replication interval. You can also do this for all domain controllers, using the domain controller computer group(s). This did not function as expected but is being used as an example for how overrides can be creatively configured, in this case based on sites!
Alert: AD Replication is slower than the configured threshold.
Intersite Expected Max Latency (min) default 15.
Intrasite Expected Max Latency (min) default 5.
Issue: The remote location replication topology was defined to be 60 minutes, not the standard of 15.
Resolution: Currently there is no good workaround to change these configurations and maintain a Microsoft-supported configuration after the change is made. There are discussions in the newsgroups about changing these configurations through exporting the MP, changing the XML, and reimporting it as unsealed, but Microsoft will not support the AD MP if it is changed in this way. If your environment does not use the 15-minute latency, the recommendation right now is to disable both this alert and the AD Replication is occurring slowly alert.
Alert: AD Replication is occurring slowly.
Issue: This is the same issue identified in the AD Replication is slower than the configured threshold alert. This rule does not provide the ability to override the default configuration of 15 minutes. The AD environment is not configured with the default of 15 minutes, so these rules do not apply because they are still replicating within a successful timeframe.
Resolution: We disabled this rule (AD Replication is occurring slowly) for group AD Domain Controller Group (Windows 2003 Server). You could alternatively do this for individual servers if there were a limited number of these where the AD replication was not configured with default replication time of 15 minutes. We then closed the alerts.
Alert: Script Based Test Failed to Complete.
Issue: AD Database and Log: The script ‘AD Database and Log’ failed to create object ‘McActiveDir.ActiveDirectory.’ The error returned was ActiveX component can’t create object (0x1AD).
Resolution: This occurred on a 64-bit system. Uninstall OOMADS using Add/Remove Programs -> Active Directory Management Pack Helper Object (the original version was .05MB in size). Then reinstall the 64-bit equivalent (AMD64 in this case). To do this, we had to copy the MSI locally to the system to install it; after installation, the size was .07MB within Add/Remove programs.
Alert: Script or executable failed to run.
Issue: On the domain controllers, a failure on ADLocalDiscoverDC.vbs occurred on each domain controller prior to OpsMgr 2007 SP 1.
Resolution: Based on a thread on the Microsoft TechNet website (http://forums.microsoft.com/technet/showpost.aspx?postid=1628491&siteid=17&sb=0&d=1&at=7&ft=11&tf=0&pageid=1), this appears to be a pre-SP 1 issue, so we disabled the rule until SP 1 is available. To disable it, navigate to Authoring -> Management Pack Objects -> Object Discoveries. Then perform a Find operation on AD DC Local Discovery. You may have two of these rules (Windows 2000 Server and Windows Server 2003), depending on the versions of the management pack that were imported into your management group. Create an override to disable both rules for all objects of Windows Domain Controller. Remove these overrides when you implement Service Pack 1 for OpsMgr 2007.
Problem: You cannot disable this until all domain controllers are already in OpsMgr. If you disable the rule before adding domain controllers, those domain controllers are never added.
We encountered a number of other issues while tuning the AD MP.
Issue: Domain controllers in the DMZ would not install, even though they are in a domain within the forest.
Resolution: We copied over the files and manually installed the agents. We then opened up port 5723 on the firewall between these systems and the OpsMgr server and removed port 1270, which had been used for MOM 2005. (This issue should only occur if you previously used MOM 2005.)
Issue: One DC showed extremely high CPU usage/cscript errors.
Resolution: The server was running with 256MB of memory and using significantly more than that even before the OpsMgr agent was deployed to the server. After we deployed the agent, memory usage went significantly higher and resulted in cscript errors that timed out, due to the slowness of alerts.
Alert: One or more domain controllers may not be replicating.
Issue: The AD MP will report replication issues across all DCs if only one is down (and thus not able to replicate its monitor objects).
Resolution: Ensure all domain controllers are monitored by OpsMgr. Validate replication in the environment.
Tuning concept: On a weekly basis, close out any unresolved alerts older than 5 days if they represent issues that may have self-resolved.
With Active Directory now under control, we will move to the Exchange 2003 management pack. The Exchange MP is probably the most complex OpsMgr management pack.
Note: Version of the Exchange Management Pack
Unless noted otherwise, all references to Exchange refer to Exchange 2003, because this material was developed prior to the release of the Exchange 2007 management pack for Operations Manager 2007.
Perform the following steps to install the Exchange MP:
Download the Exchange 2003 management pack (http://www.microsoft.com/downloads/details.aspx?FamilyId=9FF454F4-6D34-4FB9-9E0B-F5B68C6EDC4F&displaylang=en) and the Exchange Management Pack Guide (http://download.microsoft.com/download/7/4/d/74deff5e-449f-4a6b-91dd-ffbc117869a2/om2007_mp_exsrvr2003.doc).
Read the Management Pack Guide from cover to cover. This document spells out in detail important pieces of information you need to know.
Import the Exchange management pack (using either the Operations console or PowerShell).
Deploy the OpsMgr agent to all Exchange servers. The agent must be deployed to all Exchange servers. Agentless configurations will not work for the Exchange management pack.
Get a list of all Exchange servers from the Operations console. In the Authoring space, navigate to Authoring -> Groups -> Microsoft Exchange 2003 Server Group. Right-click the group(s) and select View Group Members.
Enable Agent Proxy configuration on all Exchange servers identified from the groups. This is in the Administration space, under Administration -> Device Management -> Agent Managed. Right-click each domain controller, select Properties, click the Security tab, and then check the box labeled Allow this agent to act as a proxy and discover managed objects on other computers. This has to be done for every Exchange server, even if the server is added after your initial configuration of OpsMgr.
Download and run the Exchange 2003 MP Wizard (http://go.microsoft.com/fwlink/?LinkId=82103) on one of the Exchange servers. Run the wizard using the credentials of an Exchange Full Administrator and take the default configurations.
Enable the Exchange Topology View in the Operations console -> Authoring -> Management Pack Objects -> Object Discoveries. Find the Exchange 2003 Topology Discovery and override it for a specific object, choosing the Exchange server that you want to perform this role (set it to True).
Enable the mailbox and mailflow rules. To enable these rules, go to Authoring -> Rules and search on message tracking. Sort the results by the Enabled by Default field and then find the following two rules:
Performance Collection Rule to Collect Message Tracking Log Statistics – Top Destinations by Message Count
Performance Collection Rule to Collect Message Tracking Log Statistics – Top Destinations by Size
Eight reports are based on these two rules. Because the rules are not enabled by default, they are set to be not visible in the Exchange management pack, so they do not show up on the reporting server. Using an override will make them visible.
There is also an error in the collect message tracking statistic VBScript that generates an error in the OpsMgr event log.
Configure overrides to Enable these rules for all objects of Type: Exchange Database Storage.
Verify that Exchange shows up under Monitoring -> Distributed Applications as a distributed application that is in the Healthy, Warning, or Critical state. If it is in the Not Monitored state, check for Exchange servers that are not installed or are in a gray state. This may take some time to populate after all the preceding tasks have been completed.
A management group with an Exchange server may intermittently stop receiving alerts, and Event ID 2114 is logged in the Operations Manager event log on the RMS (Root Management Server). Alerts will again be received if you take one of the following actions:
Restart the Health service on agents in that management group.
Restart the RMS.
The problem occurs because OpsMgr 2007 does not correctly handle data submitted from the Exchange management point. You can work around this by disabling the Exchange Server Topology Discovery. Further information is available at http://support.microsoft.com/kb/941985.
The following alerts were encountered and resolved while tuning the Exchange 2003 management pack:
Alert: Multiple or any alert with Baseline in the title.
Issue: Default sensitivity levels within the Exchange management pack.
Resolution: See the “Configuring Baselines” section of this appendix.
Alert: The Internet Information Service NNTP virtual server named NNTPSVC/1 is unavailable as the virtual server has been stopped.
Issue: On Exchange servers, this service is required to install, but it is not required after it is installed.
Resolution: If this service is disabled/not in use, you can remove it. To remove the service, log in to the server and from the command line, enter
sc delete NNTPSvc. Otherwise, create an override to ignore this on the Microsoft Exchange 2003 Server Group. NNTP was required for the installation, but can be disabled after the installation is complete.Alert: Verify Test Mailboxes: This Exchange Server does not have any MOM test mailboxes.
Issue: Test mailboxes are created by the Exchange MP Configuration Wizard.
Resolution: Run the Configuration Wizard to create the mailboxes.
Alert: No MOM test mailbox account for some mailbox databases.
Issue: Test mailboxes are created by the Exchange Configuration Wizard.
Resolution: Run the Configuration Wizard and create test mailboxes on each database or disable the rule.
Alert: Replication is not occurring – All replication partners have failed to synchronize.
Issue: The Alert Description is the key on this alert.
Resolution: Alert Description of AD Replication Monitoring: All replication partners are now replicating successfully is a success condition; it does not require any intervention other than closing the alert.
Alert: Some replication partners have failed to synchronize.
Issue: A domain controller was offline and unable to be synchronized with.
Resolution: Bring the domain controller back online.
Alert: Outlook Web Access logon failure: Unexpected error during synthetic Outlook Web Access logon.
Issue: OWA logon failure: You can only configure OWA (Outlook Web Access) to be monitored if the site runs on HTTPS.
Resolution: Disable the rule (For all objects of type: Exchange OWA) because this particular environment is running with HTTP on the OWA configuration.
Alert: Exchange ActiveSync logon failure: Unexpected Error.
Issue: Exchange EAS is not required in this environment.
Resolution: We disabled the rule for all objects of type Exchange EAS because we were not using this functionality.
Alert: The 3GB virtual address space option is not enabled.
Issue: The 3GB configuration should be used for Exchange servers, except for those functioning as bridgeheads or frontend servers (per the Exchange Best Practices Analyzer [BPA]).
Resolution: Disabled this rule for frontend and bridgehead servers.
Alert: Failed to probe the state of monitored services.
Issue: This was occurring on the SMTP services on an Exchange server the administrators have manually restarted.
Resolution: The alert was notifying on a true business-impacted situation. We requested that the administrators put the server into maintenance mode prior to making changes like this, unless it is an emergency.
Alert: Data Publisher object is not installed.
Issue: This is a system misidentified as an Exchange server using a third-party product to provide Exchange restoration functionality.
Resolution: We disabled the rule for this system using an override.
Alert: Microsoft Windows Internet Information Server 2003 NNTP Virtual Server is Unavailable.
Issue: NNTP Service Down on non-active cluster node.
Resolution: The NNTP service is supposed to be down because it is running on a cluster and the system showing this error is not the active node in the cluster. We created a group for the servers running Exchange and part of the cluster, and disabled the rules for the group. NNTP was not used on Exchange, and optionally we could have removed it as a service from the systems.
Alert: Microsoft Windows Internet Information Server 2003 SMTP Virtual Server is Unavailable.
Issue: SMTP Service Down on non-active cluster node.
Resolution: The SMTP service is supposed to be down because it is running on a cluster and the system showing this error is not the active node in the cluster. We created a group for the servers running Exchange and part of the cluster, and disabled the rules for the group.
Alert: Microsoft Windows Internet Information Server 2003 Web Site is Unavailable.
Issue: Web Service Down on non-active cluster node.
Resolution: The Web service is supposed to be down because it is running on a cluster and the system showing this error is not the active node in the cluster. We created a group for the servers running Exchange and part of the cluster, and disabled the rules for the group.
Alert: Check Services FE Monitor reported a problem.
Issue: Microsoft product knowledge on this: Services State monitoring with this Registry key is a legacy from the MOM 2005 Exchange 2003 MP. This monitor is included since configuration is possible from within the Exchange MP Configuration Wizard. OpsMgr 2007 provides a dedicated health model for monitoring Windows Service Health.
Resolution: Right-click and choose Overrides -> Disable the Monitor for all objects of type: Exchange 2003 Role.
Alert: Exchange EAS monitor reported a problem.
Issue: Synthetic Exchange ActiveSync requires SSL.
Resolution: Closed the alert because it had not reoccurred/repeated for 2 days and the script checking for the condition runs on a 15-minute schedule. Issue repeated. EAS logon verification: Cannot measure EAS availability for the following URL: 0x80131537(-214233033) Invalid URI: The format of the URI could not be determined. We found the following information at MyItForum:
This script problem is caused by OMA and EAS virtual directories not being SSL-enabled. So in order to correct it, simply enable SSL:
Open Internet Information Services (IIS Manager).
Connect to the server name of your frontend Exchange server.
Drill down to Web Sites, then to the website.
Locate the two virtual directories named OMA and Microsoft-Server-ActiveSync.
Open the properties of the virtual directories. Choose the Directory Security tab.
Under Secure communications, click Edit.
Check the box labeled Require security channel (SSL).
Alert: No MOM test mailbox account for some mailbox databases.
Issue: No MOM mailboxes were created on a per-storage group when the Configuration Wizard was run. The alert is being created expecting that per-store monitoring will be configured, which is not the case in this particular environment.
Resolution: We disabled this rule for all objects (of type Exchange 2003 role) because this rule is monitoring on a per-store basis, but we are monitoring on a per-server basis. We then closed the alerts.
Alert: SSL is not configured on this Exchange server.
Issue: This occurs on servers that have SSL enabled if they do not require usage of SSL within IIS. Backend servers communicate with frontend servers via HTTP, not HTTPS, so SSL should not be required on the backend Exchange servers. We found the following information at Notes from the Underground:
SSL in a Front-End/Back-End Scenario
Although it’s possible to implement SSL on a front-end (FE) server, resulting in all transmitted data between the FE and your client browsers being encrypted, you should be aware that you can’t use SSL between any FE and back-end (BE) servers—it simply doesn’t work. This means that if your FE server is placed in a perimeter network (also known as a demilitarized zone, or DMZ), all traffic between the FE and BE would be unencrypted. So if you are planning such a scenario, consider using IPSec between the FEs and BEs. More and more organizations place their FEs directly on their private networks (and instead place an ISA server or similar in the DMZ), which eliminates this security risk.
Resolution: Disabled the alert on Exchange backend servers.
Alert: Calendaring agent failed with error while saving appointment.
Issue: Calendaring agent failed with error code 0x8004010f while saving appointment.
Resolution: Good links on this at http://www.eventid.net/display.asp?eventid=8206&eventno=1103&source=EXCDO&phase=1. Lots of product knowledge on this related to virus scanners, Registry settings, and so on. This is a result of an event ID of 8206 on the Exchange server.
Alert: Disabled user does not have a master account SID.
Issue: The user does not have the Associated external account permission, and the Exchange server does not have the hotfix available to resolve this issue.
Resolution: To resolve this, open the user account in Active Directory Users and Computers and then go to Properties -> Exchange Advanced -> Mailbox Rights. For the Self account, we added the Associated external account permission, which resolves the error. The error itself does reappear, but it appears with the next user identified that had the issue. If there are a large number of these, you can also locate them by going to each Exchange backend server and doing a Filter operation on event number 9548 within the application event log. An Exchange hotfix for this issue is available at http://support.microsoft.com/kb/916783. (This information is a subset of what was originally posted at http://cameronfuller.spaces.live.com/blog/cns!A231E4EB0417CB76!835.entry.)
Alert: Low Free Disk Space.
Issue: Part of the Exchange management pack checks free space on all drives, including those drives that do not have Exchange directories or files on them. This activates a warning at less than 5% free disk space and less than 1000MB of free disk space on Exchange server drives that do not have the transaction logs or queue files on them.
Resolution: Free up disk space on the drive. See the “Logical Disk Free Space is Low” bullet for potential approaches to free up disk space on the drive.
Alert: Very low free disk space.
Issue: Part of the Exchange management pack checks for free space on all drives, including those drives that do not have Exchange directories or files on them. This activates an error at less than 2% free disk space and less than 400MB of free disk space on Exchange server drives that do not have the transaction logs or queue files on them.
Resolution: Free up disk space on the drive. See the “Logical Disk Free Space is Low” bullet for potential approaches to free up disk space on the drive.
Alert: Logical Disk Free Space is Low.
Issue: Low disk space on a drive on a server monitored by OpsMgr.
Resolution: You can either free up disk space on the drive or configure an override for the drive to change the monitoring configurations for the drive (see http://cameronfuller.spaces.live.com/blog/cns!A231E4EB0417CB76!1001.entry for details on how to do this override). Here are some other items to consider:
If the page file is currently on the drive that is critical on drive space, move it to another drive.
The Windows Disk Cleanup Wizard can also be used to provide methods to free up disk space (right-click the drive, select Properties, and click the Disk Cleanup button).
If the drive is critically low on available free disk space, automatic updates can be turned off in the Control Panel and the %windir%softwaredistributiondownload folder can be removed. (Of course, automatic updates will not occur after this change is made.)
The default IIS configuration puts the IIS log files under %windir%system32LogFilesW3SVC1. The files can be moved within the Internet Information Services (IIS) Manager by clicking the properties of the websites, under the properties of the log files. The log files can either be moved or disabled if required.
Exchange log files can take up a large amount of disk space on a drive if the Exchange server is not backed up regularly. When the Exchange server has a full backup completed, the log files are removed. If an Exchange server is critical on space on the log drive, determine if backups are occurring. If they are not, perform an ntbackup of the Exchange files to truncate the logs. Circular logging (which removes this type of a situation) can also be enabled in some configurations, but is not recommended if there is any mailbox data on the system.
Alert: MAPI Logon Failure.
Issue: This occurred almost immediately after running the Exchange 2003 Management Pack Configuration Wizard.
Resolution: The issue was resolved when the wizard completed its configurations and had only repeated once. We ran the MAPI Logon task to validate that the issue had been resolved and confirmed there were no errors. Then we closed the alert.
Alert: MAPI session closed due to excessive number of store objects in use.
Issue: Exceeded the maximum of 250 objects of type objtMessage (1 repeat), or exceeded the maximum of 32 objects of type session (0 repeats), or exceeded the maximum of 500 objects of type objtFolder.
Resolution: Microsoft resolution is provided with the Product Knowledge for the alert. Eventid.net provides the following on this: http://www.eventid.net/display.asp?eventid=9646&eventno=3449&source=MSExchangeIS&phase=1. You can also view the Microsoft KB article on this issue at http://support.microsoft.com/kb/830836.
Alert: Outlook Web Access logon failure: Unexpected error during synthetic Outlook Web Access logon.
Issue: OWA Logon failed. Cannot measure OWA availability. Unexpected error. No Exchange virtual servers and virtual directory (SSL enabled) can be found on this server to form a valid URL. Try providing the URL in the CustomUrls Registry key.
If the name in the URL matches the name in the certificate, we learned that when SSL is enabled, the MP reports an error like this when the Require SSL check box is not checked on the Directory Security tab of the website. See Andy Dominey’s blog write-up on this at http://myitforum.com/cs2/blogs/adominey/archive/2007/04/10/mom-2005-and-om-2007-exchange-2003-management-pack-issue.aspx.
This rule requires OWA to be installed with SSL and requires SSL to be checked on the system. It will not work without both of these configured. This also requires the name to match the name on the certificate.
Resolution: Enable SSL and require SSL on the OWA server. If the name of the URL does not match the certificate, this rule will not work. You may also want to see the “Synthetic OWA Testing” section of this appendix for an alternative approach.
Alert: The MAD Monitoring thread was unable to read the CPU usage information.
Issue: This had repeated eight times in 5 days and 16 hours. The MAD Monitoring thread was unable to read the CPU usage information, error 0x800706be. From the knowledge summary, if this happens occasionally, it can be safely ignored. If it happens every 5 minutes, there is an issue.
Resolution: Closed the alert because it was not occurring frequently.
Alert: The Offline Address List (OAL) Generator could not generate full details for some entries in the OAL. To see which entries are affected, event logging for the OAL must be set to at least medium.
Issue: MSExchangeSA Event ID 9320.
Resolution: Refer to the event ID link on this: http://www.eventid.net/display.asp?eventid=9320&eventno=3692&source=MSExchangeSA&phase=1. The Microsoft article on this issue is located at http://support.microsoft.com/kb/908496.
Alert: The Offline Address List Generator could not generate full details because the total size of the details information is greater than 64 kilobytes.
Issue: See the Microsoft support article.
Resolution: The Microsoft article on this issue is available at http://support.microsoft.com/kb/908496.
If you have already tried everything that you can do to get rid of the OWA logon failure (other than disabling it) in Exchange 2003, this may be of assistance. We would like to give a huge thanks to Tony Greco who pointed out the issue and found this creative approach to resolving it!
Alert: OWA: Outlook Web Access logon failure: Authentication error.
Issue: The OpsMgr script in the Exchange 2003 management pack will not work if you are using a custom URL and HTTPS with certificates. If you’re not already familiar with this problem, Andy Dominey discusses it at http://myitforum.com/cs2/blogs/adominey/archive/2007/04/10/mom-2005-and-om-2007-exchange-2003-management-pack-issue.aspx). For example, if you have a server named JUGGERNAUT in the ODYSSEY domain and your webmail address is https://webmail.odyssey.com on SERVER1, the current MP cannot perform the check on this web location correctly because the server name (juggernaut.odyssey.com) does not match the certificate name of webmail.odyssey.com.
Resolution: Create a custom simple monitor with two views to monitor the OWA frontend functionality. Perform the following steps:
Open the Operations console. Navigate to Authoring -> Web Applications. Right-click and choose Add monitoring wizard.
Choose the Web Application monitoring type.
Enter a name (OWA Web Test, in our case) and description and then select a management pack for your changes (preferably not the default management pack; we created our own called OWA Web Test).
Enter the URL to test. For our sample company ODYSSEY.com, we will use https://juggernaut.odyssey.com to match the organization’s existing external name assigned to the SSL certificate.
Choose a watcher node (a management server or your RMS does well on this if it’s not too busy) and the frequency (the default is 2 minutes).
Create the web application.
Highlight the new web application and choose Edit web application settings under Actions.
Start a capture and go through the following process (we actually were not able to select and preview messages because it caused too many issues with the monitor):
Log in to the OWA server using appropriate credentials.
Create and send a new message to the email of the specified credentials.
Delete the message that was sent.
Log out of the OWA browse session.
Remove any failed responses that are not required. As an example, we removed the links section on ours. We removed this by going to the Properties -> Monitoring tab and then unchecking Enable health evaluation and performance collection for Internal links. We also needed to remove other conditions that failed regularly. You can do this by highlighting the URL that failed and deleting it under the Actions selection.
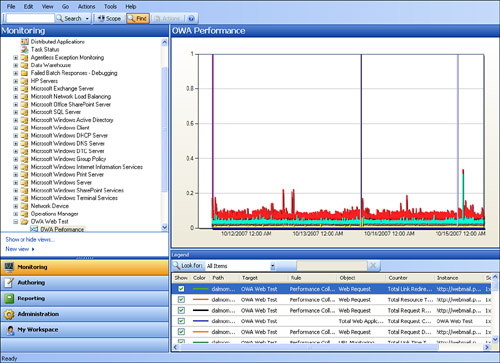
Now that the web application is monitoring the OWA site, we can see the state of the monitor either under the management pack we specified (Administration -> OWA Web Test, in our case) or under Administration -> Web Application -> Web Applications State.
We can also right-click the particular state view and choose to open the Alerts view or the Performance view. The Performance view is especially useful, and it is a good idea to go ahead and create a customized Performance view so that you can easily access these counters. Be sure to limit the performance counters shown to the name you created (such as our OWA Web Test example); otherwise, there are a lot of counters. Figure A.2 shows an example of the Performance view.
Because we are now effectively monitoring OWA functionality, we can disable the original OWA: Outlook Web Access logon failure: Authentication error alert.
As we were tuning the Exchange 2003 MP, we discovered the majority of alerts generated were a result of the calculated baseline rules. This section includes detailed steps to configure the sensitivity of these rules to decrease the alert volume. First, a huge thanks to a thread at EggheadCafe.com with an explanation of this issue, as that started us down the path on how to perform the tuning: http://www.eggheadcafe.com/software/aspnet/29844092/tuning-baselining-monitor.aspx.
The following were the primary alerts causing large amounts of volume:
Information Store Transport Temp Table is outside the calculated baseline.
Mailbox Store Send Queue is outside the calculated baseline.
SMTP Local queue is outside the calculated baseline.
SMTP Messages in the Queue Directory is outside the calculated baseline.
SMTP Remote Queue is outside the calculated baseline.
SMTP Remote Retry Queue is outside the calculated baseline.
IS Virtual Bytes is outside the calculated baseline.
Number of RPC requests is outside the calculated baseline.
Perform the following steps for all alerts causing significant volume that need to be tuned. It is best to implement these one at a time.
We recommend following the order listed in Table A.1, because it groups together the types of rules to make them easier to find. The steps that refer to the Exchange Queue will vary depending on the rule and monitor changed. The first six alerts in the preceding list are all part of the Exchange Queue; the last two are part of Exchange IS Service. Change each on both the monitor and rule level.
Table A.1. Mapping for Alerts, Rules, and Monitors
Alert | Rule | Monitor |
|---|---|---|
Information Store Transport Temp Table is outside the calculated baseline | Baseline Collection Rule for Information Store temp table number of entries (Rules, of type Exchange Queue) | IS Transport Temp Table Monitor (Exchange Queue, Entity Health, Performance) |
Mailbox Store Send Queue is outside the calculated baseline | Baseline Collection Rule for Mailbox Store Send Queue Length (Rules, of type Exchange Queue) | MB Store Send Queue Monitor (Exchange Queue, Entity Health, Performance) |
SMTP Local queue is outside the calculated baseline | Baseline Collection Rule for SMTP Server Local Queue (Rules, of type Exchange Queue) | SMTP Local Queue Monitor (Exchange Queue, Entity Health, Performance) |
SMTP Messages in the Queue Directory is outside the calculated baseline | Baseline Collection for SMTP Message Queue Directory (Rules, of type Exchange Queue) | SMTP Message Queue Directory Monitor (Exchange Queue, Entity Health, Performance) |
SMTP Remote Queue is outside the calculated baseline | Baseline Collection Rule for SMTP Server Remote Queue Length (Rules, of type Exchange Queue) | SMTP Remote Queue Monitor (Exchange Queue, Entity Health, Performance) |
SMTP Remote Retry Queue is outside the calculated baseline | Baseline Collection Rule for SMTP Server Remote Retry Queue Length (Rules, of type Exchange Queue) | SMTP Remote Retry Queue Monitor (Exchange Queue, Entity Health, Performance) |
IS Virtual Bytes is outside the calculated baseline | Baseline Collection Rule for IS Virtual Bytes (Rules, of type Exchange IS Service) | IS Virtual Bytes Monitor (Exchange IS Service, Entity Health, Performance) |
Number of RPC requests is outside the calculated baseline | Baseline Collection Rule for IS RPC Requests (Rules, of type Exchange IS Service) | MONITOR=IS RPC Requests Monitor (Exchange IS Service, Entity Health, Performance) |
We also strongly recommend you save your changes to an unsealed MP other than the Default management pack.
Find the rule that applies to the alert. To find the rules, it is easiest to change the scope to filter by the two areas we need—the Exchange Queue and Exchange IS Service. Both of these are available when you click Scope and choose the option to view all targets. Then find rules starting with Baseline Collection. This scopes the list down to about 17 rules versus over 6000.
Details on the names of each of these rules are listed in Table A.1. Disable the rule (right-click the rule and select Overrides -> Disable the Rule -> For all objects of type: Exchange Queue, and then click Yes to accept).
Change the rule sensitivity to 2.81. Right-click the rule, select Overrides -> Override the Rule -> For all Objects of type: Exchange Queue, and then check the Sensitivity parameter and set it to 2.81 if it is not already set to that value. Click OK.
Find the monitor that applies to the alert. This can be located by searching for or scoping to the type of object identified for the monitor. Disable the monitor by right-clicking the monitor, selecting Overrides -> Disable the Monitor -> For all objects of type: Exchange Queue, and then clicking Yes to accept.
Change the monitor inner sensitivity to 2.81. Right-click the monitor, select Overrides -> Override the Monitor -> For all Objects of type: Exchange Queue, and then check the Inner Sensitivity parameter and set it to 2.81 if it’s not already set to that value. Click OK.
Change the monitor outer sensitivity to 3.31. Right-click the monitor, select Overrides -> Override the Monitor -> For all Objects of type: Exchange Queue, and then check the Outer Sensitivity parameter and set it to 3.31 if it’s not already set to that value. Click OK.
Reenable the monitor. Right-click the monitor, click Overrides Summary, and delete the override that reads Type, Exchange Queue, Enabled, False.
Go back to the rule identified in step 1 and reenable it. Right-click the rule, click Overrides Summary, and delete the override that reads Type, Exchange Queue, Enabled, False.
Next, we will look at installing and configuring the SQL Server management pack.
Perform the following steps to install the SQL Server MP:
Download the SQL Server management pack (http://www.microsoft.com/downloads/details.aspx?FamilyID=8c0f970e-c653-4c15-9e51-6a6cadfca363&DisplayLang=en), and the SQL Server Management Pack Guide (http://download.microsoft.com/download/7/4/d/74deff5e-449f-4a6b-91dd-ffbc117869a2/OM2007_MP_SQLSrvr.doc).
Read the Management Pack Guide from cover to cover. This document spells out in detail some important pieces of information that you need to know.
Import the SQL Server management pack. The management pack for each monitored version of SQL Server (2000 and 2005) consists of two .mp files. These files provide logic for discovery and monitoring, meaning you can use a smaller management pack to discover the existence of SQL Server and deploy the monitoring MP to the agent after OpsMgr has discovered SQL Server there. There is also a SQL Server Library MP, which is a prerequisite for the other management packs.
Be sure to download the most recent version of the SQL Server management pack. Versions 6.0.4247.5 and above, for example, solve an issue discovered in the OpsMgr 2007 Service Pack 1 Release Candidate with the SQL 2005 discovery script GETSQL2005DBSpace.js failing.
We recommend you also import the appropriate version of the Windows Server management pack for your operating system (Windows 2000 or 2003). The Windows Server management packs monitor various aspects of the OS that can influence the performance of those computers running SQL Server! This includes disk capacity, disk performance, memory utilization, network adapter utilization, and processor performance.
Install the SQL Management Studio and Profiler if you will be running the associated tasks from the Operations console; otherwise, you will receive an error message telling you the system cannot find the file specified. Installing the Management Studio and Profiler is not required unless you want to run those tasks.
The SQL Server MP supports agentless monitoring with the exception of tasks that start and stop SQL Server services and SQL Server mail.
The management pack installs two Run As Profiles: the SQL Server Discovery account and the SQL Server Monitoring account. By default, the management pack uses the Default Action account.
The SQL Server MP does not automatically discover all object types. Go to the Authoring pane of the Operations console to enable discovering additional components. Components not discovered include the following:
SQL Server 2005 Publisher
SQL Server 2005 Subscriber
SQL Server 2005 Subscription
SQL Server 2005 Agent Job
SQL Server 2000 Agent Job
SQL Server 2005 DB File Group
SQL Server 2005 DB File
Tip: The Impact of Undiscovered Components
Because OpsMgr does not discover the components listed previously unless you tell it to, you will not receive alerts if there is a failure because OpsMgr is not monitoring them! If, for example, you have scheduled SQL database backups using the SQL Agent and the job fails, OpsMgr won’t tell you about it. If an agent job failed in MOM 2005, the SQL MP generated an alert. In MOM 2005, the alert was enabled, but in OpsMgr 2007, the component isn’t even monitored (by default). So these behaviors are not necessarily the same between MOM 2005 and OpsMgr 2007.
You can use overrides to change the settings for automatic discovery to enable these object types. Be sure to change your settings in an unsealed MP other than the Default management pack.
The following alerts were encountered and resolved while tuning the SQL Server management pack:
Alert: The SQL Server Service Broker or Database Mirroring transport is disabled or not configured. (Event ID 9666)
Issue: This alert may occur even if the broker is enabled.
Resolution: Verify the broker is enabled by running the following query in SQL Management Studio while connected to the Master database:
<LINELENGTH>90</LINELENGTH>SELECT is_broker_enabled FROM sys.databases WHERE name = 'OperationsManager'
If the result is 1, the broker is enabled. If the result is 0, you can enable the broker as follows:
Stop the SDK, Config, and Health services on the RMS as well as the Health service on any secondary management servers.
Execute the following statement from SQL Management Studio:
<LINELENGTH>90</LINELENGTH>ALTER DATABASE OperationsManager SET ENABLE_BROKER
Restart the services.
If the alert continues to occur, disable the rule using an override.
For SP 1, Microsoft added some instrumentation around the SQL Service Broker not enabled message by adding checks to determine if the service was running or not. In test environments, often there are issues where the database is too busy and SQL Server is unable to process the query to determine if the Broker is actually running.
Issue: Clustered virtual servers are discovered and display as agentless managed, but the SQL Server database engine on the cluster does not appear to be monitored.
Resolution: Only the virtual SQL Servers are discovered (the cluster and not the individual cluster nodes). In the Monitoring tab under Windows Server, check that each virtual server shows up as a Windows Server with the property Is Virtual Server set to True. Restart the Health service on the RMS and any other management servers after adding the cluster. You may need to restart the Health service on the cluster as well, which will re-run the discovery.
It is also possible that you are having RPC issues. For additional information, see KB article 306985 (http://support.microsoft.com/kb/306985).
Alert: 8957 Monitor Name: DBCC executed found and repaired errors – but found 0 errors and repaired 0.
Issue: When DBCC runs, it generates this event log message with the same event ID regardless of whether any problems were found.
Resolution: Disable the rule and create your own. For the new rule, copy all the same settings from the original but set the description to not contain “found 0 errors.” For all other events with this ID, an alert will be generated to indicate a problem was found.
Alert: Health Monitor Description: Service Pack Compliance – MSSQLSERVER (SQL 2005 DB Engine) Warning (against ACS database).
Issue: SQL Server 2005 Service Pack 2 is installed, which is acceptable for the ACS database server. SP 2 has been approved for all OpsMgr database components.
Resolution: We created an override (for a specific object of type SQL Engine DB) to allow this configuration for the server, and we set the enabled parameter to False for the server. We also reset the health for the health monitor on this server and refreshed the Health Explorer, and the state updated to green from yellow.
Issue: The Management Server Action account is used as the Default Data Warehouse Action account, rather than the DW Action account you specified during setup.
Resolution: This will be fixed in SP 1. In the interim, create a Run As account, type Simple, and set the username and password to a single space. In the same-name profile, associate this account to all management servers, including the RMS. Also, be sure that the Data Warehouse Action account profile is correctly associated with an account for all management servers where it will be used as the Windows authentication account. This information was obtained from the newsgroups (nntp://msnews.microsoft.com/microsoft.public.opsmgr.setup/[email protected]).
Issue: SQL Server 2000 database engine health is not monitored. This is an aggregate monitor that includes the SQL Service State terminated unexpected monitor and the SQL Service terminated unexpectedly monitor. (If you have SQL Server 2000 databases, you will want to turn on monitoring!)
Resolution: The SQL DB Engine Service Health Rollup monitor is not enabled by default. Use the Authoring pane of the Operations console to enable the Aggregate Rollup monitor.
Under Management Pack objects, select Monitors, change the scope to SQL 2000 DB Engine, search, then expand the SQL 2000 DB Engine, expand Entity Health, expand Availability, select SQL DB Engine Serve Health Rollup, and create an override to override the monitor for all objects of type SQL 2000 DB Engine. KB article 938991 (http://support.microsoft.com/kb/938991) has additional information.
The following issues are related to specific applications you may have installed:
Issue: Alert Rule or Alert Monitor: Auto Shrink Flag Alert Description: The auto shrink flag for database SUSDB in SQL instance MSSQL SERVER on computer 123.abc.com is not set according to best practice.
Resolution: This is a standard Microsoft application (WSUS) and a default configuration. Create an override to exclude this database.
Issue: Alert Rule or Alert Monitor: Auto Shrink Flag Alert Description: The auto shrink flag for database BEDB in SQL instance MSSQL SERVER on computer endeavor.odyssey.com is not set according to best practice.
Resolution: This is the standard configuration for Backup Exec’s database.
Issue: Alert Rule or Alert Monitor: Auto Shrink Flag Alert Description: The auto shrink flag for database MSCUPTDB in SQL instance MSSQL SERVER on computer endeavor.odyssey.com is not set according to best practice.
Resolution: This is a standard Microsoft application (patch management for SMS and Configuration Manager) and a default configuration. Create an override to exclude this database.
Issue: Alert Rule or Alert Monitor: Auto Close Flag Alert Description: The auto close flag for database MSCUPTDB in SQL instance MSSQL SERVER on computer endeavor.odyssey.com is not set according to best practice.
Resolution: This is a standard Microsoft application (patch management for SMS and Configuration Manager) and a default configuration. Create an override to exclude this database.
The IIS management pack enables OpsMgr 2007 to monitor the following IIS object types:
IIS Server Role
IIS Web, FTP, NNTP, and SMTP servers
IIS Web and FTP sites
IIS NNTP and SMTP virtual servers
Perform the following steps to install the IIS MP:
Download the IIS management pack (http://www.microsoft.com/downloads/details.aspx?FamilyId=D351BCA8-182B-4223-8C9E-627E184BA02B&displaylang=en) and the IIS Management Pack Guide (http://download.microsoft.com/download/7/4/d/74deff5e-449f-4a6b-91dd-ffbc117869a2/OM2007_MP_IIS.doc).
Read the Management Pack Guide from cover to cover. This document spells out in detail some important pieces of information you need to know.
Import the IIS management pack. The components include the Windows Server Internet Information Services Library and individual management packs for IIS 5 (Internet Information Services 2000 with Windows 2000) and IIS 6 (Internet Information Services 2003 with Windows Server 2003). Import the library, which is a prerequisite, plus the appropriate management pack for the version of IIS you will be monitoring.
We recommend you also import the appropriate version of the Windows Server management pack for your operating system (Windows 2000 or 2003). Some of the views provided with the IIS MP require the MPs for the appropriate level of operating systems to have data to display.
Even if you do not have any custom web applications using IIS, remember that Exchange, SQL Server Reporting Services, and Operations Manager itself have components that use IIS; you will want to implement the IIS MP as part of rolling out and monitoring those applications.
The IIS management pack does not support agentless monitoring. Verify you have installed the OpsMgr agent on your IIS servers.
The IIS MP collects data from the IIS logs. If logging is not enabled, the MP will only collect and analyze service data. The IIS logs must be set to the W3C Extended Log File format. Enable logging for each type of site and virtual server for which you want to collect monitoring data. This can include FTP sites, websites, SMTP virtual servers, and NNTP virtual servers.
Enable logging for a virtual server in the IIS Services Manager by double-clicking the local computer, right-clicking the SMTP or NNTP Virtual Server folder you want to enable logging for, and selecting Properties. Then, on the General tab, select Enable logging. Be sure to select W3C Extended Log File format on the Active log format dropdown list.
The IIS MP for OpsMgr 2007 has the ability to tell you whether a specific website is healthy, in addition to being able to tell you whether the web server is healthy.
The health of the IIS server is dependent on the health of the objects at the next lower level—the IIS Web, FTP, NNTP, and SMTP servers. If any of these servers is in a critical health state, the IIS server will display in a critical health state. By default, the health of the IIS FTP, NNTP, SMTP, and Web servers are not dependent on the health of the objects at the next lower level. If one or more websites is in a critical state, the Web Server object will not change state.
We encountered and resolved the following alerts while tuning the IIS management pack:
Alert: An unknown token name (s-event) was encountered.
Issue: IIS logging is configured by default on Windows Server 2000 to include Process Accounting extensions for websites.
Resolution: Disable logging Process Accounting Extensions. (In IIS Service Manager, select Default Web Site -> Properties and then select Enable logging on the Web Site tab. From the Active log format dropdown list, select W3C Extended Log File Format. Select Properties -> Extended Properties, and clear Process Accounting from the Extended Logging Options list box.)
Issue: IISReset causes a ton of alerts.
Resolution: Put the IIS object in maintenance mode before doing the IISReset. You could use PowerShell (use the command
New-MaintenanceWindowto put the server into maintenance mode and then start the IISReset cmd operation) to automate this.Issue: IIS MP does not work well with clusters. This can be a real issue if you are monitoring Exchange.
Resolution: None currently available. We anticipate this will be addressed in Service Pack 1 or the next release of the IIS MP.
If you are using the Exchange management pack, you will encounter a number of IIS-related issues. See the “Exchange Management Pack Tuning and Alerts to Look For” section of this appendix for a detailed list.
Operations Manager 2007 includes built-in website monitoring functionality (similar to that provided by MOM 2005’s Web Sites and Web Services MP), using the Web Application Management Pack Template. This functionality is quite useful for monitoring websites. The template records where you go with your browser. To use this functionality, you need to configure your browser. In Internet Explorer, select Tools -> Internet Options -> Advanced -> Enable third-party browser extensions (requires restart) in both IE 6 and IE 7. Web applications are created in the Operations console under Authoring -> Management Pack Templates -> Web Application.
We decided to start simple, and then move into more complex monitoring configurations.
We began with developing a web application that monitors a single web page (such as www.google.com or www.microsoft.com) without requiring authentication. There is a great write-up available at http://www.technotesblog.com/?p=432 that provides a detailed process to create monitoring for a single web page. For our example, we use www.google.com, and as in the TechNotes blog example (which uses the Microsoft website), we disabled link tracking.
After our application was in a working state, we went to the next step that we wanted to test—monitoring the OpsMgr Operations Web console. Because the Operations Web console requires authentication, the monitoring setup is more difficult.
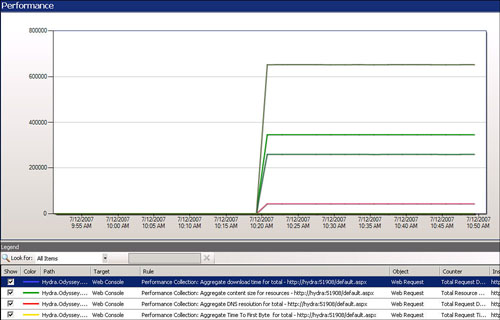
We created a new web application called Operations Web console (and stored it in a new, nondefault management pack), and we had the application browse to http://<servername>:51908/default.aspx for the Operations Web console. We created the web application using the default configurations and ran it on Windows 2003, Windows XP, and Windows Vista workstation systems (one of each for testing purposes). Each of these systems went to a critical status due to an “access is denied” error message.
You can check the status of the monitored websites by navigating in the Operations console to Monitoring -> Web Application -> Web Applications State. You can also right-click and open the Performance view for any system you are monitoring to receive a large number of collected performance information (check out Figure A.3 for an example).
Resolving the security issue required creating a Run As Account of type Windows (under Administration -> Security -> Run As Accounts), using an account with permissions to access the Operations Web console. We then configured this account to be used by the web application in the Authoring section under Authoring -> Management Pack Templates -> Web Application:
Edit the web application settings for the Operations Web console just created.
Select the General tab to configure its settings, select the authentication method of NLTM, and specify the account created to monitor the website.
After going back to monitoring section (Operations Console -> Monitoring -> Web Application -> Web Application State) and waiting a little bit, the Operations Web console monitor went to green.
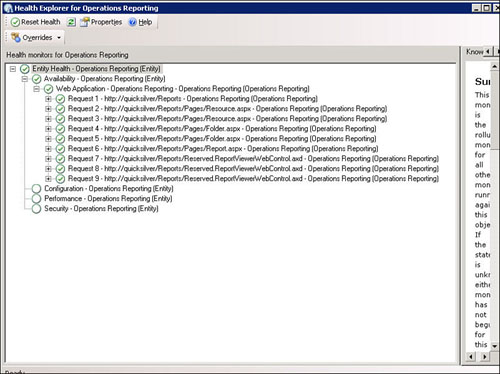
To get even more complex, we created a web test that used the recorder. The Reporting Server Component was a good test for this. The URL for this server is located under Administration -> Settings -> Reporting. In our environment, this has a value of http://QUICKSILVER:80/ReportServer. To record, we started with http://QUICKSILVER/Reports and worked from that point. We opened up a graphic, a folder, and a report during the capture process. Running a report would also be an option, but because this would run on a regular basis (every few minutes), we did not want to create that level of overhead with our monitoring. We configured the authentication method (NTLM and the account we previously created) and the watcher node. We checked its status in the Health Explorer (see Figure A.4); everything was green.
The systems performing the watcher function did not have any customizations made to their web browsers, such as adding the browser location to the trusted sites. Some servers would work well as watchers and other would not (in our case, the RMS). We were unable to identify a specific reason for this.
Do not test authentication items within the Web Application creator. It brings up a pop-up warning that running a test of this web application may fail. While the test is run, credentials that have been configured for this web application will not be used. If the site you are testing does not explicitly require authentication, the test may still succeed.
The best way to test authentication items is by actually checking their alerts and status in the Monitoring space.
If the site requires authentication to get to it, you need to configure authentication for the web tests. Check IIS to see what type it allows and provide a match (NTLM = Integrated Authentication in this particular case).
The Dell Management Pack Guide is part of the Dell management pack download, available at http://support.dell.com/FileLib/Format.aspx?c=us&l=en&ReleaseID=R158716. The OpsMgr Dell management pack actually only takes the information provided by the Dell OpenManage agent and integrates that with OpsMgr. As a result, the alerts raised are directly related to hardware issues shown in the logs available through the OpenManage interface.
Before you install the Dell MP, you must install the updated Microsoft Operations Manager 2005 Backward Compatibility management pack. You can download the Backward Compatibility MP at http://go.microsoft.com/fwlink/?LinkId=98874. Without the updated Backward Compatibility MP, you may experience CPU spikes!
Make sure all the systems in your environment that have the Dell OpenManage software installed are at least version 5.2. A variety of errors will occur if you try to monitor using the OpsMgr management pack and an older version of Dell OpenManage (including a lot of Script or Executable Failed to run alerts). You can check the version either by running the Dell Server Administrator and checking the version it lists or by checking the Registry key available under HKLMSOFTWAREDell Computer CorporationOpenManageApplicationsSystemsManagement, in the Version field.
The following alerts were encountered and resolved while tuning the Dell management pack:
Alert: Dell.Connections.ServerAdministrator.Alert.1306.Critical.
Issue: Redundancy lost Redundancy unit: System Power Unit Chassis location: Main System Chassis Previous redundancy state was Normal Number of devices required for full redundancy: 2.
We checked with the Launch Server Administrator task and did not find any current issues on the server. The actual issue was in the alert log, not the hardware log.
Resolution: Found the issue through the alert log on Dell OpenManage. This appears to be an issue with a sensor or a power supply on the system. Entered company knowledge on the time and server on which the alert occurred to determine if this is a component that may be failing.
Alert: Dell.Connections.ServerAdministrator.Alert.1104.
Issue: Fan sensor detected a failure Sensor location: ESM MB Fan7 RPM Chassis location: Main System Chassis Previous state was: OK (Normal) Fan sensor value (in RPM): 0.
We checked with the Launch Server Administrator task and did not find any current issues on the server. The actual issue was in the alert log, not the hardware log.
Resolution: We found the issue through the alert log on Dell OpenManage. This appears to be an issue with a sensor or a power supply on the system.
Issue: DellStorageDiscovery.vbs failing on an Exchange 2003 server, process exited with 0. Searched the XML files to validate that this is part of the Dell management pack. Checked the Dell Server Administrator on the system, and it was running version 1.9 (5.2 is required).
Resolution: Upgrade the version of the Dell Server Administrator software or disable the alert on this system.
Alert: Script or Executable Failed to run.
Issue: DellServerFansUnitUnitMonitor.vbs failing on a Windows 2003 server. We checked the Dell Server Administrator on the system, and it was running version 1.8 (5.2 is required).
Resolution: Upgrade the version of the Dell Server Administrator software or disable the alert on this system.
Alert: Dell.Connections.ServerAdministrator.Alert.1554.
Issue: Log size is full Log type: ESM.
Resolution: We validated that the log was full (used the Launch Server Administrator task) and then we used the Clear ESM Logs task to clear out the logs because the items were not current but were historical. Finally, we closed the alert.
Alert: Dell.Connections.ServerAdministrator.Alert.1553.
Issue: Log size is near or at capacity Log type: ESM.
Resolution: We used the Clear ESM Logs task after reviewing them with the Launch Server Administrator task. We closed the alert.