1
Embodied, operational and whole life carbon
Overview
Carbon emissions from the creation of the built environment derive principally from energy used in the construction process. This largely means energy generated from fossil fuels, ie coal, oil and gas. Energy supplied from renewable sources, nuclear power and hydroelectric power does not generally produce direct operational carbon emissions. (It is, however, worth noting that the process of building, for example, wind turbines consumes a significant amount of energy, so the provision of wind power is not totally free of carbon emissions.)

Figure 1.01: Global energy consumption by country in 2014: six examples.
Currently in the UK, and for the medium term at least, reducing carbon emissions is substantially about reducing energy use. Buildings use energy to operate, known as ‘operational energy’, which produces ‘operational carbon emissions’.
Sourcing materials, constructing, repairing and maintaining buildings are also responsible for significant energy use – this is referred to as ‘embodied energy’, giving rise to the term ‘embodied carbon emissions’. The country from which your materials are sourced – ie under which sort of energy regimes they are extracted and fabricated – will have an impact on the carbon footprint of that material. Electricity used by industry in the UK is generally from a mix of sources; sourcing outside the UK can open up opportunities for procuring low carbon materials – but a word of caution: transport methods to a UK site can counteract these benefits.
‘Whole life carbon emissions’ are both the operational and the embodied emissions considered together over the life of the building. A key point is that considering operational or embodied emissions in isolation can lead to poor decision-making with unintended consequences.
The terms ‘carbon’ or ‘carbon emissions’ as used in this book actually refer to ‘carbon dioxide emissions and their equivalents’, or CO2e, where the ‘e’ refers to a bundle of greenhouse gases (GHGs) that have similar negative impacts to CO2 but at a significantly worse level per kg of the gas.

Legislative background – the short story
The European Committee for Standardization, known as CEN, has technical committees (TCs) that produce standards on a whole range of activities and processes for use across the EU. The one that concerns us for carbon emissions reduction is CEN/TC 350, the standard for sustainability of construction works, produced in 2005.
In addition to CEN/TC 350 is the UK Low Carbon Transition Plan: National strategy for climate and energy, presented to Parliament by the government on 15 July 2009. For our purposes, the key extract from the ‘five point plan’ is item four:
This document focuses principally on reducing operational energy use in buildings, but not embodied energy; nor did it consider the possible implications of pursuing an operational energy-only approach.
However, in the autumn of 2010, The UK Department of Business Innovation and Skills’ innovation and growth team (IGT), under the direction of the government’s chief construction advisor, Paul Morrell (formally senior partner of Davis Langdon), produced its final report on low carbon construction. This excellent document posed the question ‘Is the construction industry fit for purpose for the transition to a low carbon economy?’ The answer was, of course, no. The report challenged industry to get to grips with the issue; the following recommendations get to the nub:
In November 2011 the British Standard BS EN 15978:2011 was produced, essentially replicating CEN/TC 350 and bringing it into the British Standards framework. Unless repealed post-Brexit, this remains the point of reference. This standard sets out a whole life methodology, covering both operational carbon emissions and embodied emissions and including reuse, as per the circular economy. (See Chapter 6 for detail on BS EN 15978.) This represents the basis on which embodied and whole life carbon emissions are understood and assessed today. However, early use of BS EN 15978 led to incomparable assessments as different consultants, responding to clients with differing reporting requirements, interpreted the BS inconsistently.
In 2015, InnovateUK provided funding for a team (see Introduction for details) led by the author to produce an implementation plan for making BS EN 15978 consistent and understandable in use, and usable and accessible through RICS certification. The objective was to create a consistent plan for UK- and potentially EU-wide use that brings embodied and whole life carbon into the mainstream.
Carbon emissions in the built environment can be an odd concept to grasp, particularly with respect to materials. In the next sections, I explain what I understand by operational, embodied and whole life carbon emissions.
Operational carbon emissions
These are the emissions from energy used to operate a building. In the UK these are split into ‘regulated’ – namely those covered by legislation (Part L of the Building Regulations), such as heating, lighting and cooling – and ‘unregulated’, which covers small power use such as TVs, kettles, computers, fridges and so on. Reducing regulated emissions has a direct impact on the design of the building fabric through measures to reduce the need for energy consumption, such as increased insulation, double glazing, low energy lighting, etc. The Building Regulations (Part L) have evolved specifically to reduce the amount of energy used to heat, cool and light buildings, and have been very successful in improving the environmental performance of buildings.
The Passivhaus standard is an example of the optimum in environmental performance, in which regulated operational energy use is reduced to a practical minimum. This German-originated building standard provides for performance levels much higher than the UK Building Regulations, and is achieved through very high levels of insulation, airtightness, triple glazing, elimination of cold bridging and other measures.
The success of the UK Building Regulations has been in reducing building performance-related operational carbon emissions over the decades since their introduction. The point has been reached where further reductions, by way of further mitigation or the use of renewables, are becoming increasingly expensive – or, at least, are certainly perceived as being so (this is particularly true of many house builders, who see any increase in environmental standards as a direct cost). This view, although not necessarily accurate, particularly over the long term, has created a negative ‘mood music’ around sustainability and has led to the government backtracking on environmental legislation. For example, in October 2011 the then chancellor George Osborne, who prior to the 2010 election had promised that his Treasury would be ‘a green ally, not a foe’, told his party conference that saving the planet risked ‘putting our country out of business’.4
Relative impacts of operational and embodied emissions

Figure 1.02: Relative impact of individual life cycle stages on the overall carbon footprint for different types of buildings, calculated over 30 years. Red arrows by author indicating embodied carbon proportion. (The energy results have been based on the Building Regulations.)
Analysis by the Royal Institute of Chartered Surveyors5 and others shows that the proportion of embodied energy in relation to that of regulated operational energy is, in most new building typologies, greater than 50%, as shown in the above diagram where the green colour represents operational emissions. SCP has done similar analyses (see below) that support this view.
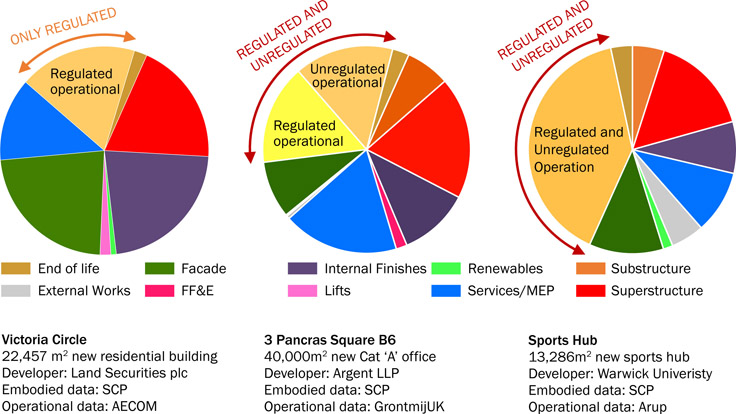
Figure 1.03: WLC analyses – range differences between operational and embodied emissions.
Such data conflicts with a general perception that embodied carbon is a relatively small part of the overall lifetime emissions of most building types (see What Colour is Your Building? by David H. Clark, 2013, see Figure 3.07, page 51 – this section suggests that the embodied/operational ratio is 20%/80%).6 This discrepancy can be partly attributed to the fact that, although buildings are becoming operationally more efficient all the time, the data reviews that have influenced thinking on the relative proportions tend to use data that predates the last few years, ie from before BREEAM 2011 and 2014 and Part L 2010 and 2013 effects were included. As buildings get more operationally efficient, so the embodied proportion increases.
The principal reasons however are that the following reporting deficiencies with reference to the BS EN 15978 modules have contributed to these discrepancies (see also Chapter 6):
- 1. Under-reporting for modules A, B, and C: This is generally down to reduced scope, since many assessments are only concerned with structure and cladding, ie they do not cover all elements of construction nor the interior fitout.
- 2. Under-reporting for modules B2-B5: Most assessments omit a proper analysis of maintenance, repair, replacement and refurbishment on the grounds of perceived complexity, or lack of knowledge. In practice, the life cycle emissions of these activities over 60 years can be significant: in the case of new office buildings, the embodied emissions over 60 years can be similar to those of the original construction. For example, for the Cat A office project T2, for Argent LLP, the approximate whole life carbon split at completion of RIBA Stage 3 was as follows.
- Embodied carbon to practical completion: 36%
- Embodied carbon over 60 years, plus disposal: 30%
- Operational carbon (regulated and unregulated) over 60 years: 34%
In the case of an owner-occupier, you would also have to include their internal upgrades over the 60-year period. This would significantly increase the embodied carbon proportions shown above.
- 3. Under or non-reporting of module C: Most assessments exclude a meaningful assessment of the end of life, ie the demolition and disposal carbon emissions. Although this can be difficult to analyse, it is an important consideration for resource-efficient design.
In aggregate, such under-reporting has meant that embodied carbon impacts have been misunderstood by the built environment industry. This is starting to change thanks to better understanding and better data, but it remains a significant point since it suggests that, while pressure to reduce operational emissions should continue, there are embodied (ie material-related) ways of making substantial carbon emissions reductions in the built environment at low or even zero cost. The implication is that, on the grounds of both cost and impact, the focus for carbon reductions in the built environment should spread to include embodied emissions in the form of a whole life approach. For architects and structural engineers, this means a shift in emphasis to materials and their efficient deployment rather than energy use efficiency, which is more in the remit of the services consultant.
Embodied carbon emissions (see Chapter 6 for methodology)
Sometimes also called embedded or capital carbon emissions, these are the emissions associated with the sourcing of raw material, transportation to a factory, fabrication into components and systems, delivery to site, and assembly into a building up to practical completion. Following completion, embodied emissions also refer to maintenance and replacement over an assumed building life expectancy, and final disassembly and disposal. Disposal can include reuse and recycling, meaning that redundant material is no longer waste but raw material for the next phase of use.
This holistic approach to reuse is referred to as the circular economy (see Chapter 3). Where conventional disposal such as landfill or incineration implies a high carbon cost, reuse and innovation can offer a lower carbon intensive outcome. Reduction measures can be introduced at all stages of the above sequence. The idea of the circular economy emphasises optimising the reuse of redundant products and materials, minimising the use of new material, and designing for future ease of reuse. All these aspects can be measured by their resulting carbon impacts. It is therefore possible through carbon accounting to compare the relative environmental performance of new v reuse. This concept is discussed in more detail in Chapter 3: case study 3.
The following sections refer to carbon reductions. What I mean by this is making material and life cycle choices to improve the carbon footprint of a component or system in relation to the baseline. In practice, when undertaking an assessment, we usually compare a building designed using industry standard measures to the same building using specifically selected measures. These might include use of recycled content, improved lifespan expectations, shorter transport distances, low carbon materials, more efficient construction, reduced waste, capacity for recycling, etc. This approach has limitations, so moving to a purely carbon emission cost per m2 approach is recommended as it is simpler and allows for direct comparisons between buildings (as is already possible with build costs, rent, etc).
When examining a proposed building’s potential for carbon reductions, there are many possible areas for consideration besides material selection. Transport distances can be reduced (local sourcing), waste can be reduced, and more efficient site management and construction planning can all make a difference. When considering the life of the building, designers need to consider ease of maintenance, omitting weak links from integrated systems to improve their lifespan, suitability (often durability) for purpose, ease of disassembly, avoidance of composite products, capacity for components and systems to be beneficially recycled, and the ultimate disposal of the building. The degree of flexibility within a building’s overall design will also have embodied carbon impacts over time.
Embodied emissions are therefore a holistic assessment of the carbon emissions resulting from manipulating material from its original source via its use by society to its ultimate disposal. It follows that a key area of concern is the actual energy sources used in these processes. In the UK we rely predominantly on coal and gas, with nuclear increasing in proportion. France and Norway, for example, rely respectively on a greater proportion of nuclear and hydroelectric power than we do, resulting in lower carbon emissions from the use of the energy grid. Invariably, choosing a low carbon material solution involves analysing the various carbon costs such as source of fabrication energy v distance travelled, and so on.
Appropriate use of materials is an important feature of low carbon design. For example, which has the lower embodied carbon footprint – a brick wall or a timber fence? The answer lies in how long you want it, where it comes from, and how you dispose of the redundant material. If 100 years is your goal, then you may need many timber fences, as opposed to one wall. Alternatively if you want a temporary structure, the brick option would be a waste of resources.
It is worth making a comment on timber sequestration at this point. Timber is generally seen as a ‘green’ material. As the above example shows, this is not necessarily the case. One way to think of this is whether your use of timber is better or worse than the natural cycle. Trees capture carbon dioxide over a natural lifespan before they die and rot away. If you accelerate this process, then you are speeding up the CO2e release process. If you are slowing it down, by ‘locking’ timber into the building and ultimately disposing of it in a way that is better than allowing it to rot, then you are improving on the natural cycle. Also important with timber is waste minimisation and disposal, and using glues that don’t have poor greenhouse gas consequences.
Whole life carbon (see Chapter 6 for methodology)
The simple definition of whole life carbon is the total sum of the operational and embodied emissions expended over a building’s whole life. However, implicit in the concept of ‘whole life’ is that by considering operational and embodied emissions together you optimise the relationship and ensure the lowest overall emissions reduction.
Today the idea of carbon emissions reduction is generally understood as reducing operational, ie day-to-day, energy usage. As previously noted, this is not surprising for historical reasons, and the Building Regulations, BREEAM and Town Planning requirements all encourage taking action to reduce such usage either through enhancing the performance of the building fabric, or by introducing renewable energy sources. In isolation such actions do of course reduce operational energy use. However, crucially, the embodied carbon cost of such actions is not taken into account. This is like counting the rent received from a property without factoring in the cost of building it; for example, making, delivering and installing insulation has a carbon cost.

Figure 1.04:
Carbon emissions reduction and resource efficiency – insulation example. Past an optimum point additional insulation is more damaging than beneficial.
Figure 1.04 above shows that increasing the thickness of insulation increases the operational benefit (blue line), but at a diminishing rate, and with a linear carbon cost (red line). The net effect cost/benefit line (in green) shows that past a certain point additional insulation is actually more destructive than beneficial in carbon emissions terms. This ‘capcarb’ versus ‘opcarb’ combination is crucial in understanding the true carbon cost of assembling and using buildings. It also means that materials energy usage, and not only operational usage, should be considered over time. For a proper assessment of a building’s carbon performance, it is necessary to first understand the interrelationship between material and operational carbon emissions and, second, the performance of both over time. BS EN 15978 covers this in overall terms and describes the various stages from sourcing of materials through usage, maintenance, refurbishment and final disposal.
This whole life approach to carbon emissions has profound implications for the way we design buildings. Focusing solely on operational energy expenditure has historically been both sensible and necessary and has meant that new buildings are operationally efficient to the extent that regulated operational emissions often account for less than half the total lifetime (frequently 60 years) emissions of a building (see page 14). This is thanks, in varying degrees, to Part L, BREEAM, the now defunct Code for Sustainable Homes, EPCs and DECs.
Therefore, as most of the easy wins, including renewables, are increasingly incorporated into current building design, further cost-effective emissions reductions can only be achieved through more efficient and targeted use of material resources. These embodied emissions savings entail us thinking much more carefully about the sourcing and delivery of materials used, the opportunities for using recycled materials, the methods of fabrication, the quantity of waste produced in assembling components and buildings and, most importantly, what happens over the life of a building. Designers have to think about what happens to their buildings after they have been completed, what the desired life expectancy is, how the building is maintained, and how it will be dismantled and disposed of. The carbon cost of a building over its life is linked directly to these issues. The ‘recyclability’ of a building is key to considering its overall footprint.
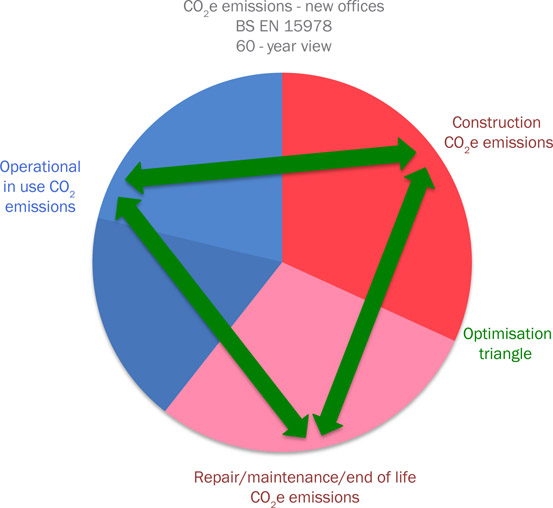
Figure 1.05: Whole life costs – typical carbon emissions of new offices over 60 years (according to BS EN 15978). This diagram is an average of several new-build office projects in central London.
Figure 1.05 above shows the ‘optimisation triangle’, ie the three areas of emissions that make up a building’s whole life performance. The proportions shown are averaged and relate to several typical, new, high-specification ‘shell and core’ speculative office buildings. The key to a genuinely low carbon building is to understand and optimise the relationships between these three areas; what makes this difficult is the reliability of the information available for each area. The proportions shown are based on design stage assessments. However, it is clear from post-occupancy evaluation that the regulated operational design stage assessments can be incorrect by a factor of 1.5 to 2.5 or even more when compared to actual usage (see www.CarbonBuzz.org).7 It is disturbing that building design, and certain planning requirements (eg offsets against Part L), are therefore frequently based on incorrectly projected operational energy usage. That being said, the system works to the extent that the operational performance of buildings is being continually improved, even if actual use patterns are not known.
It should, in theory, be possible to be as precise about the embodied emissions cost of construction as we are about cost estimates at the design stage assessments. By practical completion, it is certainly possible to know with a high degree of accuracy the embodied emissions cost (ie what went into making the building and where it all came from). It is more difficult to accurately assess the embodied life cycle carbon emissions costs as there are a great many variables, we don’t know what the future life of the building will be, and there is not enough accumulated data. However, it is likely that embodied life cycle assessments for a continuously occupied building could have a similar margin of error to operational emissions assessments. Ultimately, as with operational emissions analysis, the very fact of assessing the future embodied carbon life cycle makes us think about what happens to materials and systems post practical completion – even if this involves making assumptions about the future. This provides useful design stage information to guide us towards designing better buildings with lower whole life carbon footprints.
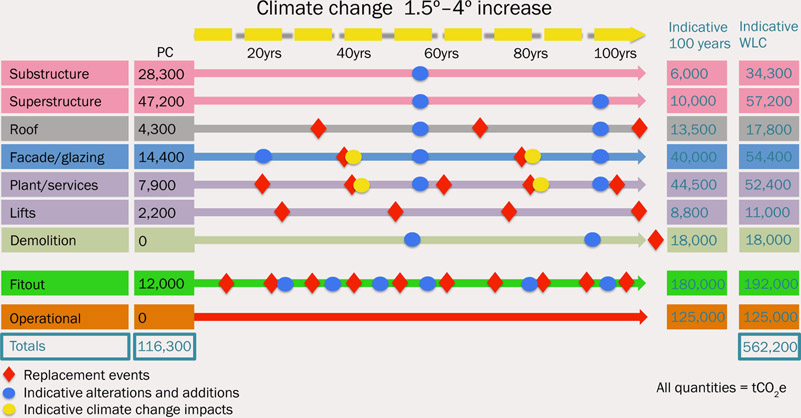
Figure 1.06: Carbon emissions of an EnerPHit residential retrofit project for Grosvenor – on the left at practical completion, and on the right over 60 years. Note the proportion of operational emissions. The diagram on the left will be more accurate than that on the right. The right-hand diagram makes assumptions with respect to the replacement of services, interiors, roof coverings, PVs, triple-glazed units and maintenance.
Thinking past practical completion will improve the overall performance of buildings, reduce carbon emissions and reduce lifetime financial costs by ensuring buildings are easier to maintain and dismantle. It will also change the architectural expression of buildings as the implication of low carbon choices and life cycle thinking take root. Also implicit in whole life thinking, and thinking about a building’s performance post practical completion, is factoring in the impacts of future climate change. By giving consideration to potential temperature increases of some 1.5-4ºC by 2100,8 we encourage more resource-efficient buildings, reduce future overheating, and design in future adaptability.
Low carbon thinking is, in essence, the efficient use of resources, and as such also aligns directly with low initial construction costs. Sustainability has the image of being an extra cost to a project. In fact, sustainability is about long-term value. In general, low carbon thinking and better material choices should not add to the cost of a project in the long term. There are many examples where a whole life carbon analysis produces a cheaper outcome.
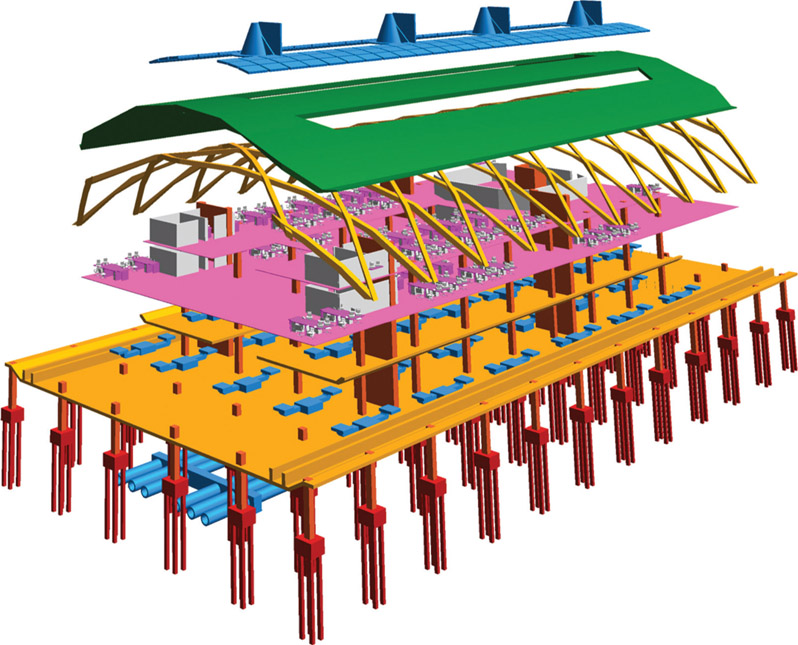
Figure 1.07:
System analysis for World Wildlife Fund – Living Planet Centre. This is done to understand the relationship of the lifespans of different elements.
This project for the World Wildlife Fund shows the outcome of comparing the embodied and operational carbon costs of double and triple glazing. Assessed over a 60-year period, the lower carbon whole life option was double glazing. This was because the carbon cost of the third sheet of glass, including the additional framing, and allowing for replacement at around 40 years, was greater than the additional heating-related emissions over the same period. In addition, the capital cost difference was lower for double glazing, with only a marginal increase in running costs. This example shows the necessity of taking a whole life view when assessing the carbon impacts of a design decision. In this case, focusing solely on operational emissions would have produced the higher carbon cost and the higher financial cost. The operational performance data was by Atelier 10; the embodied performance data was by SCP.