Chapter 6. Gaps and Volume
The previous chapter focused solely on price movement. Price is always the most important variable studied by a technical analyst. After all, it is a change in price that enables a trader to profit. This chapter adds another variable, volume, to the analysis. Volume is simply the number of shares traded over a specific time period, usually a day.
Volume is the oldest confirming indicator used by technical analysts. In 1935, H.M. Gartley provided general rules regarding how to interpret volume.1 Basically, Gartley suggested that price change on high volume tends to occur in the direction of the trend, and price change on low volume tends to occur on corrective price moves. During an uptrend, higher volume is taken as a sign of active and aggressive interest in owning the stock. However, during a price decline, volume might be light due to a lack of interest in the stock; a lack of potential buyers results in lower trading volume and a falling price.
A number of indexes and oscillators incorporate volume. The most well-known volume-related index is probably On-Balance-Volume (OBV), developed by Joseph Granville in his 1976 book, A New Strategy of Daily Stock Market Timing for Maximum Profit.2 Chaikin Money Flow, the Money Flow Index, and the Elder Force Index are a few examples of volume-related oscillators. Analysts use these indicators to confirm price trends. Volume is a secondary indicator to price analysis; volume cannot be used as a substitute for price analysis.
When using volume statistics, volume-related signals are usually not derived from the volume itself but from a change in the volume. Raw volume numbers measure the liquidity of securities. On a typical day near the end of 2011, the volume for Apple stock was more than 13 million shares. At the same time, the volume for IBM was less than 5 million shares. That Apple had a volume of 13 million shares, more than two-and-one-half times that of IBM, is not meaningful by itself. Knowing that IBM had a volume of 10 million shares on a particular day would be helpful information because it would represent a doubling in volume. If this happened as the price gapped up, you would say that the increased volume confirmed the price movement. The major focus in this chapter addresses the question, “Does volume serve to confirm price movement when stocks gap?”
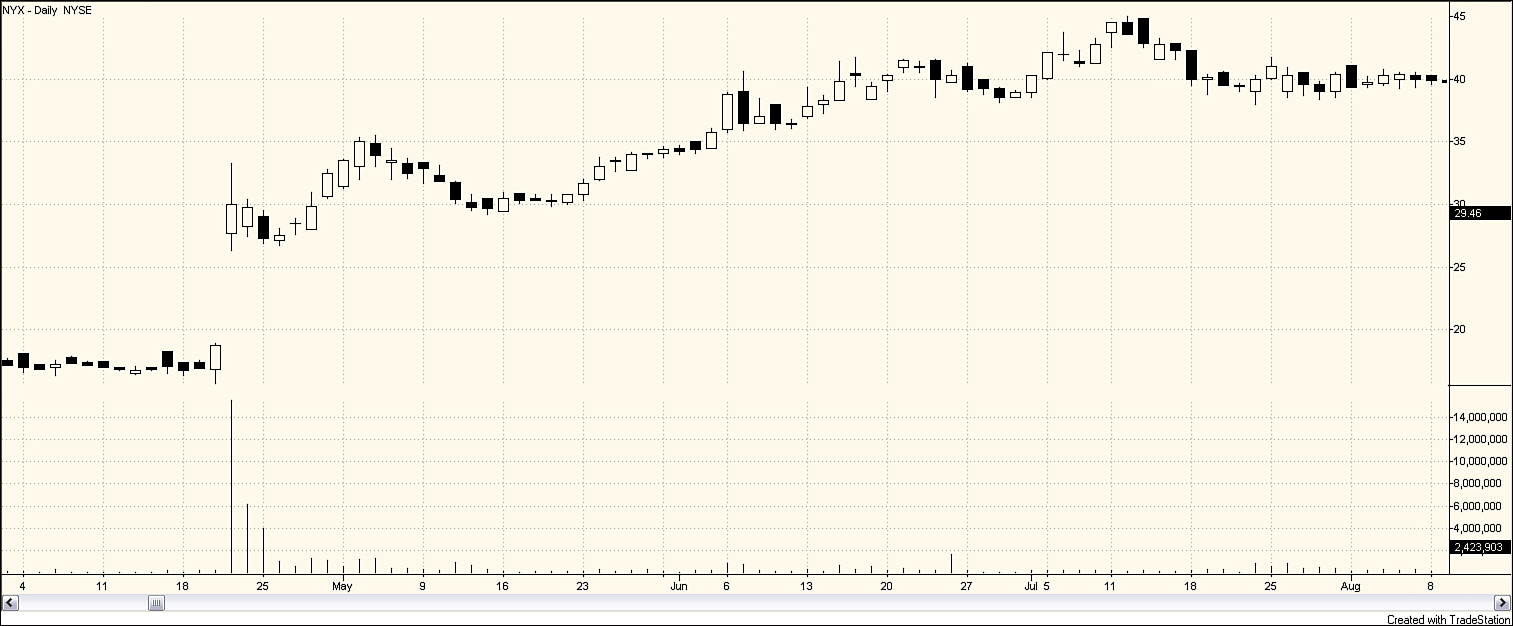
For example, look at the gap shown in Figure 6.1, which occurred on April 21, 2005, for NYSE Euronext (NYX). Price moved significantly higher on the up gap of almost 40%, but what is so striking is the high volume that occurred that day. More than 14 million shares of NYX traded hands that day. The volume on April 21 was more than 110 times higher than the average volume for the previous 10 days. In the authors’ study, NYX had the highest jump in volume relative to the 10-day average volume for any stock.
Created with TradeStation
Figure 6.1. Daily stock chart for NYX, April 1–August 9, 2005
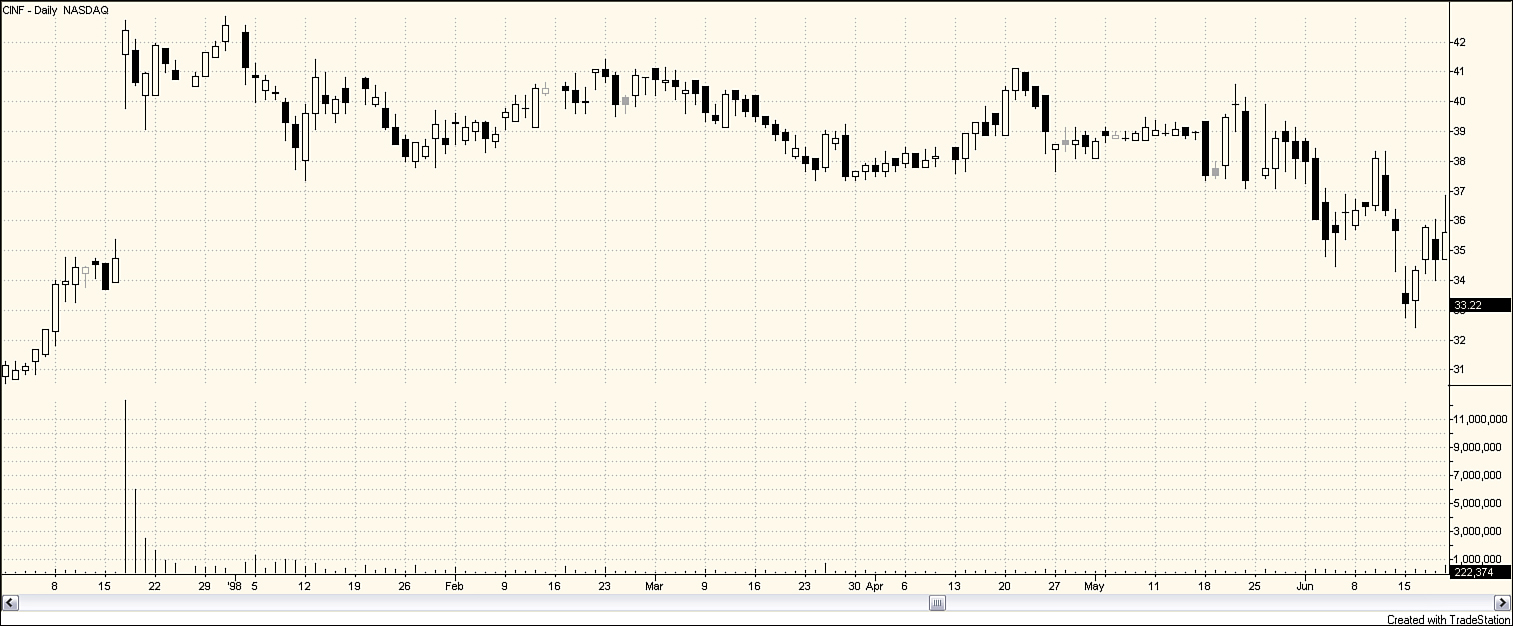
Gaps and a jump in volume are often associated with major news, such as the announcement of a merger, as in the case of NYX. The second highest jump in volume relative to a 10-day moving average of volume occurred on December 17, 1997, when Cincinnati Financial Corp (CINF) gapped up more than 12%. The reason for this gap up was not due to specific financial considerations for the company, such as an announcement of better-than-expected earnings. In late 1995, thinking that the company was not receiving the attention of industry analysts it deserved given its strong history of financial performance, CINF began aggressively marketing itself to Wall Street. CINF was successful at increasing analysts’ awareness of the company, and in December, 1997, was added as a component to the S&P500 index. The high-volume December 17 gap is a result of the publicity surrounding the stock’s inclusion in the S&P500 index and the purchases of CINF by those who manage portfolios designed to mimic the S&P500.
Figure 6.2 shows that the volume for CINF on December 17 was more than 100 times higher than the volume had averaged over the previous 10 days. To put the volume of CINF for December 17 in perspective, approximately 50% more CINF traded hands that day than IBM shares. Due to the increased interest in the stock, the volume continued to be extremely high for the next several days. Within a couple of weeks, however, the daily volume dropped to well below one million. The increased activity in the stock caused the stock to gap up on December 17, but this was not the beginning of an uptrend. The price was back in its pregap range of $35 by June; in less than 6 months all the price movement of the gap had been lost. This was a case in which a reversal strategy, shorting the stock after the up gap, would have been the profitable tactic.
Created with TradeStation
Figure 6.2. Daily stock chart for CINF, December 1, 1997–June 19, 1998
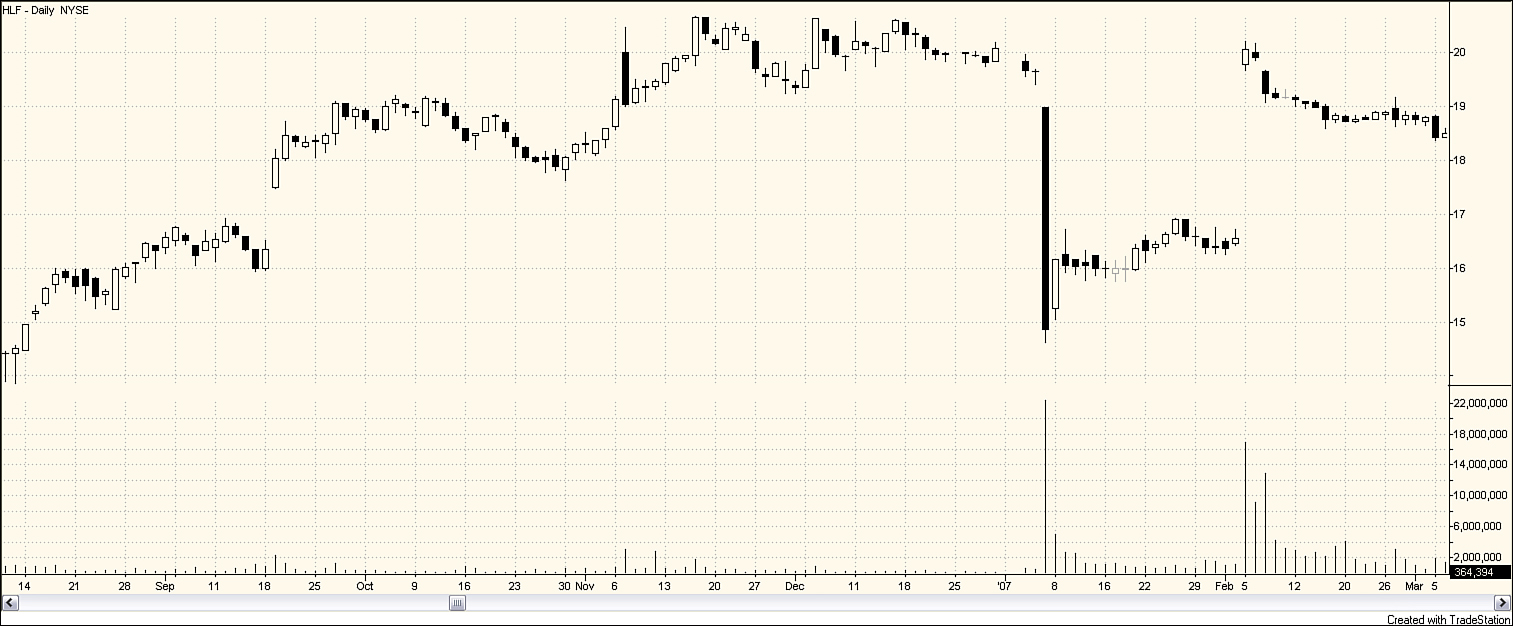
Extraordinarily high volume can occur on a down gap, also, as shown in Figure 6.3. On January 5, 2007, Herbalife (HLF) gapped down on extremely high volume. The gap was not an unusually large gap (approximately 2%), but the price move that day was significant in that HLF lost about 25% of its value. The volume for the day, more than 22 million shares, was approximately 65 times higher than the average 10-day volume. What caused so much selling of HLF on that day? The company announced that it had lower than expected sales growth during the fourth quarter of 2006 in Mexico, its largest market, and that it expected sales in Mexico to remain flat in 2007. Volume tapered off over the next few trading days, and price remained between 15 and 16 for a month. Because of the positive price movement on January 8, a trader purchasing HLF at the open the day after the gap would have a positive 1-day return of 6.07% and a market-adjusted 1-day return of 5.80%. On February 5, another gap occurred on high volume. This time the gap was up, bringing price up to the level it was at the beginning of January. What caused this second gap? HLF received a buyout offer from Whitney V LP, which owned approximately 27% of the company. Perhaps Whitney wanted to take advantage of the price decline of the previous month, thinking that investors overreacted to the reports in January of lower sales in Mexico. This led to a 19.08% 30-day adjusted market return for investors who purchased HLF at the open on January 8.
Created with TradeStation
Figure 6.3. Daily stock chart for HLF, August 9, 2006–March 5, 2007
You just considered three examples of stocks that had an exceptionally large increase in volume on the day of a gap. This type of increase is often accompanied by a specific, unexpected release of information about the company, such as FDA approval for a new drug, concerns about accounting irregularities, or acquisition possibilities. Sometimes, however, the increase in volume is not so dramatic. News may trickle in over a few days, resulting in increased volume before the entire story is known. For example, rumors of merger talks may result in increased interest in a company over several days with some price movement; then, when the rumors are confirmed, the price jumps further on heavy volume. Or an energy company’s stock begins to fall as the result of an oil spill; more selling leads to higher volume. As more news is released, investors realize that the spill is worse than originally thought, causing volume to rise and the price to fall as more investors sell.
You need to consider whether volume is heavier than normal on the day a stock gaps. The question becomes, “How do you measure normal?” You do not want to compare the gap day’s volume to the previous day’s volume. First, the previous day’s volume may also be higher than normal if information is trickling in. Second, the previous day’s volume may not be a good measure if there is reason to believe that it is unrepresentatively low. In some instances, investors expect the release of information about a company on a particular day. For example purposes, suppose Merck is scheduled to announce its fourth-quarter earnings on Tuesday. Monday, the market for Merck’s stock may be fairly quiet as investors sit on the sidelines waiting for the news. Or the previous day’s volume may be unusually low due to shortened holiday hours on the exchange. So, you know that you would want to compare volume on the day of the gap with the “average” volume for the stock. You can do this by comparing a day’s volume to a moving average of volume. The shorter the moving average to which you compare the gap day’s volume, the more you can look for discrete jumps in volume.
Table 6.1 divides gap downs by volume relative to the 3-, 10-, and 30-day moving averages. As might be expected, more down gaps occur on above average volume than on below average volume. About two-thirds of the gaps occur on above average volume. Furthermore, down gaps that occur on above average volume tend to be larger gaps than down gaps that occur on below average volume. The average size of a down gap is 1.34%; down gaps that occur on relatively low volume average only approximately 0.6%, whereas down gaps occurring on relatively high volume average approximately 1.7%.
Table 6.1. Returns for Down Gaps Occurring at Above Average and Below Average Volume Levels

You have seen the tendency for down gaps to reverse. Generally, you have seen that a reversal strategy, in this case going long, is more profitable following a down gap than a continuation strategy. The returns in Table 6.1 suggest that this occurs even more quickly for down gaps that occur on low volume. Down gaps that occur on low volume tend to be small gaps, and price tends to rise the following day. The returns for low-volume down gaps are positive at all the return periods considered.
Down gaps that occur on higher than average volume tend not to reverse until a week out. The 1-day and 3-day returns for the four measures of high-volume gaps are all negative. These down gaps appear to have more initial power behind them; volume is high and the initial price movement on the day of the gap is significant. The momentum behind that gap tends to stay with the stock for a couple of days. However, by Day 5 the story has changed and returns are positive. Interestingly, at the 30-day mark, nominal returns for low-volume down gaps exceed those for high-volume gaps, but the market-adjusted returns for the high-volume gaps are higher.
Now look at how volume impacts the profitability of trading up gaps. Table 6.2 contains information about volume for up gaps. The majority of the 116,903 up gaps occur on relatively high volume. When using the 3-day average volume as the criterion for determining high-volume gaps, 71% of the up gaps are high-volume gaps. Like the down gaps, up gaps that occur on high volume tend to be larger than up gaps that occur on low volume. The average gap size for an up gap is 1.11%; up gaps on low volume tend to be 0.6% or less, whereas up gaps on high volume tend to be more than 1.3%.
Table 6.2. Returns for Up Gaps Occurring at Above Average and Below Average Volume Levels

As you have seen before, stocks that gap up tend to reverse direction. Investors who go long at the open the day after an up gap have a negative return up to Day 10. Table 6.2 shows this is true for stocks that gap up on both high and low volume. However, the statistics in Figure 6.2 indicate that stocks that gap up on low volume tend to outperform stocks that gap up on high volume by the 30-day time frame. This might seem counterintuitive; you might think that stocks that have a big gap up on high volume have many eager buyers and momentum will push these stocks higher. The counterargument that might explain the results in Table 6.2 is that a large gap on high volume means that all the buyers came in quickly on the same day, and there isn’t anything to keep pushing the stock higher. Smaller up gaps on lighter volume may indicate that new information is trickling out to investors and that, as interest in the stock grows, the price will continue to rise.
So far, you have compared sets of stocks that gap on above average volume with those that gap on below average volume. Now break those groups down a bit more, refining your definition of above average and below average volume. In Table 6.3 down gaps are grouped according to the volume on the day of the gap relative to the previous volume for that particular security. Five categories of volume size are considered:
• Extremely low volume: Stocks that had a volume on the day of the gap that was less than 25% of the average volume for the security
• Below average volume: Stocks that had a volume on the day of the gap that was between 25% and 75% of the average volume for the security
• Average volume: Stocks that had a volume on the day of the gap that was within 25% above or below the average volume for the security
• Above average volume: Stocks that had a volume on the day of the gap that was between 125% and 175% of the average volume for the security
• Extremely high volume: Stocks that had a volume on the day of the gap that was more than 175% of the average volume for the security
Table 6.3. Returns for Gap Down Stocks Sorted by Relative Volume
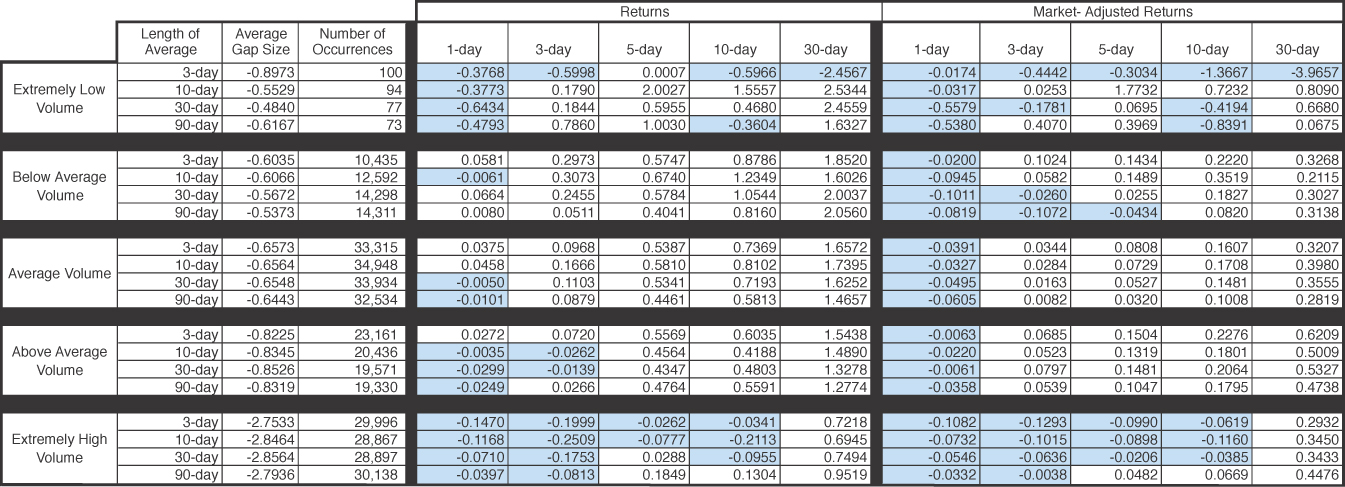
For each of the five categories, we measure the average volume in four different ways: 3-day, 10-day, 30-day, and 90-day average volume. About one-third of the down gaps occur on average volume. At least 29% of down gaps occur on what we categorize as extremely high volume. Very few of the down gaps, less than 0.1%, occur on extremely low volume. Consistent with previous results you have seen, Figure 6.3 indicates that the higher the relative volume on the day of the gap, the bigger the gap; the gap size for average volume gaps tends to be approximately 0.66%, whereas the gap size for the above average volume group is in the 0.82%–0.85% range. The gap size for extremely high volume down gaps is in the 2.7%–2.9% range.
As you have seen several times, stocks that gap down on Day 0 tend to move lower during the day on Day 1. This relationship generally holds true for stocks that gap down on high volume and on low volume; especially when market adjusted returns are considered. Stocks that gap down on volume that is 75% below the average 3-day volume or lower behave differently than most gap down stocks in that returns remain negative over longer holding periods. The 30-day market-adjusted return for this group is –3.9657%. This would suggest a profitable shorting strategy for stocks that gap down on extremely low volume; however, with a sample size of 100, there are not enough observations upon which to build a trading strategy. The market-adjusted returns all the average volume and above average volume down gap categories were positive at the 3-day, 5-day, 10-day, and 30-day points.
Table 6.4 provides a similar analysis for stocks that gap up. About 35% of the up gaps occur on average volume. Again you can see that gaps that occur on higher volume tend to be larger gaps. The up gaps occurring on average volume tend to be approximately 0.64%, whereas the up gaps that occur at extremely high-volume levels average at least 2.08%.
Table 6.4. Returns for Gap Up Stocks Sorted by Relative Volume
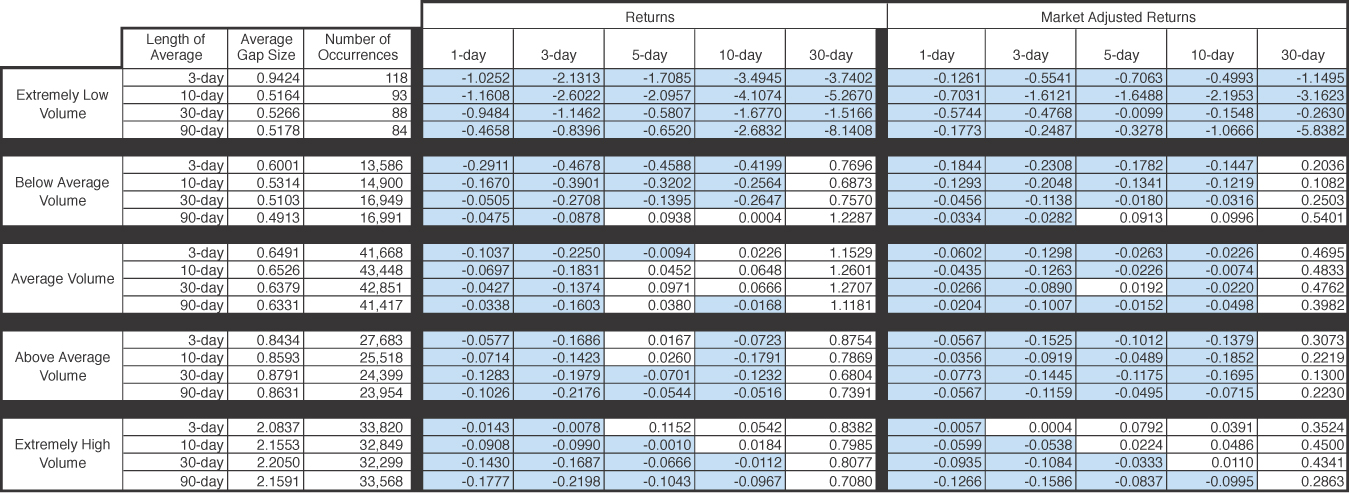
Table 6.4 contains a high number of negative returns. When you consider all the up gaps lumped together, you find that 1-, 3-, 5-, and 10-day nominal returns and market-adjusted returns were negative. This pattern appears to hold true regardless of volume on the day of the gap. The additional information that Table 6.4 provides is that if a stock gaps up on extremely low volume, price reverses and continues downward over the next 30 days. Stocks that gap up on average volume do not see positive market-adjusted returns until after 10 days, but these are the strongest performers at the 30-day mark.
Summary
This chapter considered a classic variable used by technical analysts to confirm price movements: volume. Traditional analysis suggests that price movements, especially upward movements, on high volume are more meaningful than when they occur on low volume. However, the analysis in this chapter suggests that volume does not provide a great deal of useful information or added value. We determined in earlier chapters that gap downs tend to be followed by continued price declines on Day 1, but prices quickly reversed. The biggest insight that volume gives you is that price reversal tends to occur sooner for down gaps that occur on moderately low volume than for those occurring on high volume. Table 6.1, shows that low-volume down gaps tend to reverse on Day 1, whereas high-volume down gaps tend not to reverse until after Day 3.
Endnotes
1. Gartley, H.M. Profits in the Stock Market, 3rd ed. (1981). Pomeroy, WA: Lambert-Gann Publishing Co., 1935.
2. Granville, Joseph. A New Strategy of Daily Stock Market Timing for Maximum Profit. Englewood Cliffs, NJ: Prentice-Hall, Inc., 1976.

