Chapter 3. The Occurrence of Gaps
This chapter examines the frequency of gaps across many dimensions. How often do gaps occur? Are gaps becoming more frequent or less frequent over time? Does index membership play a role in gap frequency? This chapter explores these questions.
Data and Software
Before getting into the answers to those questions, you need to understand the data used in writing this book. The stock data came from Norgate Investor Services, which sells a software package called Premium Data. There are two different U.S. stock price datasets available within Premium Data. Historical data can be purchased for either currently listed stocks or delisted stocks. The base package for each contains price history from 1985, but an add-on extends the price history to 1950.
You can find details concerning the database methodology and a discussion of delisting on the Premium Data Web site (www.premiumdata.net/products/premiumdata/ushistorical.php#delisted). The prices have been adjusted for splits, reverse splits, and other capital-related corporate actions. Adjusting for splits causes prices to be adjusted backward in time to provide a continuous series from a value perspective. For example, a 2 for 1 stock split should cause a stock’s price to drop in half (in the absence of other information). So if before the split you owned 100 shares at $50 per share, after the split you would own 200 shares at $25 per share. Obviously, the value of your stock holdings is not down by 50%. To avoid the appearance of a 50% drop in value, the pre-split price is adjusted to $25. This price adjustment is continued backward in time to the beginning of the price data.
The price adjustment previously described can cause some confusion. Say that this book describes prices around the occurrence of a gap that occurred sometime in 2002. If you were to refer to price charts, price quotes, newspaper articles, web discussions, and so on at the time of the actual gap, the price may be different than what this book uses due to price adjustments that have been made to keep continuity in the series. Although price adjustments affect the quoted numbers, they do not affect the identification of gaps or percentage changes (such as investment returns). If the open, high, low, and close prices have all been adjusted by the same factor, a gap between numbers such as 50 and 52 is still a gap if the numbers have been adjusted to 25 and 26. Furthermore, the percentage difference between the two numbers is 4% in both cases.
For purposes of this book, our dataset goes from 1995 through the end of 2011. (Later you will learn that 2011 was an interesting year for gaps.)1 The ending date affects index membership and industry designation. It is extremely difficult to reconstruct index membership over time. Because index membership vis-à-vis gaps is interesting, but not critical, we opted to simply use index membership and industry designations as of the end of 2011.
Liquidity Considerations
Liquidity is a tricky issue to handle. Suppose you use software that helps you identify stock price gaps, and you see that a certain stock has gapped up on a certain date. Examining more closely, you see that the price gap was from $1.02 to $1.03 and that the total trading volume for the 2 days was 5,000 shares. Would this be of interest? Unless you were an individual investor with limited funds, probably not. A dollar volume of trading of approximately $5,000 over a 2-day period for most investors would be woefully inadequate liquidity. What if the price gap were from $102 to $103 and the total trading volume were 50,000,000 shares? Would this be adequate liquidity? For almost all investors the answer would be ”Yes.” But, the two examples are radically different. What about examples that fall between these two?
In trying to determine a reasonable liquidity constraint, we talked to various experienced market professionals. We got a variety of opinions about what numbers should be used to impose a liquidity constraint concerning which gaps to include in our study. In the end, we opted to impose a constraint that the dollar-volume of trading (closing price times shares traded) had to be at least $5,000,000 on the day of the gap and the two preceding days. Therefore, a stock trading at approximately $5 per share with a trading volume of 500,000 shares per day would not have made the cut. But if the price had been approximately $10 per share with volume of 500,000 shares per day, it would have made the cut. In addition, we also imposed a separate volume constraint of 100,000 shares per day.
The $5 million dollar-volume and 100,000 shares per day volume criteria seemed reasonable for 2011, but what about earlier years? We experimented with various approaches to adjust the two constraints in earlier years. There seemed to be some problems with every approach; there isn’t any perfect way to make such an adjustment. In the end, we opted to make a linear adjustment based on the number of years prior to 2011. After examining the total number of gaps relative to the number of stocks listed at the time and examining which stocks were included or excluded at various points in time, we arrived at an adjustment that we felt was reasonable.2
Frequency of Gaps
So, how frequently do gaps occur? Table 3.1 shows the total number of gaps by year for currently listed stocks. As shown, there is no shortage of gaps to examine. In 2010, 22,936 gaps occurred; in 2011, this number increased to 32,232. A logical question from a trading perspective is, “How many gap trading opportunities am I going to have on an average day?” Because the total number of gaps has been increasing fairly steadily over the years, you could just take a daily average using the most recent year as an estimate of what you might expect. The number of trading days in a year varies slightly from year to year, but 252 is an average often used. With that in mind, the 32,232 gaps in 2011 divided by 252 gives an average of about 128 gaps per trading day. Clearly, it would seem that potential trading opportunities are frequent occurrences.
Table 3.1. Frequency of Gaps by Year, 1995–2011
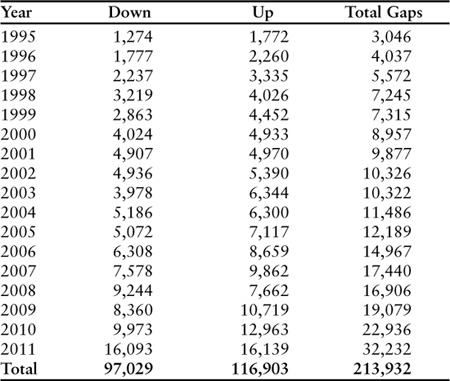
However, the situation is more complicated due to clumping. Gaps are not evenly distributed across the year. The number of gaps can be extremely high on certain days, which leads to some other questions addressed shortly.
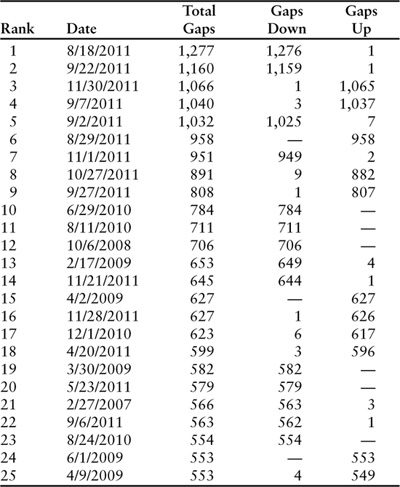
Table 3.2 shows the 25 days with the highest number of gaps. It is quite interesting that the 9 days with the highest number of gaps all occurred in 2011 and that 14 of the top 25 were in 2011. There was much discussion in 2011 about the high degree of market volatility. The high incidence of extreme gap days was another manifestation of market volatility.
Table 3.2. Days with the Greatest Number of Gaps, 1995–2011
Now think about some reasons that gaps might occur. You can divide the reasons into three categories: marketwide events, industry-specific events, and company-specific events. Some events that may have broad market impact are political events, acts of war/terrorism, commodity price shocks (especially oil), interest rate changes, and currency changes. For these events to have substantial market impact, they would need to be unexpected events.
Things like the election results concerning the 2008 election would not be totally unexpected. The polling data leading into election day suggested that Obama was likely to be elected, so little market impact would be expected when the expected occurred. On the day of the election, November 4, there were 116 up gaps and 9 down gaps. On the following day, there were 39 down gaps and 3 up gaps, not a high amount of activity. What about the 2000 Bush-Gore election with its chaotic Florida recount? The gap activity on November 8, the day after the election, was minimal; there were 39 down gaps and 3 up gaps.
Compare these events to a virtually unexpected event such as the tragedy of 9/11. Because the attacks occurred in the early morning, the New York markets had not yet opened that Tuesday. Due to the damage in New York City, the New York Stock Exchange, the American Stock Exchange, and the NASDAQ remained closed until Monday, September 17. The gap activity when markets reopened was a combination of marketwide and industry-specific effects. Three-hundred-and-twenty-one stocks gapped that Monday. Not surprisingly, most of the gaps, 310, were down gaps. But, there were 11 stocks that gapped up. Five of the 11 were defense industry stocks (General Dynamics, L-3 Communication Holdings, Raytheon, Lockheed Martin, and Northrup Grumman).3
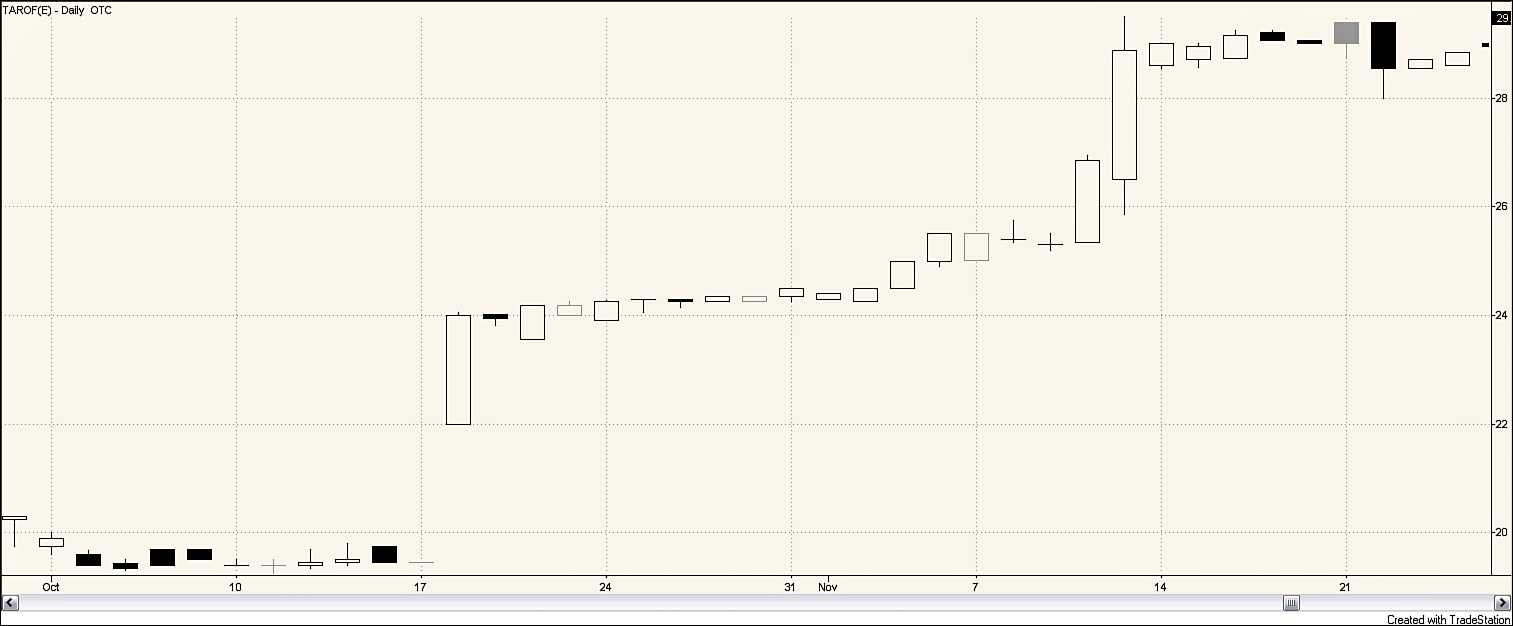
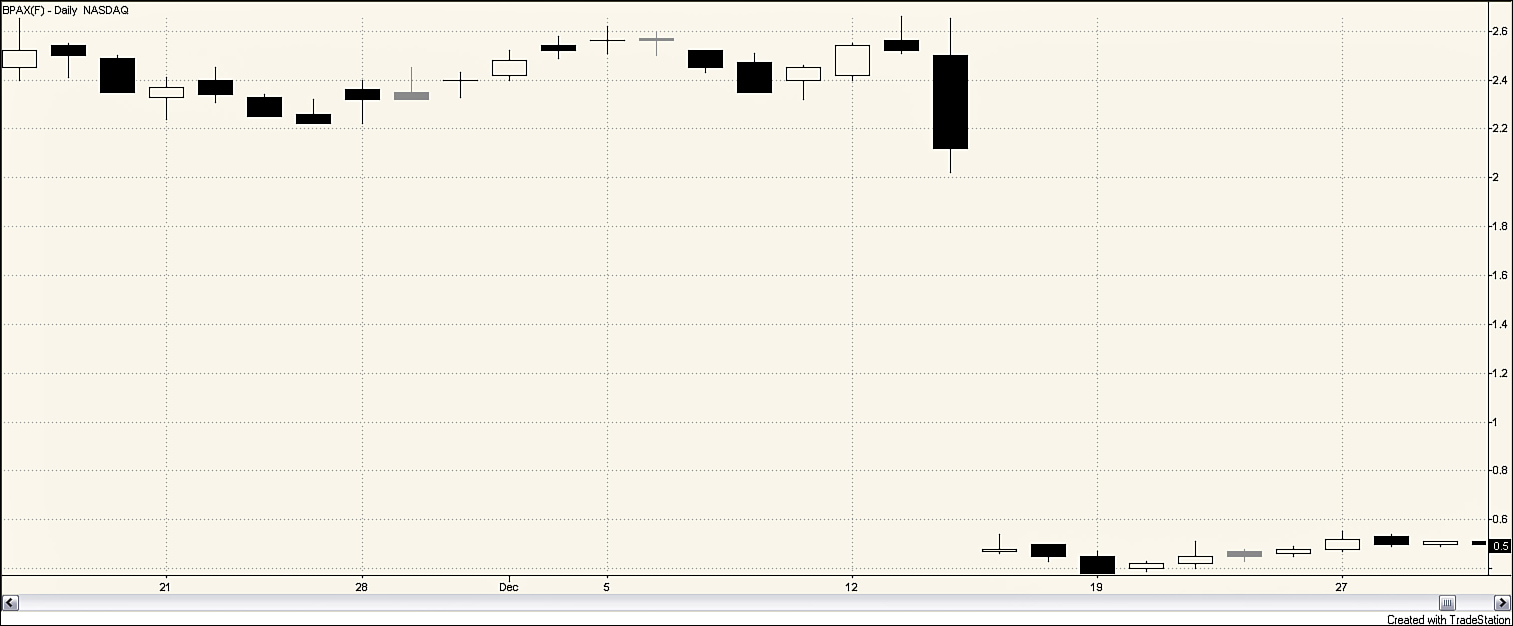
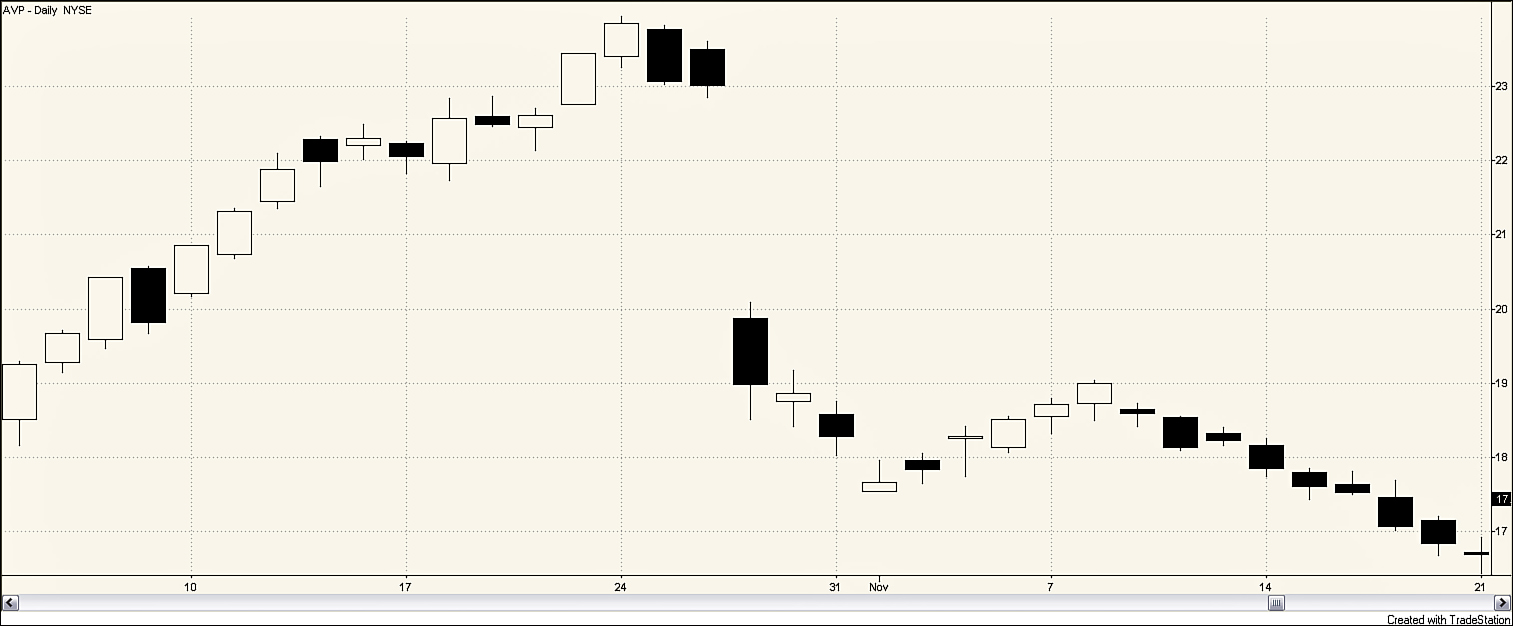
Some company-specific events that could cause gaps are mergers and acquisitions, court rulings, regulatory actions (such as approval of a drug), SEC actions, and changes in top management (such as the unexpected death of a CEO). An acquisition offer caused Taro Pharmaceutical (TAROF) to gap up (see Figure 3.1) on October 18, 2011. Besides possible acquisitions, pharmaceutical companies are particularly prone to some large gaps when the results of drug trials are released. BioSante Pharma Inc. (BPAX) (see Figure 3.2) gapped down strongly on December 15, 2011 when news emerged that one of its drugs had failed Phase 3 clinical trials, which is the final testing phase. Figure 3.3 shows the large gap down for Avon Products (AVP) on October 27, 2011. This was triggered by the announcement that the SEC was investigating Avon concerning whether the company’s contact with some financial analysts violated fair disclosure regulations.
Created with TradeStation
Figure 3.1. Daily stock chart for TAROF, September 30–November 24, 2011
Created with TradeStation
Figure 3.2. Daily stock chart for BPAX, November 17–December 30, 2011
Created with TradeStation
Figure 3.3. Daily stock chart for AVP, October 3–November 21, 2011
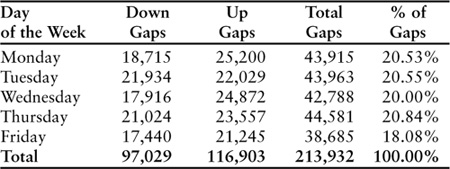
Another question to ask is, “Are gaps more likely to occur on some days of the week rather than others?” You might hypothesize, for example, that more gaps would occur on Monday than other days of the week because 3 days of new information is incorporated into the price rather than just one. However, the information provided in Table 3.3 suggests that gaps occur with about the same frequency on Monday through Thursday, with Friday seeing slightly fewer gaps.
Table 3.3. Occurrence of Gaps by Day of the Week, 1995-2011
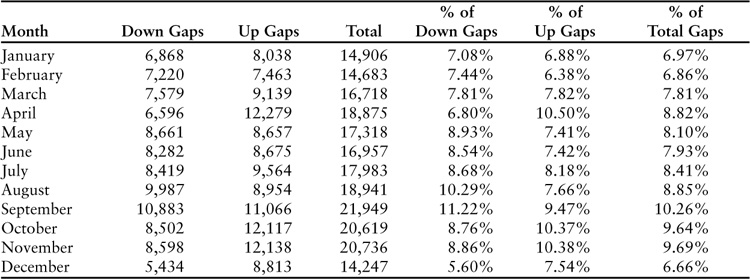
Do gaps tend to occur in certain months more than other months? Table 3.4 presents the distribution of gaps by month. Of course, not every month has the same number of trading days. February, for example, often has fewer trading days than other months simply because it is a shorter month. The number of trading days in a given month is also affected by when weekends and holidays fall. The highest percentage of gaps (10.26%) occur in the month of September, whereas only 6.66% of the gaps occur in December. Approximately 21.5% of down gaps occur in September and October. April is an interesting month in that it has the highest percentage of up gaps of any month (10.5%) but is second lowest, only behind December in the percentage of down gaps.
Table 3.4. Occurrences of Gaps by Month, 1995–2011
Size of Gaps
In addition to looking simply at the number of gaps, it is useful to examine gap size; all gaps are not created equally. Remember that a gap means that there is a jump in the movement of a security’s price from one day to the next. A gap can be as small as a penny, or it can be as large as several dollars. There is theoretically no limit to the size of an up gap, but a stock’s price can’t fall more than 100%.
This raises the question of how to measure the size of the gap. The authors chose to look at the percentage size of the gap using a wick-to-wick (in candlestick terms) measure. For stocks that gapped up, calculate the percentage change from the previous day’s high to the low on the day of the gap. In formula form, this is
For down gaps, calculate the percentage change from the previous day’s low to the high on the day of the gap:
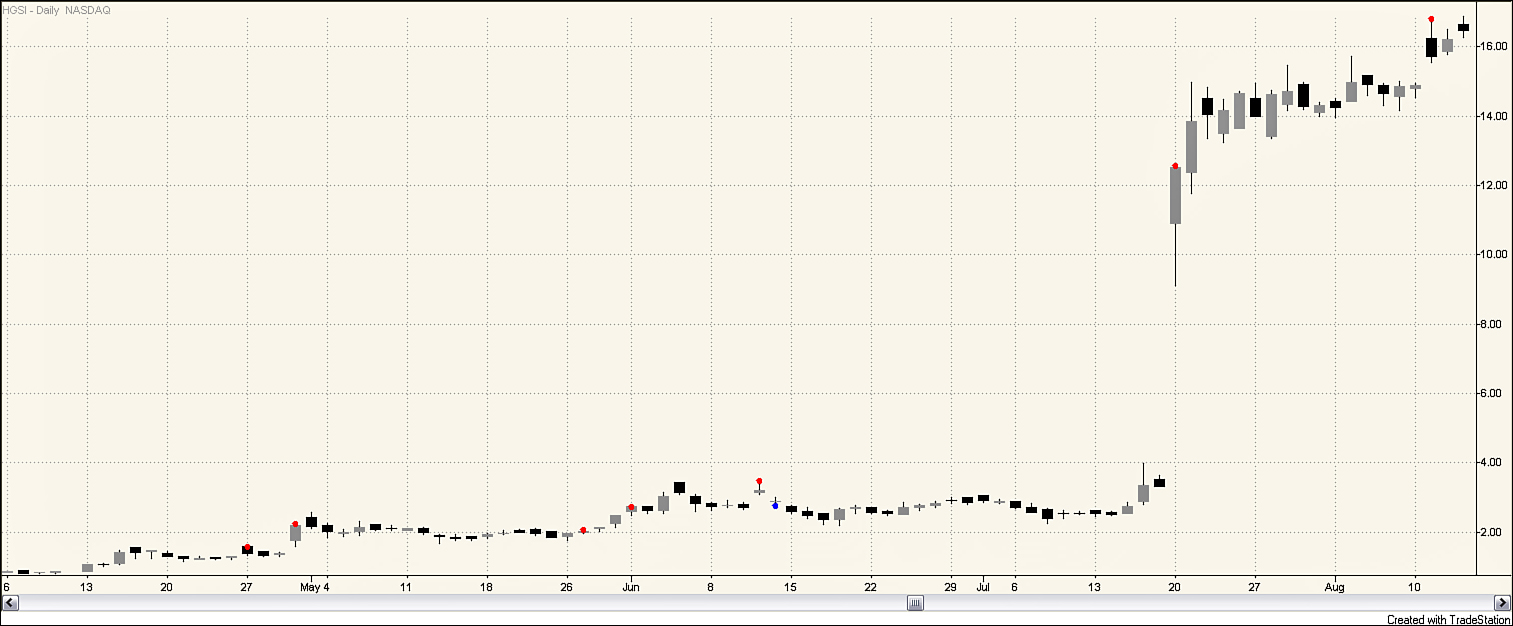
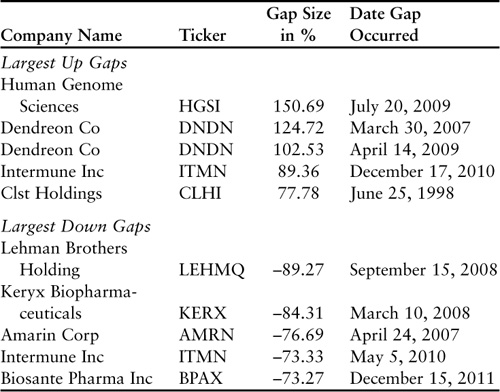
The average (or mean) size of an up gap in the sample is 1.1052%. The average size of a down gap is –1.3394%. The vast majority of gaps are less than 1% either up or down. However, there are some extreme cases: Table 3.5 shows the five largest up gaps and down gaps over the 1995–2011 time period. The largest up gap in the database occurred on July 20, 2009, when Human Genome Sciences (HGSI) gapped up 150.69%. As shown in Figure 3.4, HGSI had been trading between $2 and $4 a share since late May 2009. On July 20, the stock opened at a price of $10.89; even though the price fell to a low of $9.10 during the day, it closed near its high at $12.51, leaving a substantial hole, or gap, visible in the chart.
Table 3.5. Largest Up Gaps and Down Gaps in %, 1995–2011
Created with TradeStation
Figure 3.4. Largest gap up, daily stock chart for HGSI, April 6–August 13, 2009
What happened that caused HGSI’s stock to more than double in price from one trading day to the next? Business news headlines that day stated, “Shares of Human Genome Sciences Inc. rocketed on Monday after the company released a positive late stage study for its new lupus drug Benlysta, fueling speculation that it could be taken over by commercial partner GlaxoSmithKine.” (Kennedy) This enormous gap occurred due to substantial company-specific news.
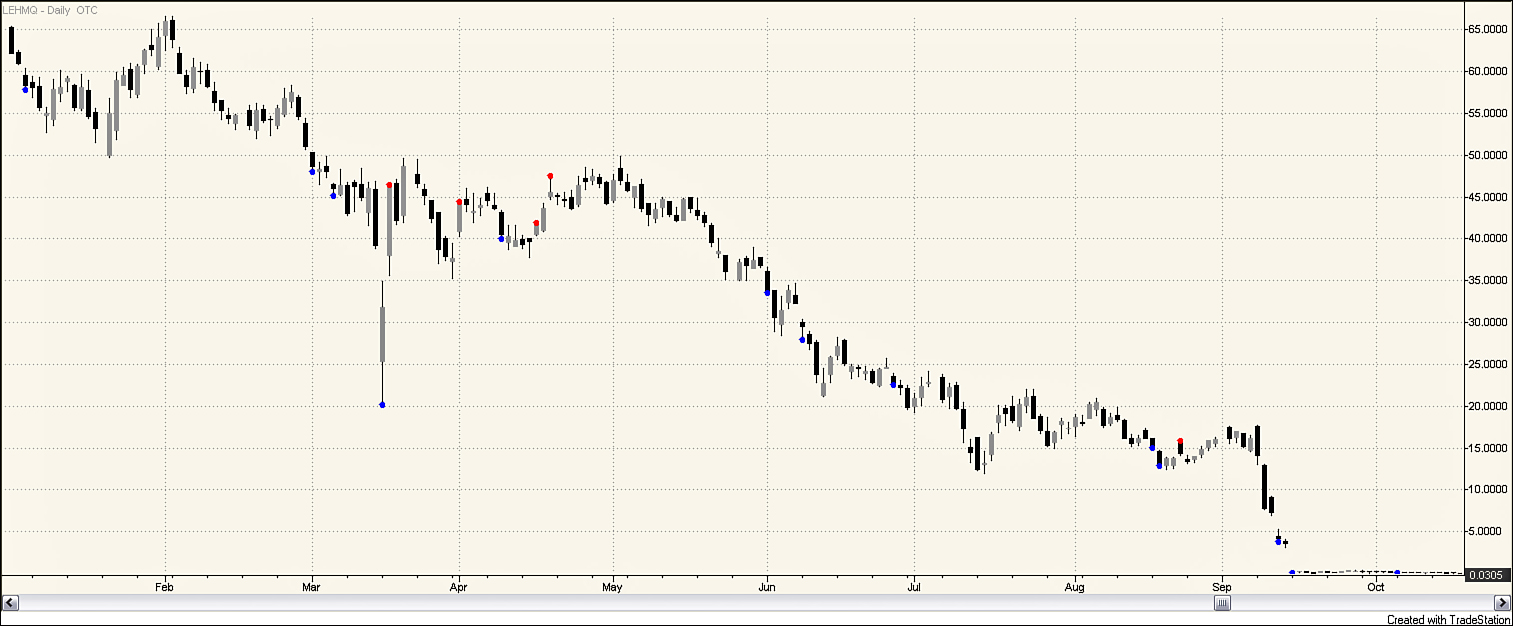
At the other end of the spectrum, the stock with the largest down gap will probably come as no surprise. On September 17, 2008, Lehman Brothers Holding Company (LEHMQ) dropped with a gap of more than 89%. Figure 3.5 shows the downward move in LEHMQ leading up to this enormous gap. As recently as February, the stock was trading at 65. By August the stock had dropped to 15. By September 9, the stock had fallen below 10, and 2 days later, on September 11, it was down below 5. It was like watching a limbo contest. How low could it go? On September 15, with the stock at approximately 20 cents per share, the company filed a petition under Chapter 11 of the U.S. bankruptcy code. Furthermore, on September 17, the NYSE moved to suspend trading of LEHMQ on the exchange.
Created with TradeStation
Figure 3.5. Largest gap down, daily stock chart for LEHMQ, January 1—October 17, 2008
Gaps by Index Membership and Industry
Another way to slice things is to view the data by index membership. The index membership is as of the end of 2011. So a stock that ended 2011 as one of the S&P 500 component stocks may not have been in the index during previous years.
Market capitalization, often referred to as market cap, is a simplistic measure of a company’s size. To find market cap, you multiple the company’s stock price by the number of shares outstanding. The basic logic is, “How much would I have to pay to buy all the stock of the company?” However, this is a crude estimate. The observed price at a given point in time is the price for a transaction involving a limited number of shares (typically 100 to 10,000). If you want to buy all the shares, you would pay far more (as evidenced by tender offers) to attract more sellers.
The indexes differ by market cap, number of index components, and construction methodology (such as price-weighted or value-weighted). Some of our students have actually missed an exam bonus question (that was meant as a gift) that was stated as “How many stocks are in the S&P 500 (note: this is NOT a trick question)?”
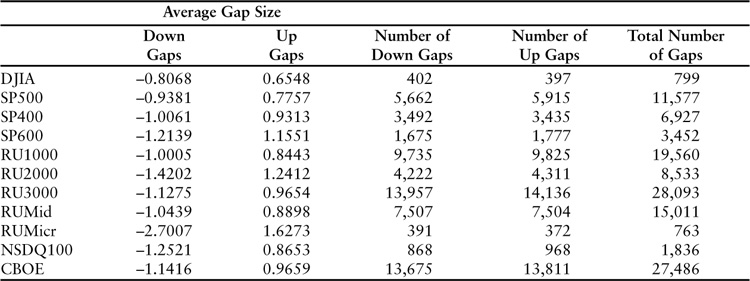
Table 3.6 shows the total number of gaps and average gap sizes for various indexes focusing just on 2011. Because the index membership was determined at the end of 2011, the breakdown is fairly accurate. There were index component changes that occurred at various points in the year, but they would probably not have significantly affected the Table 3.6 patterns. The figures in Table 3.6 show a tendency for stocks with smaller market caps to have (on average) larger gaps. One conjecture is that it relates to liquidity. Think about Wal-Mart (WMT) versus TravelZoo (TZOO), a Russell Microcap stock. Wal-Mart is a component of both the S&P 500 and the Dow Jones Industrial Average. WMT has a large analyst following and had an average volume of 17.3 million shares on the days it gapped in 2011. TZOO’s average volume on the days it gapped was just under 2 million shares. The large number of eyes following WMT means that many people are aware of every small piece of news that might impact its price. Even a small news item might cause someone to initiate a trade. On the other hand, minor news related to TZOO may go unnoticed or may simply be ignored. This could lead to larger price jumps when an accumulation of news occurs, which would cause more price gapping.
Table 3.6. Gap Occurrences in 2011 by Index Membership
Stocks also vary greatly in the number of gaps they experience. There were more than 9,000 stocks in the database of currently listed stocks. Of these there were 2,714 that experienced at least one gap (subject to price and volume constraints at the time of the gap) during the 1995–2011 time period. The average number of gaps per stock was 79. The median was 50.
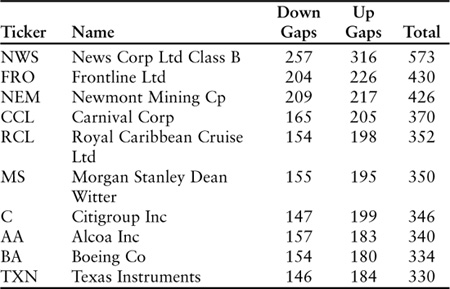
Which stocks experienced the most gaps? Table 3.7 shows the ten stocks with the highest number of gaps. News Corp Ltd. (NWS), with 573 total gaps, had the most. Given the earlier discussion about how stock prices are affected by unexpected news, it is ironic that News Corp Ltd. had the highest number of gaps. Its pattern of gaps was reasonably consistent over time. It had at least 16 gaps in each of the 17 years from 1995 through 2011. The peak was in 2000 when it gapped 69 times.
Table 3.7. Ten Stocks with the Highest Number of Gaps, 1995–2011
A final way to slice the number of gaps is by industry. The term “industry” seems straightforward at first blush. However, there are many complications. Is there such a thing as the “computer” industry? It is a term you might use in casual conversation. However, does it make sense to lump IBM, EA, and STX together? IBM engages in a wide range of activities from various types of software to various types of hardware to consulting services. Electronic Arts (EA) makes multimedia and graphics software. Seagate Technology PLC (STX) specializes in data storage devices. You could easily subdivide “computer industry” into multiple smaller industries. Who decides which industry a given company is in? There are a number of different classification schemes, some developed by private sources and some developed by public entities. Premium Data provides a classification scheme that assigns each company into one of 102 different industries (103 if you count “unclassified”).
Table 3.8 lists the industries (the unclassified category is not shown in this list but would have ranked 2nd with 8,155 gaps) with the largest number of total gaps. The semiconductor industry accounted for 5.7% of all gaps; approximately 31% of all gaps occurred in one of these ten industries.
Table 3.8. Industries with the Highest Number of Gaps, 1995–2011
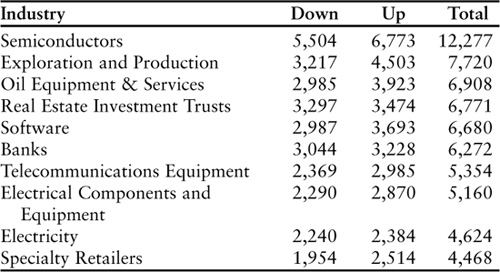
Do these results make sense? We think they do, at least in a general sense. It seems logical that stocks in industries sensitive to major marketwide events (such as oil price shocks) might have a high number of gaps. This would explain why the exploration and production industry, for example, is second in the list. Beyond marketwide factors some industries are just more volatile than others. For example, high-tech stocks are more volatile than consumer staple stocks.
Summary
Gaps can occur for a variety of reasons. There may be some macroeconomic event such as a sudden jump in the price of oil or the impact of a terrorist attack. Oil price changes affect some industries, such as airlines, more than other industries, so there are days when most of the gaps are concentrated in a few industries. At the individual company level there are many possible events that could lead to a gap in the company’s stock price such as court decisions, mergers and acquisitions, regulatory rulings such as the results of pharmaceutical trials, and so on.
Gaps are quite commonplace. The median number of gaps per day for the stocks that met our criteria was 31; on over one-half of the trading days, there were more than 31 gaps. The liquidity constraints were fairly rigorous, so there are actually many more stocks that gap on a typical day. Individual investors should not have difficulty finding potential gap-based trades.
Something that came as a surprise was that the number of gaps has been growing over time. There were more gaps (32,232) in 2011 than in any of the preceding 16 years. As shown in Table 3.1, the annual increase in the number of gaps has been quite steady.
Some days have an extremely high number of gaps. Refer to Table 3.2 to see the 25 days with the most gaps. The total number of gaps ranges from 553 to 1,277. Another remarkable thing about 2011 shows up in this table; 9 of the 10 days with the highest number of gaps occurred in 2011. One gap direction was always dominant. The highest number of gaps in the opposite direction from the majority was only 9; in 8 of the top 25 days, the gaps were entirely either up or down with none in the opposite direction.
There seems to be some slight seasonality in the number of gaps. In the study, more gaps (10.26% of the total) occur in September than in any other month, whereas December is the lowest month for gaps (6.66% of the total). Over the course of a week, the number of gaps was quite even between Monday and Thursday. On Fridays there were slightly fewer gaps (about 18% of the total).
All gaps are not created equal; some are much bigger than others. You saw how the percentage size of a gap can be calculated, which gives a relative measure of the size of the gap. Stocks can’t gap down lower than –100%, but there is theoretically no upper limit to the size of an up gap. The most extreme gaps in the sample were an up gap of 151% and a down gap of –89%.
In addition to certain days having a higher concentration of gaps, certain stocks and certain industries can have far more than the average number of gaps for their category. The ten stocks in the study that had the highest number of gaps had gap totals ranging from 330 to 573. The industry with the highest number of total gaps was the semiconductor industry, which had a significantly larger number of gaps than its two closest competitors: exploration and production, and oil equipment and services. Approximately 31% of the total number of gaps fell into one of the ten industries shown in Table 3.8.
In the research, no foolproof get-rich methods for trading gaps were found. However, knowing some of the tendencies can be useful in trading. In subsequent chapters gaps will be dissected at deeper levels. There are some clues as to where you might focus your attention for gap trading.
Endnotes
1. The authors originally considered gaps going back to 1950 and found an increasing incidence of gaps in recent years, which raised questions about the benefits of going further back in time in the analysis. The 1995–2011 period provides enough market diversity to analyze both bear and bull markets while minimizing some of the problems, such as how to control for market returns and liquidity measures, which occur when trying to analyze data from several decades ago.
2. Issues such as stock splits add complications to determining historical liquidity measures for stocks. Suppose a stock trades for $6 a share and has a volume of 1 million shares on Monday; this company’s dollar volume of trading would be $6 million. If the stock splits on Tuesday and the volume on Tuesday is 2 million shares at a price of $3, the dollar trading volume would be $6 million. The historical price is adjusted to $3 so that it does not appear that the company’s stock just lost half its value. However, historical volume is reported as the actual volume. So, going back and looking at the dollar volume on Monday, it would appear to be only $3 X 1 million shares or $3 million. Therefore, you need to use a lower dollar volume to filter for liquidity constraints in earlier years.
3. Interestingly, September 17 doesn’t make the list of the top 25 highest gap days. The market did experience a large decline, however, with the DJIA falling 7.1%. The 684 point loss was the biggest-ever one-day point decline the market had experienced until September 29, 2008 when it declined 777 points.

