
Revenue income can be achieved from two main sources, direct and indirect. On the direct side, it includes training sales, professional services and product sales teams. On the indirect side, it includes authorised training partners, channel partners and strategic alliances.
This chapter looks at the various pricing models that a training department might support, including how revenue can be generated via royalty payments, kit sales and revenue share schemes. It also considers the challenges associated with geographic pricing and how to maximise and protect revenue.
The final sections cover renewals and the role of a customer success manager in maintaining regular contact with existing customers, to assist in maximising their use of training and their associated investment in it.
GROSS VERSUS NET REVENUE CONSIDERATIONS
From an accounting perspective, whenever revenue is received, it will be recognised and analysed as gross revenue, net revenue and net income. Gross revenue is the price charged before discounts and any applied reimbursements, whereas net revenue is the price after the sale has been concluded. Net income, also known as net profit, is the contribution after total costs have been deducted from the net revenue.
Why is this important? In the first instance, net versus gross revenue provides an insight into the number of discounts being granted and a view on sales efficiency, including any potential VSOE issues. Net income assists in the analysis of operational and delivery efficiency.
The training department has many costs to consider and educating the sales team on how negotiating activities can influence the profit line can lead to a more aligned approach to revenue generation.
Primarily the approach that sales should consider is:
- acquiring new customers by selling the right training for the right need (fitness for purpose);
- increasing the transaction amount by minimising discounts;
- developing trusted customer relationships to encourage adoption of additional modalities in line with longer-term training needs.
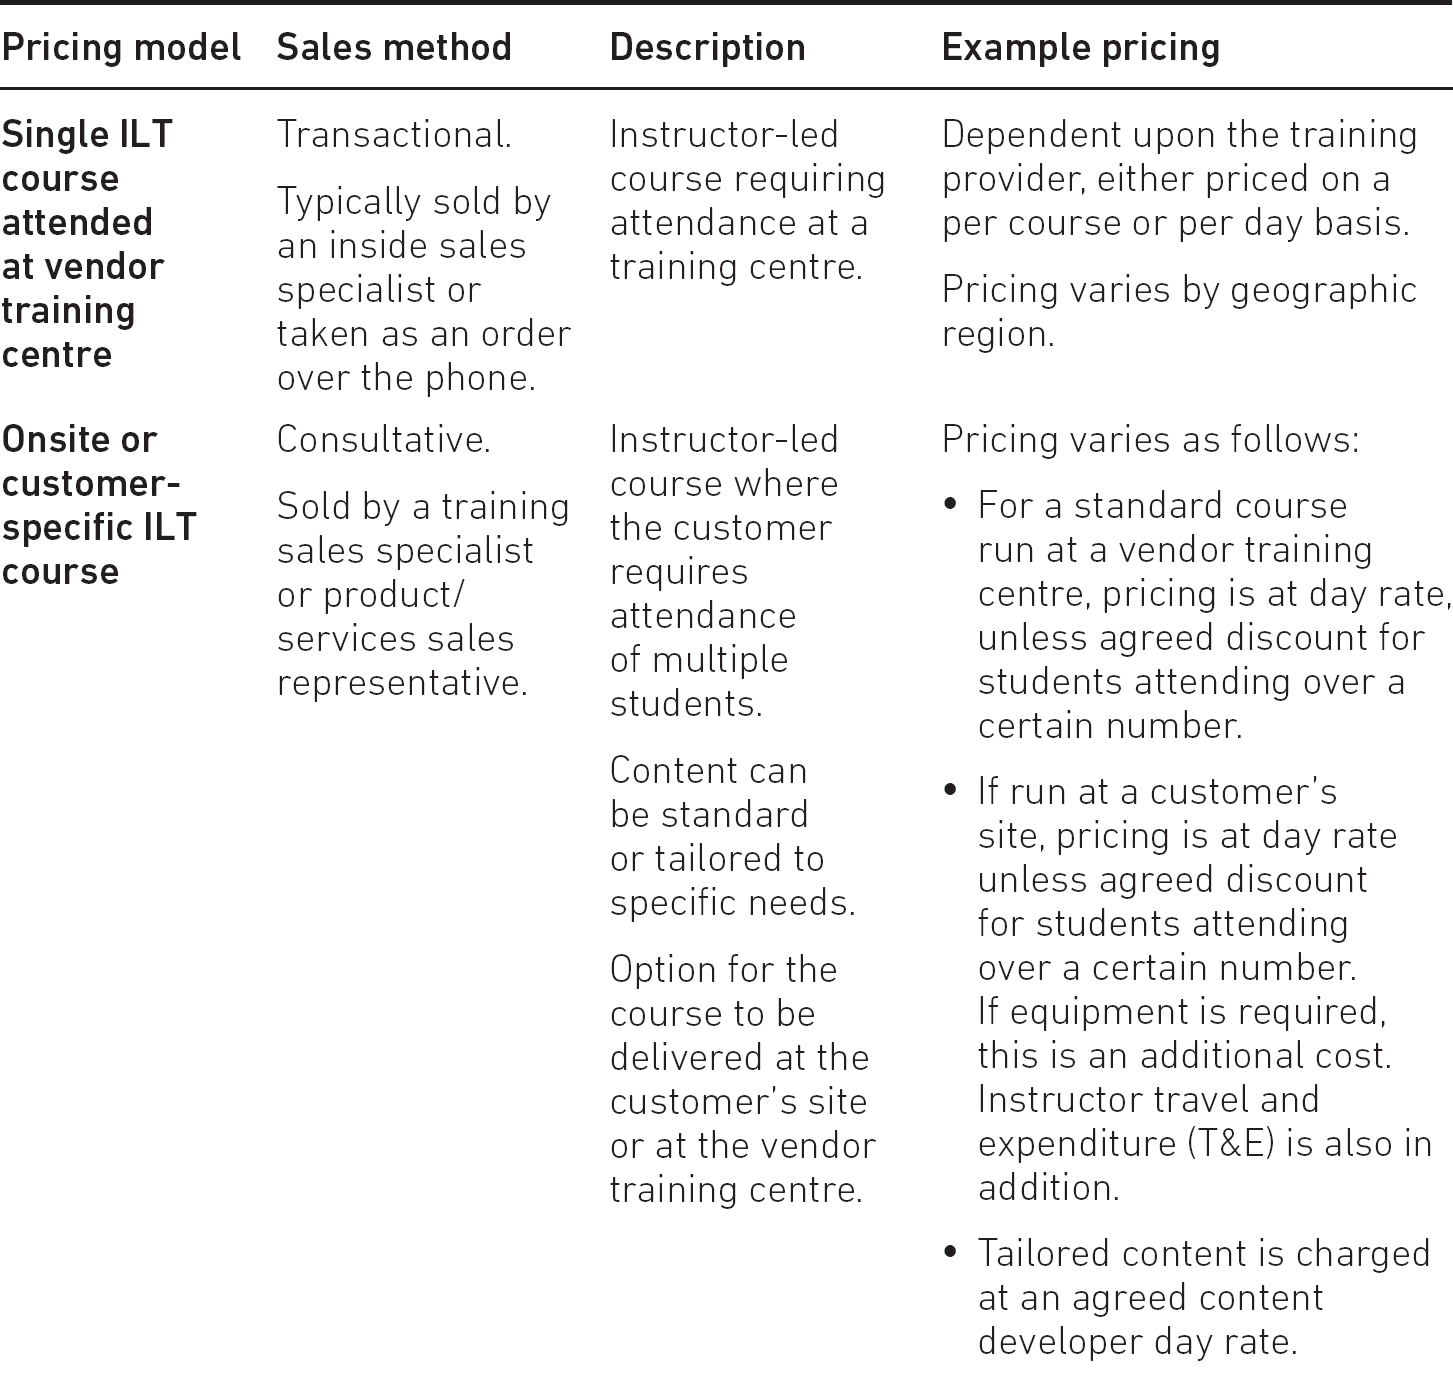
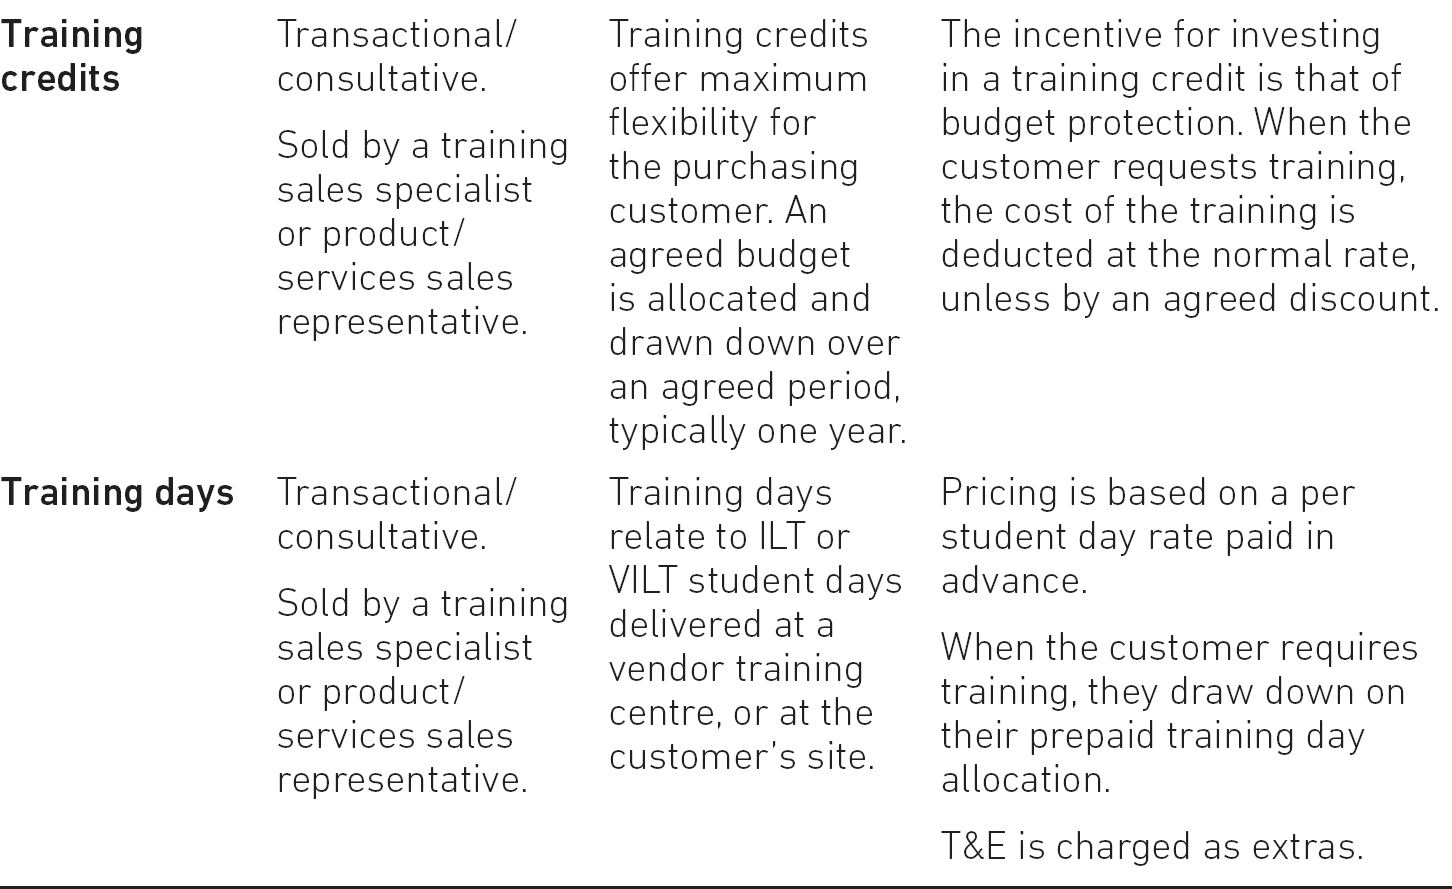
There are pricing models and pricing strategies. Chapter 3 compared typical strategies that can be adopted by a training group. In this section, the focus will be on pricing models that are specific to the selling of training. Table 6.1 summarises those that can be used to sell direct to customers.


CHANNEL-RELATED ROYALTY, KIT SALES AND REVENUE SHARE
Revenue income and growth is achievable from several sources, including direct and indirect sales activities. Direct sales activities result from training being sold and delivered by the training organisation, whereas indirect is sold and delivered through partners.
Indirect revenue income can be royalty, kit sales or revenue share-based, depending upon the business model in force at the time. Some training organisations will focus on one, and others on a combination of all three. The decision comes down to the question of how important training is to the vendor, when compared to cost allocation, and other areas of the business that may generate greater income. In some instances, greater coverage can be achieved by using channel partners and trading revenue for higher percentage-based profitability.
Royalty-based income
Royalty-based income is derived from training delivery partners who sell direct to their customer base. They have prior access to training content and print copies for consumption by the students who attend their courses. The partner then reports the number of course places delivered and pays an agreed royalty amount, normally monthly.
The advantage to the training vendor is that the royalty payment is pure revenue with zero cost, and hence maximised profitability. Another advantage is that no upfront investment is required in supporting emerging markets and countries with low training opportunities; local training partners provide the required coverage.
Offering partners a royalty option does not restrict their entry into the market. A slight disadvantage is the requirement for close and trusted monitoring. When market conditions start to show consistent growth, other pricing models may need to be considered.
Kit sales
Kit sales is different from royalty income, whereby the training partner purchases the training content (kit) upfront based on the number of course places sold. This model provides an increased level of vendor income with high profit level contribution. Many leading training partners prefer this model as it maximises their profitability. It also removes responsibility for printing and provides access to vendor branded materials. Typical kit costs purchased from the vendor represent 15–18 per cent of the student course fee.
For the training vendor, it minimises cost of entry into both low- and high-volume markets, especially those with local language needs. For example, if operating in Europe, it is expensive to hire instructors, establish dedicated training centres and ensure access is available across multiple locations. It also reduces the costs associated with providing technical training infrastructure and local operational and administrative support.
Revenue share
Revenue share becomes important when a vendor requires the training group to maximise revenue and minimise investment costs. It is similar to that of the kit model. The training partner purchases the kit and can gain an added advantage if the training group elects to sell into their schedule. The difference is the cost of the kit, which is based on a percentage of the overall course price being charged. Typically, a vendor charges 35–45 per cent of the sale price, plus an additional 15 per cent if they sell a place on the course.
It can be difficult to position and gain agreement with a training partner on these terms. However, it does provide access to the market with minimal competition. It is advantageous to those training partners who have authorised status with other vendors and market opportunities with medium to large customers.
Whether a training group adopts one or all of the above models depends on a variety of factors, including entry costs into new markets, ability to scale its operation to cater for growth, or alignment with the commercial contribution needs of the vendor.
All three modes require coordination between training product management and the business development team to ensure expectation alignment.
GEOGRAPHIC PRICING AND CURRENCY IMPLICATIONS
When operating on a multinational basis, pricing structures are required to reflect market variations in terms of geographical training demand, cost of doing business and the gross domestic product (at purchasing power parity) per capita, known as GDP (PPP). All of these have an effect on pricing and profitability, making it difficult to achieve the same level across all countries that the training group covers.
GDP (PPP) is the primary factor that needs consideration as it reflects the economic performance of a country and provides a basis by which to make international comparisons. It is useful as it factors in cost of living and inflation rates. By using the GDP (PPP) factor for the country of the parent company, pricing for all other countries can be based in relation to it. For example:
Parent company based in USA with a GDP of $57,300 might price a technical course at $1,000 per day. For the countries where it provides training, the price is modified to reflect the actual purchasing power:
- UK: the GDP is $42,500, resulting in a purchasing power price of $740 per day (42,500/57,300 = 74% of US day rate).
- Germany: the GDP is $48,200, resulting in a purchasing power price of $840 per day.
- South Africa: the GDP is $13,200, resulting on a purchasing power price of $230 per day.
Clearly, advice should be sought from the finance and legal departments to ensure local law and trading rules are being applied correctly before implementation.
This would be further modified in terms of factoring in local costs and expected training volumes and applying the normal marketing pricing analysis to come to an agreed pricing framework for the countries of operation.
Currency fluctuations impact all companies who have an international profile. For most training groups, the company will fix an agreed set of annual rates to provide a way of tracking business progress in a fair and consistent manner. This means the training group is neither penalised nor rewarded for currency variation.
At the company level, the finance team looks at implementing a number of options to assess and address the impact of currency fluctuations on the overall business. Some typical options are:
- Monitoring changes and keeping a watching brief if they are not particularly vulnerable to high-risk exchange rate fluctuations.
- Negotiating a fixed exchange rate for an agreed period.
- Managing currency exposure through business practices; for example, building flexibility into contracts by establishing clauses to protect against currency changes, or setting up contracts in local currency.
MAXIMISING AND PROTECTING REVENUE
From a sales perspective, maintaining good customer records and relationships is vital, as is understanding the routes to market within the organisation. For example, customer support representatives deal with technical problems that may be disguising a training need, or product sales engineers may be spending time educating customers on the benefits of the technology when perhaps positioning training may enhance the customer experience, leading to a broader solution opportunity.
With the sales management emphasis often being placed on quarterly revenue attainment, it is often the case that sales representatives will move towards high-volume transactional selling and minimise the consultative technique, thereby losing out on the opportunity to develop stronger customer relationships and ongoing revenue streams.
The key to maximising and protecting revenue is to establish a best practice approach within the training sales and training group communities that encompasses both sales activity and its management. The following points are worth considering to aid in the establishment of an effective sales process.
- Assist in maintaining the sales pipeline.
- Prospecting for new business on a regular basis is vital. The training team, be it administrators, instructors or marketing staff, have access and insight into opportunities the sales team may not be aware of. By establishing a regular update meeting, all prospects can be fed into the pipeline to ensure it is continually being topped up. Doing this helps to address any peaks and troughs that may occur in sales activity.
- Instructors in particular can be a very effective lead generation and sales channel. Students (customers) often share their problems with them and seek advice. By engaging instructors in regular update meetings and encouraging them to share information, additional sales opportunities can be found. However, it is worth implementing some form of reward programme to ensure they get recognition, otherwise they may not be so inclined to share new opportunities when the sales team get the benefit and not them.
- Ensure the sales team is dealing directly with actual decision makers. Often, significant time is lost with a customer by talking to the wrong person.
- Ensure that selling training is not a one-time activity. It should involve others within the training team. A good customer experience is one that all members of staff can contribute to. Sales does open doors, but keeping them open requires support from all, and a robust customer care programme. Keeping the training group’s name in the customer’s mind assists in maintaining a positive, ongoing relationship.
- When implementing a customer care programme, consider incorporating the following:
- Market research to understand customers’ needs and requirements.
- Capturing customer information (including instructor and administrator feedback) and insights to assist in the development of ongoing business relationships.
- Regularly assessing and looking for opportunities to sell additional training offerings.
- Providing good levels of service and value throughout all customer contact points.
- Obtaining and documenting testimonials, recommendations and referrals.
- Consider establishing a customer reward and incentive programme.
And finally, always credit-check target customers to protect revenue. A customer is not a customer if they default on payment!
Customer retention is crucial to the health of any business, regardless of size or industry. Within the technology sector the main focus will be on retention with respect to the product and certain elements within professional services, for example technical support and consulting. Training renewals can be challenging because training is often seen as a single event rather than a recurring one.
To improve training potential and develop more opportunities after the initial sale, consideration should be given to implementing a renewal strategy factoring in:
- Use of an adoption dashboard.
- Understanding of what might affect a renewal (risks).
- Predictive analysis regarding the nature and type of support calls customers have been placing, and the relevance and suitability of offering advanced training or selected workshops and its effect on training revenue.
The use of an adoption dashboard provides insight into which customers are considering renewal. Typically, it provides data regarding the size of contract, number of users, technology complexity and level and nature of training undertaken previously. An extract of a typical dashboard is shown in Figure 6.1. The first pie chart shows the number of customers who are looking to renew their product licences. This provides an insight into the potential number of customers who could renew their training. The second pie chart displays the percentage of customers who have renewed, and the third chart displays the orders received in pounds sterling.
This type of information provides an insight into sales and marketing activities that need to be undertaken to maximise the renewal rate. More detailed and granulated charts are required in order to understand the nature of the renewal opportunity. For example, five customers may represent a revenue opportunity of £5,000 between them and two customers may represent revenue opportunities of £20,000 and £15,000 respectively. In this instance, different strategies and time allocation to obtain the renewal is required. The low revenue opportunities can be covered by email requests to renew, whereas the potentially high revenue opportunities require personal account management.
Factor into this what might prevent a customer from renewing, which could be:
- cost of training;
- net promoter score (NPS) reduction.

NPS is a management tool used to measure how an organisation is maintaining its customer relationships and loyalty. It is an alternative to traditional customer satisfaction research and has been widely adopted by Fortune 500 companies.1
Increase in support calls or complexity of the calls provides an insight into the prediction and analysis of how at risk the account is with respect to customer satisfaction issues and non-renewals.
Establishing an adoption dashboard will require the support of sales operations and feedback from the technical support team. The data should be readily at hand and standard in nature. The important message to instil in the minds of the sales renewal team and senior management is that a well-trained customer contributes to the overall benefits of the product, which in turn can assist in improved renewal rates and ultimately long-term retention of the customer.
Equally important is the establishment of an agreed process; for example:
- Ensure the adoption dashboard is kept up to date (quarterly).
- Check on the status of any unused prepaid training and address accordingly.
- Obtain customer status updates from:
- sales teams;
- customer success managers;
- professional services.
- Develop a value statement per renewing customer based on predicted analysis findings (in many instances this will be standard in nature).
- Set up notification alerts to advise on data points that have not been achieved, such as target bookings and order rate. The data points might trigger at 30 per cent, 70 per cent and 90 per cent of the required target. Shortfalls can then be addressed with an appropriate action plan at:
- six months;
- three months;
- one month.
- Work closely with the renewals team.
- Automatically attach relevant training offerings and supporting value statements to customer product related renewal prospects. Removal by the renewal or sales team would generate notifications, prompting internal discussion.
In a subscription-based environment, the renewal process needs very close monitoring as it can significantly affect recurring revenue streams.
Customer success management is growing in popularity, specifically in the technical arena. It encompasses several areas: technical support, professional services, training and sales. This requires a dedicated customer success manager to be in regular contact with existing customers to help them not just solve problems, but find new ways to use and apply the product, and for the customer success manager to gain feedback on how it can be improved for later development.
From the training perspective, the role is primarily about understanding the needs of the customer and using this to develop a shared vision, establish joint accountability, prioritise their long-term success and drive incremental and ongoing revenue streams. It is also about customer retention, which is where the training and technical support side of the role plays a key part in aligning provider and customer in a homogeneous manner. With continuous pressure from competitors, staying one step ahead is a key factor for continued success. For a technical training manager, alignment with the customer success management team is as vital as that of sales account management.
It is financially astute to assess which customers are crucial to overall company success and what type of attention to them is required. A decision can then be made on how many customer success training practitioners to allocate to support the company’s dedicated customer success managers, and how best to ensure the full alignment of corporate and customer need.
Training revenue income can be achieved from direct and indirect sales-based activities. On the direct side, this includes training sales, professional services and product sales teams. On the indirect side, it includes authorised training partners, channel partners and strategic alliances.
Both channels produce revenue, which has to be recognised and analysed as gross revenue, net revenue and net income from an accounting perspective. All three are important, although net versus gross revenue provides an insight into the number of discounts being granted and sales efficiency, including any potential VSOE issues.
The training department has many costs to consider, so educating the sales team on how their negotiating activities can influence the profit line will lead to a more aligned approach to revenue generation.
Pricing models for VILT, eLearning and customised offerings all affect the training revenue achieved and so need to be fully understood in terms of how to offer them in relation to market need and financial requirements.
Another factor affecting the generation of revenue is the go-to-market (GTM) activity, which can be direct or indirect. The direct side involves sales activities that maximise revenue attainment, whereas indirect revenue generation will be royalty, kit sales or revenue share-based, which dilutes the percentage of revenue received. The advantage, and hence trade-off, of using the indirect model is its ability to provide greater coverage, which satisfies market need, but reduces overall revenue income.
Other factors affecting revenue are geographic pricing and currency implications when a training group is operating on a multinational basis. The pricing structures required need to reflect market variations in terms of geographical training demand, cost of doing business and the gross domestic product implications.
In order to maximise and protect revenue, maintaining good customer records and relationships is vital, as is understanding the routes to market within the organisation. This can be achieved by establishing a best practice approach encompassing both sales activity and metric-based management. Implementing a renewals policy protects medium- to long-term revenue and can be further enhanced with the establishment of a customer success management programme.
1 The Fortune 500 is an annual list compiled and published by Fortune magazine that ranks 500 of the largest US corporations by total revenue and NPS for their respective fiscal years.