In the Introduction and Chapter 2 we discussed some of the challenges of notifications. The primary purpose of this chapter is to make notifications useful: to send them at the right time and put useful information in them.
Sending too many notifications is the monitoring equivalent of “the boy who cried wolf”. Recipients will become numb to notifications and tune them out. Crucial notifications are often buried in the flood of unimportant updates.
And even if an notification surfaces, it is not always useful. In Chapter 2 we saw a stock Nagios notification.
PROBLEM Host: server.example.com
Service: Disk Space

State is now: WARNING for 0d 0h 2m 4s (was: WARNING) after 3/3 checks

Notification sent at: Thu Aug 7th 03:36:42 UTC 2015 (notification number 1)

Additional info:
DISK WARNING - free space: /data 678912 MB (9% inode=99%)
This notification appears informative but it isn’t really. Is this a sudden increase? Or has this grown gradually? What’s the rate of expansion? For example, 9% disk space free on a 1Gb partition is different from 9% disk free on a 1Tb disk. Can we ignore or mute this notification or do we need to act now?
With this example in mind, we’re going to level up our notifications. We’re going to focus on three key objectives:
We’ll add appropriate context to notifications to make them immediately useful.
We’ll handle maintenance and downtime.
We’ll also do something useful with non-critical notifications that’ll help us identify patterns and trends.
10.1 Our current notifications
Up until now our notifications have largely consisted of sending emails and managing multiple notifications via throttling or roll ups inside Riemann itself. This isn’t a flexible approach. Additionally, our current email notifications are the default notifications we configured in Chapter 3. Let’s convert our existing notifications to be more of a framework with more context attached to our notifications and with the option to target a variety of destinations.
We’re going to get some of our additional context by making use of Riemann’s index. Remember in Chapter 3 we learned that events that are sent to the index are stored and indexed according to a map of their host and service. These events stay live inside the index until their TTL expires and then they spawn an expired event.
Using a Riemann function we query the index for events currently live inside it. We’re going to find any events we think might be related to an event which has generated a notification and then output those related events as part of the notification.
10.2 Updating expired event configuration
Since we’re also going to be using expired events, let’s revisit our expiration configuration in /etc/riemann/riemann.config.
We see that the event reaper runs across the index every five seconds, and that we copy the :host, :service, and :tags keys to our expired events. There are other fields that might be useful to us for our notifications so let’s copy those into the new expired event too.
Let’s expand the email function by adding some new formatting to our email notifications. To provide this additional formatting and context we’ll use the :subject and :body options of the mailer function. These allow us to specify a function that will format the incoming events any way we like. Let’s add some formatting now.
NoteYou can find the code for our new email notifications on GitHub. You’ll note in that code that the order of our functions inside the file is basically the reverse of how we’ve explored them here. In Clojure, the file is parsed from the top down. So we need to define a function before we use it. This can be worked around using the declare function.
We’ve added a requirement, clojure.string, which we’ve required as str. The clojure.string library has some useful functions that will allow us to manipulate and format strings to make our output look better.
We’ve also added two options to the mailer function.
These options take a function which accepts incoming events and then formats them for the subject line and body of our emails respectively. In our case we’ve created two new functions, format-subject and format-body, to do the formatting for us. Let’s look at each new function now starting with format-subject.
Our format-subject function has an argument of events for the incoming events. It then uses the apply and format functions to create a subject line. We have to use the apply function and map on the various fields because the mailer function assumes the events argument is a sequence of events rather than a single event.
This subject line is service-centric. If we want to craft subject lines for other circumstances then we could update the format-subject function to accommodate this. We could select formatting for events with specific tags or the contents of specific fields.
The next function, format-body, is a bit more complex and has some supporting variables and functions. It’s also in this function that we’re going to add our extra context by searching the Riemann index for related or useful events and outputting them with our notification.
TipThe t and n symbols represent tabs and new lines respectively.
There is a lot going on here so let’s break it down. The format-body function takes a sequence of events as an argument and then outputs some string content for each event. It wraps the events argument inside a join with three new lines. We then map the events argument to produce a single event and pass that to a function that will construct our output.
Our function first uses the header variable. This is boilerplate header text provided by this variable.
We first use a function from the riemann.common namespace, time-at. The time-at function converts a Unix epoch timestamp into a more human, readable date. We’re using it to convert our event’s epoch time into something a bit easier to understand. For example, converting 1458385820 in the :time field of an event into: Sat Mar 19 18:59:48 UTC 2016.
Next we return the host, the name of the service, and the state of the service (taken from the :host, :service, and :state fields respectively). We also return the metric from the :metric field. We check if the :metric is a ratio. If it is, we coerce it into a double using the double function.
We then join any tags on the event into a list and return the :description of the event.
Next comes the most complex part of our formatting: adding useful context to the notification. We have a context function that looks up contextual events in the Riemann index.
The context function takes an argument of the event we’re notifying on. It then creates a string consisting of several pieces of contextual information about the host that generated the event, such as the percentage of system and user CPU usage. It gets this data by looking up events in the Riemann index using our lookup function. Let’s explore that now.
The lookup function takes two arguments: a host, which is derived from the event’s :host field, and a service, which is the name of the service that contains the metric we want—for example, memory/percent-used for the memory used on the host. It uses the lookup function from riemann.index to search the index for an event matching the host/service pair we specify. It then returns this event to the context function.
TipIn addition to the riemann.index/lookup function, there’s also a riemann.index/search function that allows you to query multiple events. You can find an example here.
Inside the context function, we extract the :metric value from the new event we pulled from the index and put it into the round function.
The round function formats our metric to two decimal places.
We’ve also used another function: bytes-to-gb. In our context we show both the percentage used and the GBs used and free on the root mount. The bytes-to-gb function converts the bytes reported by collectd’s df plugin metrics into gigabytes.
Put together, this results in an email body something like:
Monitoring notification from Riemann!

Time:        Mon Dec 28 16:32:37 UTC 2015
Host:        graphitea
Service: rsyslogd
State:   critical
Metric:  0.0
Tags:        [notification, collectd]

Description:        Host graphitea, plugin processes (instance rsyslogd) type ps_count: Data source "processes" is currently 0.000000. That is below the failure threshold of 1.000000.

Host context:
  CPU Utilization:  16.84%
  Memory Used:      8.46%
  Disk(root):           32.02% used. (18.85GB used of 58.93GB)

This is an automated Riemann notification. Please do not reply.
TipWe could also create an HTML-based email as you can see in this blog post using template tools like Selmer. We could also use many of these concepts for non-email notifications.
10.4 Adding graphs to notifications
Just quoting a few metrics in the email will be insufficient context in a lot of cases. How about we directly link to the source data for a specific host in our notification? We can include a link to some of the graphs specifically relevant to a host using Grafana’s dashboard scripting capabilities.
A dashboard script is a JavaScript application that loads specific dashboards and graphs based on query arguments sent to Grafana. We can then browse via a specific URL. For example, there is a sample scripted dashboard in the scripted.js file, installed when we installed Grafana. View it by browsing to:
This scripted dashboard generates graphs that are customizable via query arguments passed to the URL. There are several examples available to review in the /usr/share/grafana/public/dashboards directory on the host on which we installed Grafana.
Let’s create a scripted dashboard of our own and then insert a link to it in our Riemann notifications. First, though, we need to create our own JavaScript application in the /usr/share/grafana/public/dashboards directory. We’ll do that now.
Our objective with this dashboard is to show a small number of critical status graphs that will give us an idea of the host’s health. We’re going to show graphs including:
CPU.
Memory.
Load.
Swap.
Disk usage.
We could easily add other graphs or create dashboards for specific applications or groups of hosts. Scripted dashboards are powerful, and there’s all sorts of ways to build them. We’ve built a sample dashboard application that shows one approach, but you can also refer to the example dashboards shipped with Grafana. We’ve included additional examples later in this chapter.
Our dashboard, contained in the riemann.js file, is a little large to show in its entirety here, but let’s step through the functionality. Broadly, there are four major sections of a Grafana scripted dashboard.
We’ll look at extracts from each component in the context of the larger application.
10.4.1 Defining our data source
Let’s start by looking at defining our data source. Our riemann.js dashboard will use the Graphite-API we installed in Chapter 4 to query our Graphite metrics directly. We’re going to define a variable to hold our Graphite connection, originally named graphite.
Here we’re connecting to our graphitea.example.com host on port 8888. This is where the Graphite-API is running. You can update this or template the file with a configuration management tool to insert the appropriate host name for your environment.
We’ll need to make a small change to our Graphite-API configuration file to allow connections directly to it. The Graphite-API relies on Cross-Origin Resource Sharing, or CORS, to ensure only the correct hosts connect to it. We can define approved hosts in the Graphite-API configuration. To do this we update the /etc/graphite-api.yaml configuration file on our Graphite hosts.
Note that we’ve added a new configuration directive, allowed_origins, to our configuration file. This directive allows us to list the hosts that are allowed to connect to the Graphite-API. We’ve specified our Grafana server, graphitea.example.com, running on port 3000. We’ll need to restart Graphite-API to enable this.
NoteWe don’t need to do this for Grafana’s own data source configuration because we proxied the connection in Chapter 4.
10.4.2 Defining our query parameters
Next we define query parameters. These are URL parameters that we’ll pass so we’re able to query specific hosts, time frames, or other attributes. Grafana will pass this query to Graphite to retrieve our metric data and render our graphs. We’ll define defaults for each parameter, too, so that our graphs will load, even without query parameters.
from — The age of the data to show, defaults to six hours.
host — The specific host to query, defaults to graphitea.
env — The environment to query, defaults to productiona.
stack — The stack, a normal host or a Docker container. Defaults to normal hosts.
The span and from are fairly self-explanatory. The host, env, and stack parameters help us construct the queries we’re going to run to retrieve our metric data from Graphite. They’ll also be used to decorate and configure our dashboard. Let’s look at an example.
To specify a host with a query parameter we’d browse to:
Grafana will pass the specific host, here riemanna, to riemann.js, which in turn will construct a query to return all the relevant metrics. We could specify a Docker container in a similar way by adding the stack parameter to our URL parameters.
This would specify a host of dockercontainer and update our query to search the docker metric namespace.
To run these queries, the riemann.js dashboard constructs a query for Graphite using our parameters and some defaults we’ve defined for our arguments. It uses two variables, prefix and arg_filter, for this.
The prefix variable contains the first part of our metric name. Remember, our Graphite metrics are constructed like so:
environment.stack.host.metric.value
The prefix variable constructs the environment.stack portion of that query using the arg_env and arg_stack arguments populated from our query parameters or defaults. We then combine this with the hostname, set via the arg_host variable. This forms the metric name that we wish to query, using the query function like this:
This query function uses the connection information we defined in the graphite variable plus a Graphite-API call to the /metrics/find/ API endpoint. The query variable would contain the metric name to search for, for example, productiona.hosts.graphitea.
This would return all metrics in this path—every metric underneath:
productiona.hosts.graphitea
We can then use these metrics to populate specific graphs.
10.4.3 Defining our graph panels and rows
We then define a series of functions to create rows of graphs and individual graph panels inside those rows. These are functions that feed the configuration for a row or a graph to Grafana to be rendered. Let’s look at the function for our memory graph.
Here we’ve defined a new graph with a series of attributes. The attributes correspond with the configuration options for a graph panel. The key attribute is targets, which are the specific metrics to display, here:
We construct the metric to display using a combination of Graphite functions, our query, and Grafana’s template capability. If we were to introspect these variables we’d get:
We first see the Graphite aliasByNode function, which we introduced in Chapter 6; it creates an alias from some element on the metric name. We combine that with the prefix variable we constructed earlier. We then see a Grafana template variable, [[host]]. This is populated inside our dashboard application from the arg_host option. When the graph is rendered, [[host]] will be replaced with the specific host we’re querying. Lastly, we see the tail end of our metric name, memory.used, which returns the percentage memory used on the host. We’re aliasing by the fourth element from a zero count in the metric name used.
We can then add our graph panel to a row. Remember, Grafana dashboards are made up of rows that can contain a series of different components. We define a new function for each row.
In this row we’ve defined three graph panels: panel_memory, which we’ve just seen, as well as panel_cpu and panel_loadavg, which you can look at in the book’s source code; the latter two define CPU and load graph panels respectively.
10.4.4 Rendering the dashboard
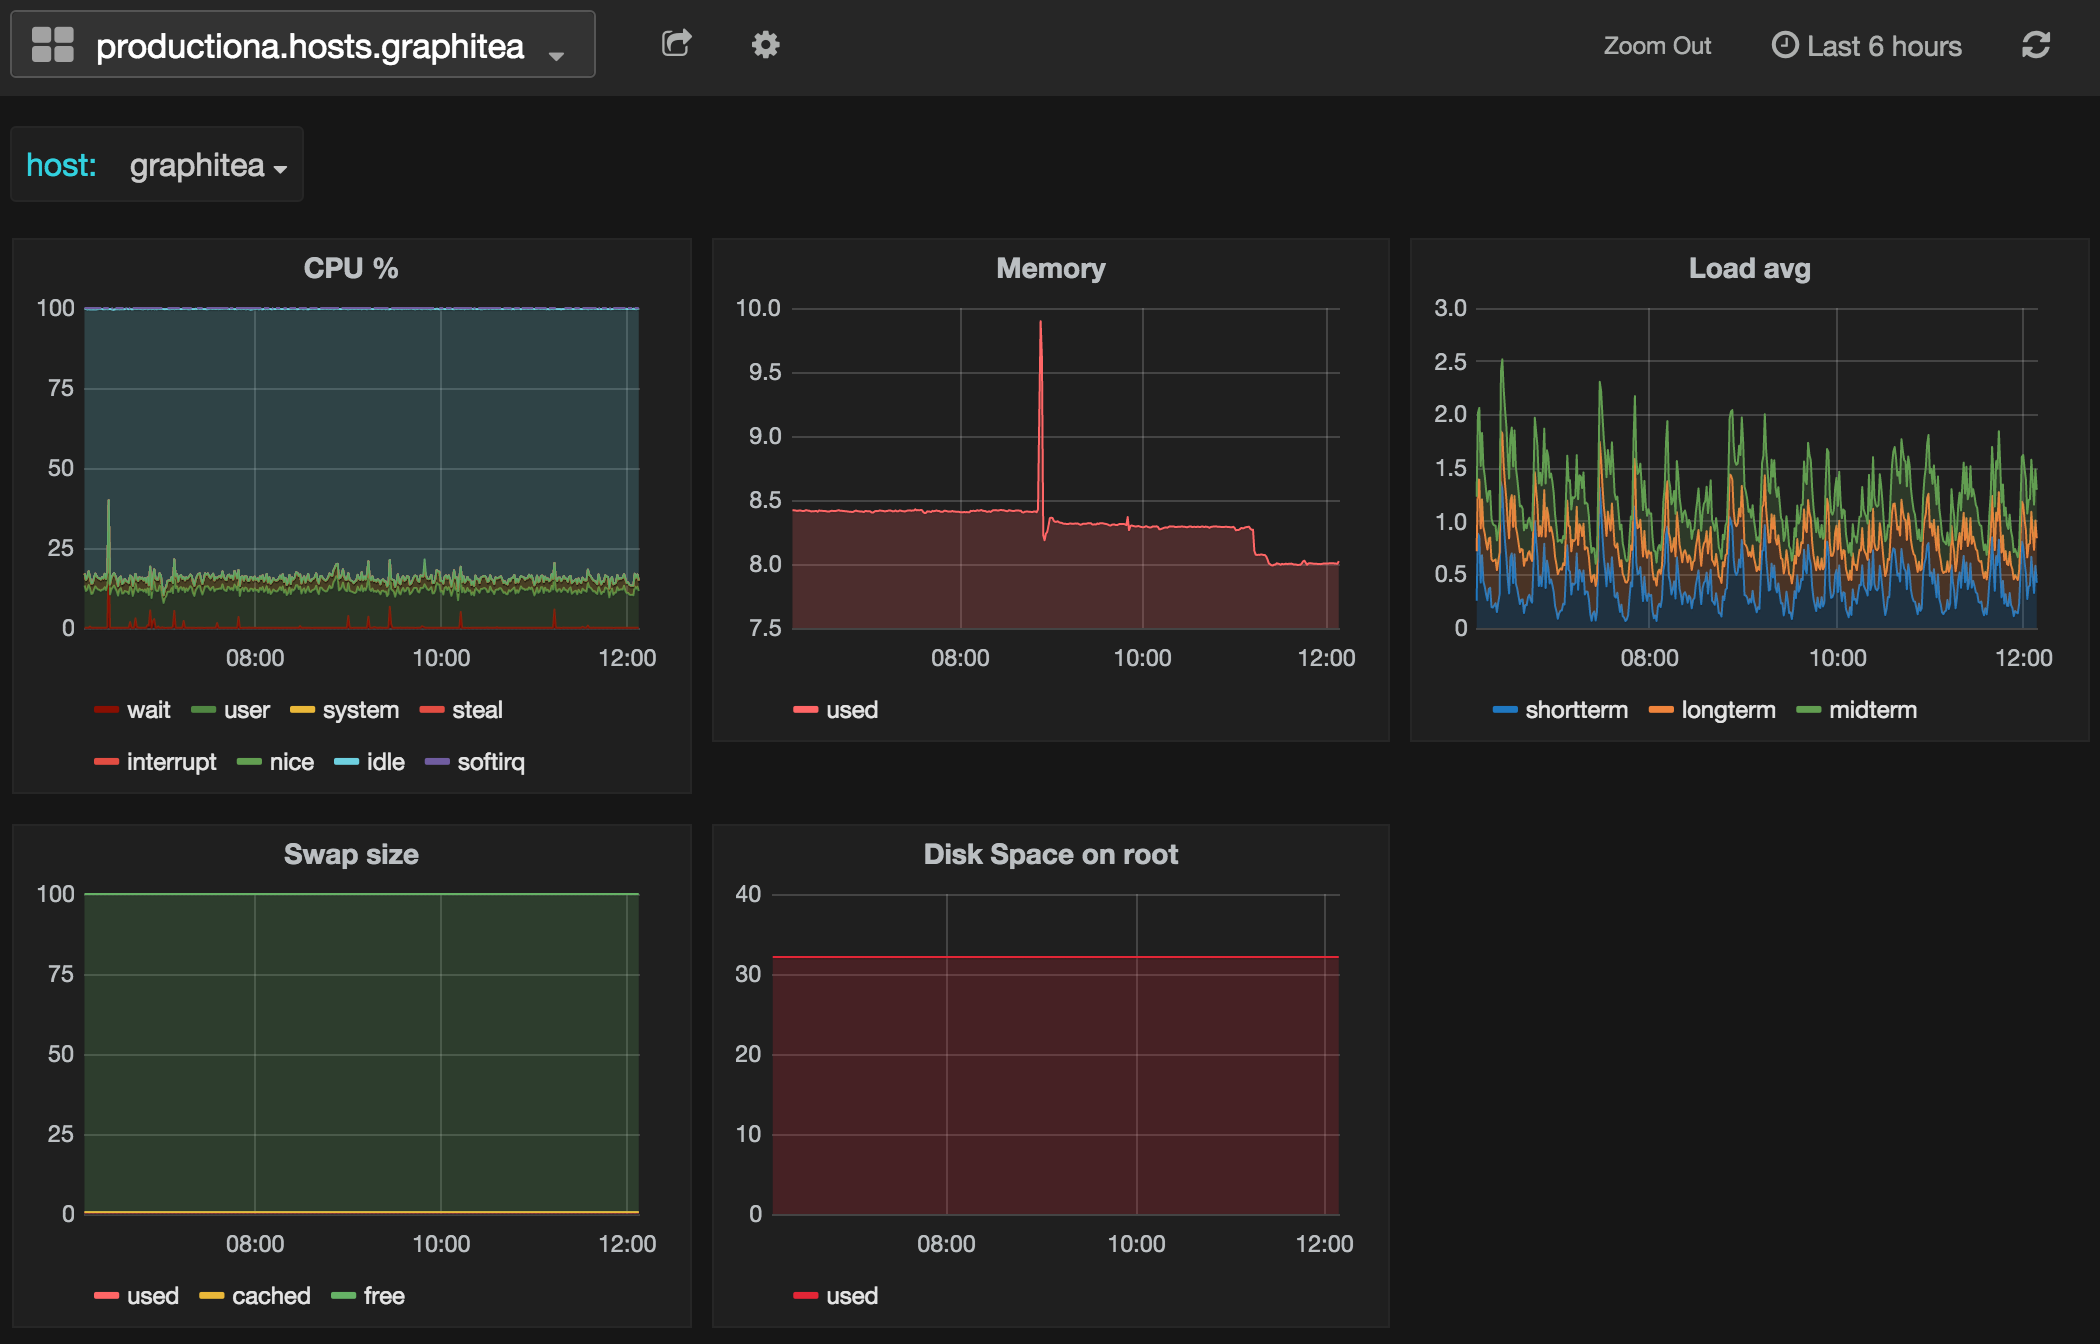
Lastly, our application contains a callback function that defines some attributes, like our [[host]] template variable, the dashboard title, and other items, and then renders the dashboard. If we run the default scripted dashboard, we’ll see something like this:
Our scripted dashboard
We see two rows of graphs, each containing the five types of data we defined in our graph panels. Now how do we add this to our notification?
NoteOur scripted dashboard was modified from an example created by Bimlendu Mishra.
10.4.5 Adding our dashboard to the Riemann notification
We’ve already got our context function in our email.clj file. Let’s extend this slightly to add a link to our dashboard.
This will add a URL for our scripted dashboard and insert the relevant hostname from the :host event field. When we get our notification now it’ll look like:
Monitoring notification from Riemann!

Time:       Wed Dec 30 17:22:56 UTC 2015
Host:       graphitea
Service:        rsyslogd
State:      critical
Metric:     0.0
Tags:       [notification, collectd]

Description:        Host graphitea, plugin processes (instance rsyslogd) type ps_count: Data source "processes" is currently 0.000000. That is below the failure threshold of 1.000000.

Host context:
  CPU Utilization:  16.27%
  Memory Used:  8.18%
  Disk(root):       32.13% used.

Grafana Dashboard:

  http://graphitea.example.com:3000/dashboard/script/riemann.js?host=graphitea

This is an automated Riemann notification. Please do not reply.
When we get our notification we can then click on the embedded link in the email and open up our dashboard to get some further context on the host with the issue.
10.4.6 Some sample scripted dashboards
To help you build different dashboards we’ve collected a few examples of scripted Grafana dashboards.
Decorating notifications with contextual configuration information about hosts and services. For example, pulling from a configuration management store like PuppetDB, from a distributed configuration tool like Zookeeper, or from a traditional CMDB.
Shell-out from Riemann to gather additional context. For example, if a notification was a disk space notification, then your first step on that host would typically be to run the df -h command. You could have Riemann run that command on the impacted host via a tool like MCollective, PSSH, or Fabric, and add the resulting output to the notification.
TipOf interest in this domain is Nagios Herald which aims to decorate Nagios notifications. It provides some excellent examples and ideas for adding appropriate context to notifications.
10.5 Adding Slack as a destination
Even though we’ve improved our email notifications, only having a single type of notification is a little limiting. Let’s add another type of notification to Riemann: Slack notifications. Slack is a SaaS-based team communication service with the concept of channels and private messages. Notifications to services like Slack, where you are notifying a channel or room of recipients, can be useful for sharing quick real-time notifications of situations that require “in the moment” reactions.
TipThis is just an example of adding chat notifications to Riemann. You aren’t limited to using Slack—Riemann comes with plugins for other services like Campfire and Hipchat—but you can learn how to use Slack through their documentation.
We’re going to start by creating a new function to send notifications to Slack. Let’s create this function now in a new file, slack.clj, to be included in our Riemann configuration.
TipWe could also connect to other services like Campfire or Hipchat.
Next we’ve used the def statement to define a var called credentials that contains our Slack security credentials. To connect to Slack we need the name of our Slack organization, here examplecom, and a token. The Slack connection uses Incoming Webhooks to receive Riemann notifications. To use it, we’ve defined a Slack Incoming Webhook for our Riemann monitoring notifications.
Our function constructs a message to be sent. It takes an argument of a standard Riemann event. It then uses the str function, which turns everything after it into a string. In this string we extract the values of the :service, :host, and :state fields from the event to create a notification like:
Service rsyslog on host graphitea is in state critical.
See http://graphitea.example.com:3000/dashboard/script/riemann.js?host=graphitea
We’ll see how to apply this function shortly.
Lastly, we’ve defined another function called slacker that will actually send events to our Slack instance. The slacker function has an argument construction we’ve not seen before.
Here we’ve specified what looks like an optional argument for the function, represented by the &, but is instead a default argument. We use the :keys and :or options to specify an argument of recipient, which will be the Slack room to which we send our notification. The default for this is #monitoring. We’re saying to Clojure: run this function with whatever argument we specify for recipient or default, using #monitoring as the recipient room.
Our function then calls the slack plugin, passes in the required credentials variable, and configures the details of our notification. We can configure a variety of options, in addition to the recipient, including:
The :username of the bot that’ll announce the Riemann events.
The :formatter option is useful and allows us to structure the actual message our Slack channel receives. This is much like the formatting we’ve done for email subjects and bodies. In this case we’ve passed our slack-format function to the formatter :text option with a variable of e, which is shorthand for the event. The :text option formats the Slack message itself. We can also add attachments or more complex formatting to the message, as you can see in the Slack plugin source code.
Let’s add a final type of notification using a service called PagerDuty. PagerDuty is a commercial notification platform. It allows you to create users, teams, and on-call schedules and escalations. You can then send notifications to the platform that can be routed to those teams via a variety of mechanisms: email, SMS, or even via a voice call.
We’re choosing PagerDuty as it’s a good example of these types of services. If PagerDuty isn’t a fit for you, there are several other commercial alternatives supported in Riemann including VictorOps and OpsGenie.
Let’s start by creating a new function to send notifications to PagerDuty. We add our new function to a file, pagerduty.clj, in the /etc/riemann/examplecom/etc/ directory, to be included in our Riemann configuration.
In our pagerduty.clj file, we first add a namespace, examplecom.etc.pagerduty, and require the riemann.pagerduty library.
We then define a function called pd-format. This function formats our PagerDuty message. We don’t need to specify a function for this, there’s a default format, but we want to customize our message a bit. The function takes the event as a parameter and needs to return a map containing:
The incident_key — PagerDuty’s incident key identifies a specific incident. We use the host and service pairing.
The description — A short description of the problem.
The details — The full event.
It’s here in this function that we can tweak our PagerDuty format. In our case we’ve only made one change.
We’ve used the assoc function to add a new entry to our event map. The new entry is called :graphs and contains the URL to our scripted Grafana dashboard. If we wished, we could also use something like our context function from our email notifications to add context to our PagerDuty notifications.
We next define a var called pd which configures the pagerduty plugin. It has two arguments: our PagerDuty service key, here represented by the fake key ABC123ABC, and the name of our formatter function, pd-format. To create a service key, add an API service to PagerDuty and select a type of Riemann. Then take the resulting service key and add it to your Riemann configuration.
We also define a function called page to execute our adapter. Inside our page function we’ve used the changed-state var we introduced in Chapter 6. This detects changes in the value of the :state field of an event. It also implies a by stream that splits events on the :host and :service fields, generating an event for every host and service pair.
We’ve specified an initial state assumption of ok. The initial state allows us to start from a known state when Riemann first sees a service. With this configuration Riemann assumes that a new service it sees with a :state of ok is in its normal state, and to not take any action.
Inside the pagerduty adapter there are three actions we can take with an incoming event. These actions relate to PagerDuty’s incident management process.
:trigger — Trigger an incident.
:acknowledge — Acknowledge an incident exists but don’t resolve it.
:resolve — Resolve an incident.
In our case, we want any event with a :state of ok to resolve an incident. We also want any event whose :state is not ok to trigger an incident. We’ve done this with a where stream matching the :state field of the event.
NoteWe haven’t used the :acknowledge action at all.
We then use our page destination in a notification.
We first need to require the Pagerduty function in examplecom.etc.pagerduty.
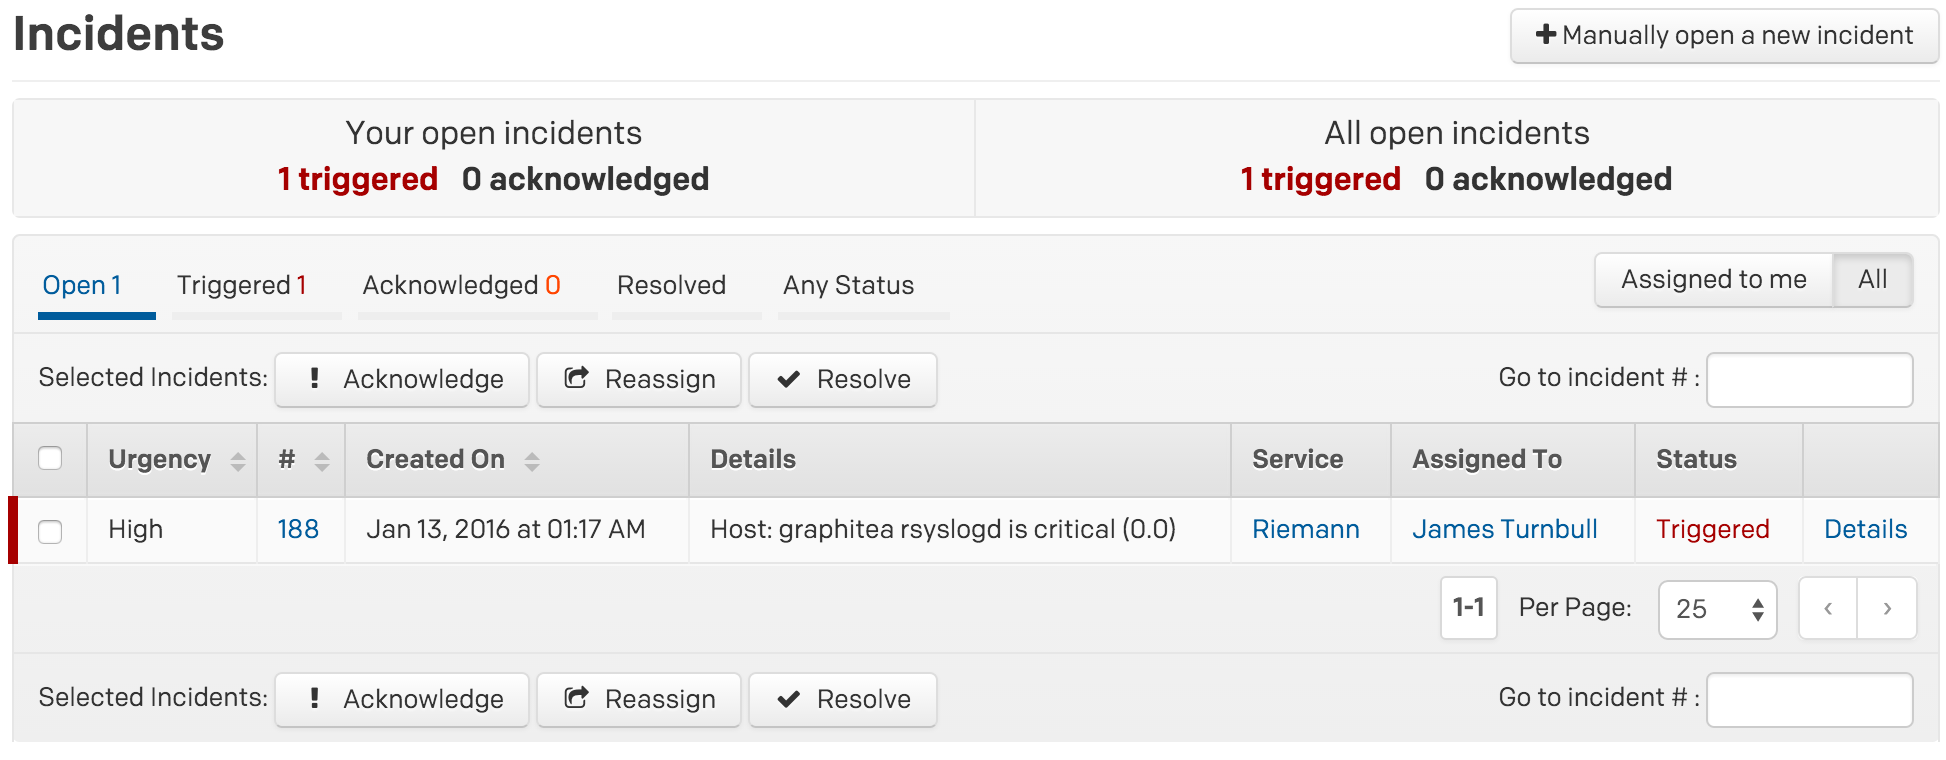
Here we’ve used our page function in our notification tagged events to trigger or resolve PagerDuty incidents. If a process failure is detected then a PagerDuty incident will be triggered.
A PagerDuty incident
Alternatively, if the monitored process recovers, then the notification will be resolved.
10.7 Maintenance and downtime
One of the other aspects of notifications we should consider is when not to send them. On many occasions you don’t want notifications to trigger because you’re performing maintenance on a host or service. In these cases you know a service might fail or be deliberately stopped—you don’t need a notification to be sent.
With Riemann we solve this by injecting maintenance events. A maintenance event is a normal Riemann event that we identify by host, service, or a specific tag. The event will have an infinite TTL or time to live. If we want to start a maintenance window we send Riemann one of these maintenance events with a :state of active. If we want to end the maintenance window we send another event with a :state of anything but active.
To check for maintenance events we’re going to build a check that will execute before notifications. The check will search the Riemann index for any maintenance events. If it finds an event that matches the host and service that triggered the notification then it will check the event’s :state. For any events that have a :state of active it will abort the notification.
Let’s start with the function that will perform that check. We’re going to create a new file:
We create a namespace: examplecom.etc.maintenance and required the riemann.streams library to provide access to Riemann’s streams.
This new function, called maintenance-mode?, takes a single argument: an event. It then uses a macro, ->>. The ->> macro rearranges the series of expressions, reversing the order and running through the forms. You can think about this expression as being:
This series of expressions means: “If the :state field of the first event returned by a search in the index is active, has a matching host and service, and a custom field of :type with a value of maintenance-mode.”
The index search is being done using the riemann.index/search function we discussed earlier in the chapter.
We then wrap our notifications with the new function.
Let’s schedule some maintenance. We can do this a number of different ways, such as by manually submitting an event using one of the Riemann clients like that Riemann Ruby client. We’ll install the Ruby client now.
We require the riemann/client and then create a client that connects to our Riemann server. We then send a manual event with a :service of nginx for the relevant host, tornado-web1, and with a custom field of :type set to a value of maintenance-mode. The :state field will be set to active and the TTL of the event is forever. If a notification were to now trigger on the tornado-web1 host, then Riemann would detect the active maintenance event and not send the notification.
If the maintenance window was over we could disable it like so:
Using the Riemann client directly is a little clumsy so we’ve actually written a tool to help automate this process. It’s a Ruby gem called maintainer. It can be installed via the gem command.
This will generate a maintenance event for the current host (or you can specify a specific host with the --event-host flag). The event will look something like:
We can then wrap this binary inside a configuration management tool or a Cron job or whatever else triggers our maintenance windows.
10.8 Learning from your notifications
We’ve done our best to uplift the quality of our notifications in this chapter. We’ve also created a fairly small collection of checks through the book. In the next chapters we’ll put all of this together and you’ll see what the volume of checks and notifications might be for an application stack, and hence be able to extrapolate an overall volume for your environment.
With the full set of checks and notifications in your environment you’re likely to find that notifications generally fall into two categories:
Notifications that are useful and that you need to action.
Notifications that you delete.
This is also an evolutionary process rather than an immediate one. A notification that was useful one day may become an “oh, that again … delete” notification a month later. Other times a notification is for a host, service, or application that is no longer important or mission critical but still exists. Or, more insidious, a notification is for a component or aspect of a host, service, or application that is still important but doesn’t rise to the level of immediate action. These are the sort of notifications we tend to address by placing a ticket in a backlog or putting them aside for a rainy day when we might have time to take a look.
There are several approaches we can take to these notifications. There’s the obvious: deletion. We could also turn off notifications for these hosts, services, or applications. We could even let them pile up. Most of us have had, on occasion, a mail filtering rule that places spurious notifications from monitoring tools into a specific folder.
The approach we’re going to take, though, is to make a rule that any notification we don’t action we count. We then use these spurious notifications to detect trends and highlight potential issues in our applications and infrastructure.
To do this we’re going to create a new function called count-notifications. Let’s create a file to hold our new counting function.
We have created a namespace examplecom.etc.count-notifications and required the Riemann streams. You can see we’ve defined a new function: count-notifications. It doesn’t have any arguments, except any child streams passed to it (we’re going to graph our notification rate as you’ll see shortly). We first adjust any :service field passed to our function to suffix .alert_rate to the end of the service. We also use the tag var to add a tag, notification-rate, to our :tags field. This will make it easier for us to work with our new event.
Next, we use the rate var to calculate a rate from our event. The rate var takes the sum of the :metric over a specified interval, here 5 seconds, and divides by the interval size. This calculates a rate that’s emitted as an event every interval seconds. The rate starts as soon as an event is received, and stops when the most recent event expires.
So, in our case, we sum the :metric over five seconds, divide by five to calculate the rate, and then emit an event with the :service name suffixed by .rate every five seconds.
Let’s see how we might use our new function. Let’s say we have a check like so:
This check uses the by stream to split events by :host and then checks the memory/percent-used metric from collectd. It notifies via email if the memory usage metric exceeds 80%. Let’s say we get a lot of these notifications and they sit un-actioned in an email folder. Rather than deleting the check or suppressing the notification, we update it to use our new count-notifications function. Here’s our updated check.
Note we’ve replaced the email function with count-notifications and directed the output into a child stream, (smap rewrite-service graph), which will write our new event to Graphite. Now when a notification is triggered we’ll see a new metric being created. For example, for the graphitea host and taking the rewrite rules we established in Chapter 6 into consideration:
This would be the rate of notifications over the five-second interval. We then use this rate, either in a graph or by creating another check that monitors a rate threshold. Let’s see how we might do this:
We pretty much see our previous memory usage check with one addition: the reinject var. The reinject var sends events back into the Riemann core. Reinjected events flow through all top-level streams, as if they’ve just arrived from the network.
We see below our check that we’ve created another check. This one uses the tagged stream to select any events, including our reinjected events, with a tag of notification-rate. We then use a by stream to split our events by the :service field and a where stream to match any event with a :metric value equal to or higher than 100. This would match any service with a notification rate of 100 notifications in five seconds, almost certainly signaling some kind of issue.
Next, we use the with stream to create a new copy of our event with new values for certain fields. Here we change the :state field to a value of warning and add a :description field of Notification count warning. The new event is then emailed to [email protected]. Our event would end up something like this:
Monitoring notification from Riemann!

Time:            Wed Jan 06 01:05:12 UTC 2016
Host:            graphiteb
Service:       memory/percent-used.alert_rate
State:         warning
Metric:        100.986363814988014
Tags:            [notification-rate, collectd]

Description: Notification count warning

Host context:
  CPU Utilization:  78.50%
  Memory Used:      88.31%
  Disk(root):           78.49% used.

Grafana Dashboard:

  http://graphitea.example.com:3000/dashboard/script/riemann.js?host=graphiteb

This is an automated Riemann notification. Please do not reply.
Now we get an notification when the rate of notifications themselves is abnormal or exceeds a specified threshold.
TipAlso of interest in this arena is OpsWeekly. It’s a tool written by the Etsy team that acts as a living life-cycle-reporting and State of the Union view of your operational environment.
Prometheus Alertmanager - Part of the Prometheus monitoring framework. Can be used as a standalone alert manager.
10.10 Summary
In this chapter we’ve extended our email notifications to provide additional context and information. We’ve used data from the Riemann index to give the reader of a notification some idea of the current state of the environment around that host or service. We’ve also added the ability to reference external data from a variety of sources, such as by presenting a custom dashboard for a host or service.
In addition, we’ve added new destinations that are useful for different types of notifications. Notifications to destinations like Slack can be useful for sharing quick real-time notifications of situations that require “in the moment” reactions. We can also make use of commercial notification services like PagerDuty, whose ability to manage teams of users, on-call schedules, and escalations make it easier to manage accountability for notifications.
We’ve also added a method for handling maintenance and downtime on our hosts and services and proposed a method by which we can learn from alerts we don’t plan to action.
In the next chapter, we’re going to take all of the elements of our framework introduced in the book and demonstrate how we manage, measure, and notify on an entire application stack: from host to business metrics.