
13 Monitoring Tornado: Data tier
Our last tier, the Data tier, is made up of two servers, tornado-db running MySQL and tornado-redis running Redis. For Tornado’s Data tier, what do we care about? Let’s break down our concerns:
- That MySQL and Redis are running on their respective hosts.
- 99th-percentile latency adding items to the Tornado DB is three milliseconds or less.
- That maximum MySQL connections don’t exceed 80% of the available connections.
- That we can measure the rate of aborted connections to MySQL.
- That we are generating application metrics from data inside our MySQL database.
- That we can measure key queries to ensure they are performing within expectations.
We’ll start with configuring the monitoring for each component and the underlying database or data store, and then we’ll look at using the events and metrics generated by that monitoring to address those concerns.
13.1 Monitoring the Data tier MySQL server
Let’s start by monitoring our MySQL server. In our case we have a database called items running on our tornado-db host that we’d like to monitor. For MySQL monitoring the recommended approach is to look at the health and metrics of the MySQL server itself as well as the performance of application-specific queries. We’re going to start with monitoring the MySQL server itself.
In Chapter 11 we saw a community-contributed plugin for monitoring HAProxy. We’re going to use a similar plugin to monitor MySQL. In this case our new plugin is another Python-based plugin that we’ll execute using the collectd python plugin. It connects to our MySQL server and runs some useful commands, like: SHOW GLOBAL STATUS, SHOW_GLOBAL_VARIABLES, and SHOW PROCESSLIST. It then converts the results of these commands into events and feeds them into collectd.
Let’s start by installing a prerequisite package, the Python MySQL bindings. On Ubuntu this is the python-mysqldb package.
On Red Hat derivatives, this is the mysql-python package.
Next we need to grab our plugin. We’ll create a directory to hold it, /usr/lib/collectd/mysql, and then download the plugin into it.
$ mkdir /usr/lib/collectd/mysql
$ cd /usr/lib/collectd/mysql
$ wget https://raw.githubusercontent.com/turnbullpress/collectd-python-mysql/master/mysql.py
Here we’ve created the directory and changed into the /usr/lib/collectd/mysql directory (on Red Hat this would be the /usr/lib64/collectd/mysql directory). We’ve then downloaded the plugin from GitHub. You can take a look at its source. It defines a list of metrics and some configurable options.
Next we need to create a MySQL user through which the plugin can monitor our database. We do this using MySQL’s standard user and privilege system. Let’s create a user called collectd.
$ mysql -u root -p
Enter password: **********
mysql> CREATE USER 'collectd'@'localhost' IDENTIFIED BY 'strongpassword';
Query OK, 0 rows affected (0.00 sec)
mysql>  GRANT PROCESS,USAGE,SELECT ON *.* TO 'collectd'@'localhost';
Query OK, 0 rows affected (0.00 sec)
You can see we’ve used the mysql command to connect to our MySQL server. We’ve then created a new user, collectd, with a password of strongpassword. You should replace this with an appropriately strong password of your own. We’ve then granted the USAGE, PROCESS, and SELECT privileges to this new user. The USAGE level of privilege is the lowest level of MySQL access and just allows our user to interact with the target database. The PROCESS privilege allows us to view the state of the MySQL server processes. The SELECT permission will allow us to query specific databases for metrics, as we’ll see later in this chapter. We’ve granted the access across all MySQL databases on the host, *.*. In your environment you could easily limit this to a subset of databases, as required.
Next we create a configuration file for the mysql plugin. Let’s create it at: /etc/collectd.d/mysql.conf.
Now let’s populate it.
<LoadPlugin python>
    Globals true
</LoadPlugin>
<Plugin python>
    ModulePath "/usr/lib/collectd/mysql/"
</Plugin>

<Plugin python>
    Import mysql
    <Module mysql>
        Host "localhost"
        Port 3306
        User "collectd"
        Password "strongpassword"
    </Module>
</Plugin>

LoadPlugin processes
<Plugin "processes">
    Process "mysqld"
</Plugin>
We first load the python plugin and then turn on Globals, which provides ou plugin access to local Python libraries. We then use a <Plugin> block to tell collectd where to find the mysql plugin and how to load it. We specify the path to the plugin, and we use the Import command to import the specific plugin file, mysql. This is the name of the file that contains the Python code, dropping the .py extension.
Inside this block we then specify a <Module> block to configure the MySQL plugin itself. Inside this block we use the Host option to specify the database host, and Port to specify the port. We then specify the User and Password options for the username and password we just created and will use to connect to the MySQL server.
The plugin will connect to our database and run commands to return details of the database’s state. This shows performance, command, handler, query, thread, and traffic statistics for the specific server.
At the end of our configuration we’ve also loaded and configured the processes plugin to monitor the mysqld process to ensure we know when it’s available.
If we now restart collectd, the plugin will connect to MySQL, collect, and return our events to Riemann. Let’s look at an example event.
We see the event has a :service prefix of mysql-, the type of data it is—here InnoDB statistics—as well as the data class, a counter, and finally the name of the specific metric being recorded. Given this complexity, we’ll probably want to rewrite these events before they hit Graphite. To do this we again update our collectd rewrite rules inside the /etc/riemann/examplecom/etc/collectd.clj file.
(def default-services
  [{:service #"^load/load/(.*)$" :rewrite "load $1"}

. . .

   {:service #"^mysql-(.*)/(counter|gauge)-(.*)$" :rewrite "mysql $1 $3"}])
Here we’ve added a new rewrite line that will update our MySQL event’s :service field before it is written to Graphite, for example from:
mysql-innodb/counter-log_writes
To a simpler:
mysql.innodb.log_writes
We can now more easily use these metrics in graphs or checks.
13.1.1 Using MySQL data for metrics
In addition to the state of our MySQL server we’re going to use data inside our databases and tables as metrics. This allows us to expose application state and performance at multiple levels: inside our Web tier, inside the Application tier and our application itself, and inside the Data tier. To make use of our Tornado application data we’re going to use another collectd plugin: dbi. The dbi plugin connects to a database, runs queries to return data, and converts that data into a collectd metric.
dbi plugin with MySQL but it also supports a wide variety of other databases.
Let’s start with installing a prerequisite package that the dbi plugin needs, the libdbi bindings. On Ubuntu this is the libdbd-mysql package.
On Red Hat derivatives, this is the libdbi package.
Now let’s look at querying some data. Inside our MySQL database we’ve got the items database that is being populated by our Tornado API servers. We’re going to query that data to return some key metrics. To do this we create a configuration for the dbi plugin in our existing configuration file: /etc/collectd.d/mysql.conf.
LoadPlugin dbi
<Plugin dbi>
  <Query "get_item_count">
    Statement "SELECT COUNT(*) AS value FROM items;"
    MinVersion 50000
    <Result>
      Type "gauge"
      InstancePrefix "tornado_item_count"
      ValuesFrom "value"
    </Result>
  </Query>
. . .
  <Database "items">
    Driver "mysql"
    DriverOption "host" "localhost"
    DriverOption "username" "collectd"
    DriverOption "password" "collectd"
    DriverOption "dbname" "items"
    SelectDB "items"
    Query "get_item_count"
. . .
  </Database>
</Plugin>
We’ve added a LoadPlugin statement for our dbi plugin and then defined its configuration in a <Plugin> block. The dbi plugin is configured with two distinct blocks: queries and databases. Queries define the SQL statement and data we’d like to pull from our database. Databases configure connection details for each specific database and which queries apply to them.
We start with defining a query. Queries need to be defined before the database that will use them as the file is parsed top down. Each query consists of a <Statement>, the SQL statement we want to run. We’ve also specified the MinVersion directive, which specifies the minimum version of the server on which we’re running the statement. Here, if the database server we connect to is an older version than MySQL 5.0 then the query will not be run. Our statement will do a count of items in the items table, returning the count aliased to a name of value.
We then use the result returned from the statement in the <Result> block to construct our metric. We’ve used three directives: Type, InstancePrefix, and ValuesFrom. The Type directive controls what type of metric we’re constructing; in our case that’s a gauge. The InstancePrefix provides a prefix to our metric name; here we’re using tornado_item_count. Lastly, the ValuesFrom directive controls what value will be used as the metric value. In our statement we’ve aliased the count from the items table with an AS clause to value. The value variable will contain the total count of items, and we’re going to assign it to the ValuesFrom directive.
We’re also storing the price of each item we’re creating in the database. Let’s add another query to get that information and return a metric to track it.
 <Query "items_sold_total_price">
    Statement "SELECT SUM(price) AS total_price FROM items WHERE type = 'sold'"
    MinVersion 50000
    <Result>
      Type "gauge"
      InstancePrefix "items_sold_total_price"
      ValuesFrom "total_price"
    </Result>
  </Query>
Here we’re running a query that sums the total value of the price field and returns it as a new field called total_price. We’ve then created a new metric result with an InstancePrefix of items_sold_total_price; it will have a :metric value of the contents of the total_price field.
We’ve created a query to record the items bought as well, creating a metric called items_bought_total_cost that we haven’t shown here. See the complete file in the book’s source code for details.
We could create a variety of other metrics from this data: total price of items added per day, total price of items deleted per day, and others.
Our <Database> block is fairly self-explanatory. We define the host and port of our database server (ours is our local host) and the user and password we just created. Additionally, we specify the target database to which we want to connect. Lastly, we specify Query directives that tell the dbi plugin what queries to run on this database.
dbi plugin’s other configuration options in the collectd documentation.
If we then restart the collectd service on our tornado-db host we’ll start to see each of these queries executed and metrics being generated and sent to Riemann. Let’s examine these events inside Riemann.
Here we see an event from the dbi plugin with a :service of:
dbi-items/gauge-tornado_item_count
And :metric of 484621.0, representing the total count of items in the items database.
As we did with our MySQL metrics, we want to rewrite these events before they hit Graphite. To do this we again update our collectd rewrite rules inside the /etc/riemann/examplecom/etc/collectd.clj file.
(def default-services
  [{:service #"^load/load/(.*)$" :rewrite "load $1"}

. . .

   {:service #"^dbi-(.*)/(gauge|counter)-(.*)$" :rewrite "dbi $1 $3"}])
Here we’ve added a new rewrite line that will update our dbi event’s :service field before it is written to Graphite, for example from:
dbi-items/gauge-tornado_item_count
To a simpler:
dbi.items.tornado_item_count
We can now more easily use these metrics in graphs or checks.
13.1.2 Query timing
Lastly, when monitoring a database, understanding the execution time of your queries is critical. This can be done in a number of different ways in the MySQL world:
- Via parsing the slow query log — Useful but hard to parse and, at high volume, adds considerable overhead to your host.
- Via network monitoring — Complex to set up and requires building custom tools or using a third-party platform.
- Via the
performance_schemadatabase.
We’re going to use the last method because it allows us to leverage our existing dbi plugin implementation to retrieve statistics from the performance_schema database.
The performance_schema database is a mechanism for monitoring MySQL server execution at a low level. It was introduced in MySQL 5.5.3. The performance_schema database includes a set of tables that give information on how statements performed during execution. The tables we’re interested in contain current and historical data on statement execution. We’re going to extract information about the queries our Tornado API is running from this table: the events_statements_history_long table. The events_statements_history_long table was introduced in MySQL 5.6.3 and contains the last 10,000 statement events. This is the default that can be configured using the:
performance_schema_events_statements_history_long_size
But before we get started we need to determine if the performance_schema database is enabled by checking the status of the performance_schema variable. We sign in to the MySQL console using the mysql command.
$ mysql -p

. . .

mysql> SHOW VARIABLES LIKE 'performance_schema';
+--------------------+-------+
* Variable_name      Value
+--------------------+-------+
* performance_schema | ON
+--------------------+-------+
1 row in set (0.00 sec)
If the performance_schema variable is set to ON then it is enabled. If it’s OFF we can enable it in our MySQL configuration file. We’ll also enable some performance_schema consumers to record our statements.
[mysqld]
performance_schema=ON
performance-schema-consumer-events_statements_history=ON
performance-schema-consumer-events_statements_history_long=ON
We’ll need to restart MySQL to enable it. If you find the variable doesn’t exist, you may have an older version of MySQL that does not support the performance_schema database.
Now we’re going to add another query to our dbi plugin configuration to return the execution time of one of our key Tornado API queries, in this case the INSERT statement that adds an item to our database. Let’s do that now.
. . .

<Query "insert_query_time">
    Statement "SELECT MAX(thread_id), timer_wait/1000000000 AS exec_time_ms
  FROM events_statements_history_long
  WHERE digest_text = 'INSERT INTO `items` ( `title` , TEXT , `price` , `id` ) VALUES (...)';"
    MinVersion 50000
    <Result>
      Type "gauge"
      InstancePrefix "insert_query_time"
      ValuesFrom "exec_time_ms"
    </Result>
  </Query>

. . .

 <Database "performance_schema">
    Driver "mysql"
    DriverOption "host" "localhost"
    DriverOption "username" "collectd"
    DriverOption "password" "collectd"
    DriverOption "dbname" "performance_schema"
    Query "insert_query_time"
  </Database>
</Plugin>
Our new <Query> block defines a new query we’ve called insert_query_time. It contains a statement that queries the events_statements_history_long table. We pull all statements from that table that match our Tornado API INSERT statement.
We return the last thread that executed our query using the thread ID; this is the unique identifier of the instrumented thread. We then return the timer_wait field, which is the time the query took to execute in picoseconds. We’ve applied timer_wait/1000000000 to change those picoseconds into milliseconds as the field exec_time_ms. We then use this exec_time_ms field in the <Result> block as the value of our :metric field and to construct an event for Riemann. We specify another <Database> block to execute our new query.
If we then restart collectd we’ll be able to run this query and send a new metric to Riemann. Let’s look at an example of this event now.
Here we see our new event with a :service of:
dbi-performance_schema/gauge-insert_query_time
And a :metric value of 0.370724 milliseconds.
13.2 Monitoring the Data tier’s Redis server
The last service we wish to monitor is Redis. We use another collectd plugin to do this. The collect redis plugin connects to your Redis instances using the credis library and returns usage statistics.
To configure the redis plugin we need to add a configuration file with the connection details of our Redis instance. Let’s create /etc/collectd.d/redis.conf on our tornado-redis host now.
LoadPlugin redis
<Plugin redis>
  <Node "tornado-redis">
    Host "localhost"
    Port "6379"
    Timeout 2
    Password "strongpassword"
  </Node>
</Plugin>

LoadPlugin processes
<Plugin "processes">
    Process "redis-server"
</Plugin>
We first load the redis plugin. We then configure a <Plugin> block, and inside that a <Node> block for each Redis instance we wish to monitor. Each <Node> block needs to be uniquely named and contains the connection settings for that Redis instance. We specify the host, port, a timeout, and, optionally, a password for the connection.
We’ve also included configuration for the processes plugin to monitor our redis-server process.
When we restart collectd we’ll start collecting Redis metrics and reporting them to Riemann. We’ll see metrics covering uptime, connections, memory, and operations. Each event’s :service will be named for the name provided in the <Node> block and the name of the plugin. For example, for Redis memory usage you’ll see an event like so:
Like our MySQL events, let’s rewrite these events before they hit Graphite. To do this we edit the /etc/riemann/examplecom/etc/collectd.clj file on our Riemann server.
(def default-services
  [{:service #"^load/load/(.*)$" :rewrite "load $1"}

. . .

   {:service #"^redis-(.*)$" :rewrite "redis $1"}])
This will turn an event like:
redis-tornado-redis/memory
Into:
redis.tornado-redis.memory
Making it easier to parse and graph.
13.3 Addressing the Tornado Data tier monitoring concerns
Now that we have the Data tier monitored and sending data, what can we do with that data? We identified a series of concerns for Tornado’s Data tier earlier. Those concerns were:
- That MySQL and Redis are running on their respective hosts.
- 99th-percentile latency adding items to the Tornado DB is 3 milliseconds or less.
- That maximum MySQL connections don’t exceed 80% of the available connections.
- That we can measure the rate of aborted connections to MySQL.
- That we’re able to make use of the application metrics from the data inside our MySQL database.
- That we can measure key queries to ensure they are performing within expectations.
Let’s look at how we might address these concerns.
Like our earlier Web and Application tier components, we get process monitoring from the processes plugin and notifications thanks to the thresholds we configured in Chapters 5 and 6. We don’t need to make any specific changes here but we could tweak the threshold for processes depending on the number of Redis or MySQL instances running, if required.
We can address our other concerns by using checks we’ve previously created too. Let’s add a new function to our tornado.clj file to hold our Data tier checks. We’ll call this function datatier and call it via our splitp var.
. . .

  (splitp re-matches host
    web-tier-hosts (webtier)
    app-tier-hosts (apptier)
    db-tier-hosts  (datatier)
    #(info "Catchall - no tier defined" (:host %) (:service %)))))
The datatier function will hold the checks for our Data tier. Let’s look at our checks now.
(defn datatier
  "Check for the Tornado Data Tier"
  []
  (sdo
    (check_ratio "mysql-status/gauge-Max_used_connections"
                 "mysql-variables/gauge-max_connections"
                 "mysql.max_connection_percentage"
                 80 90
        (alert_graph))
    (create_rate "mysql-status/counter-Aborted_connects" 5)
    (check_percentiles "dbi-performance_schema/gauge-insert_query_time" 10
      (smap rewrite-service graph)
      (where (and (service "dbi-performance_schema/gauge-insert_query_time 0.99") (>= metric 3.0))
        (changed-state { :init "ok"}
          (slacker))))))
We’ve defined three checks. Our first check, using our check_ratio function, is to create a percentage metric for maximum used connections. We set a threshold generating a warning notification if the percentage exceeds 80%, and a critical notification if the percentage exceeds 90%. We use the generic alert_graph function to handle the notification and send the resulting percentage metric to Graphite.
Our second check creates a rate for MySQL aborted connections. As we have created a couple of rates now, let’s create a new function to manage this process. We’ll create a function called create_rate and add it to our /etc/riemann/examplecom/etc/checks.clj file. Let’s look at this new function.
(defn create_rate [srv window]
  (where (service srv)
    (with {:service (str srv " rate")}
      (rate window index (smap rewrite-service graph)))))
Our create_rate function takes a service and a time window as parameters. It uses a where stream to filter events based on service. We then use a with stream to create a new copy of the event and adjust the :service field to append rate to the field. We then pass this new event to the rate stream where we calculate a rate using the window parameter and pass it into Graphite via an smap. We could add other child streams or checks to this function too.
Our last check uses one of the metrics we created with the dbi plugin. We’re using our check_percentiles check to create percentiles from the:
dbi-performance_schema/gauge-insert_query_time
metric. We’re creating percentiles over a 10 second window, writing them to Graphite, and then using the resulting 99th percentile.
    (check_percentiles "dbi-performance_schema/gauge-insert_query_time" 10
      (smap rewrite-service graph)
      (where (and (service "dbi-performance_schema/gauge-insert_query_time 0.99") (>= metric 3.0))
        (changed-state { :init "ok"}
          (slacker))))))
If the 99th percentile of the INSERT query time exceeds three milliseconds then we’ll trigger a Slack notification.
This is a small set of the possible checks for our Data tier. You can easily expand on this to suit your needs.
13.4 The Tornado dashboard
With all of our metrics flowing into Graphite we can now build a dashboard. Let’s build a Tornado-specific dashboard that we’d share with the team managing it. We want to construct an eclectic dashboard with some business metrics and some more technical visualizations.
We sign in to our Grafana server and create a new Dashboard called Tornado. We’re going to create two initial panels with business metrics, both taking advantage of data we’re pulling from our MySQL database with the dbi plugin. But rather than create a graph, we’re going to create a single stat panel.
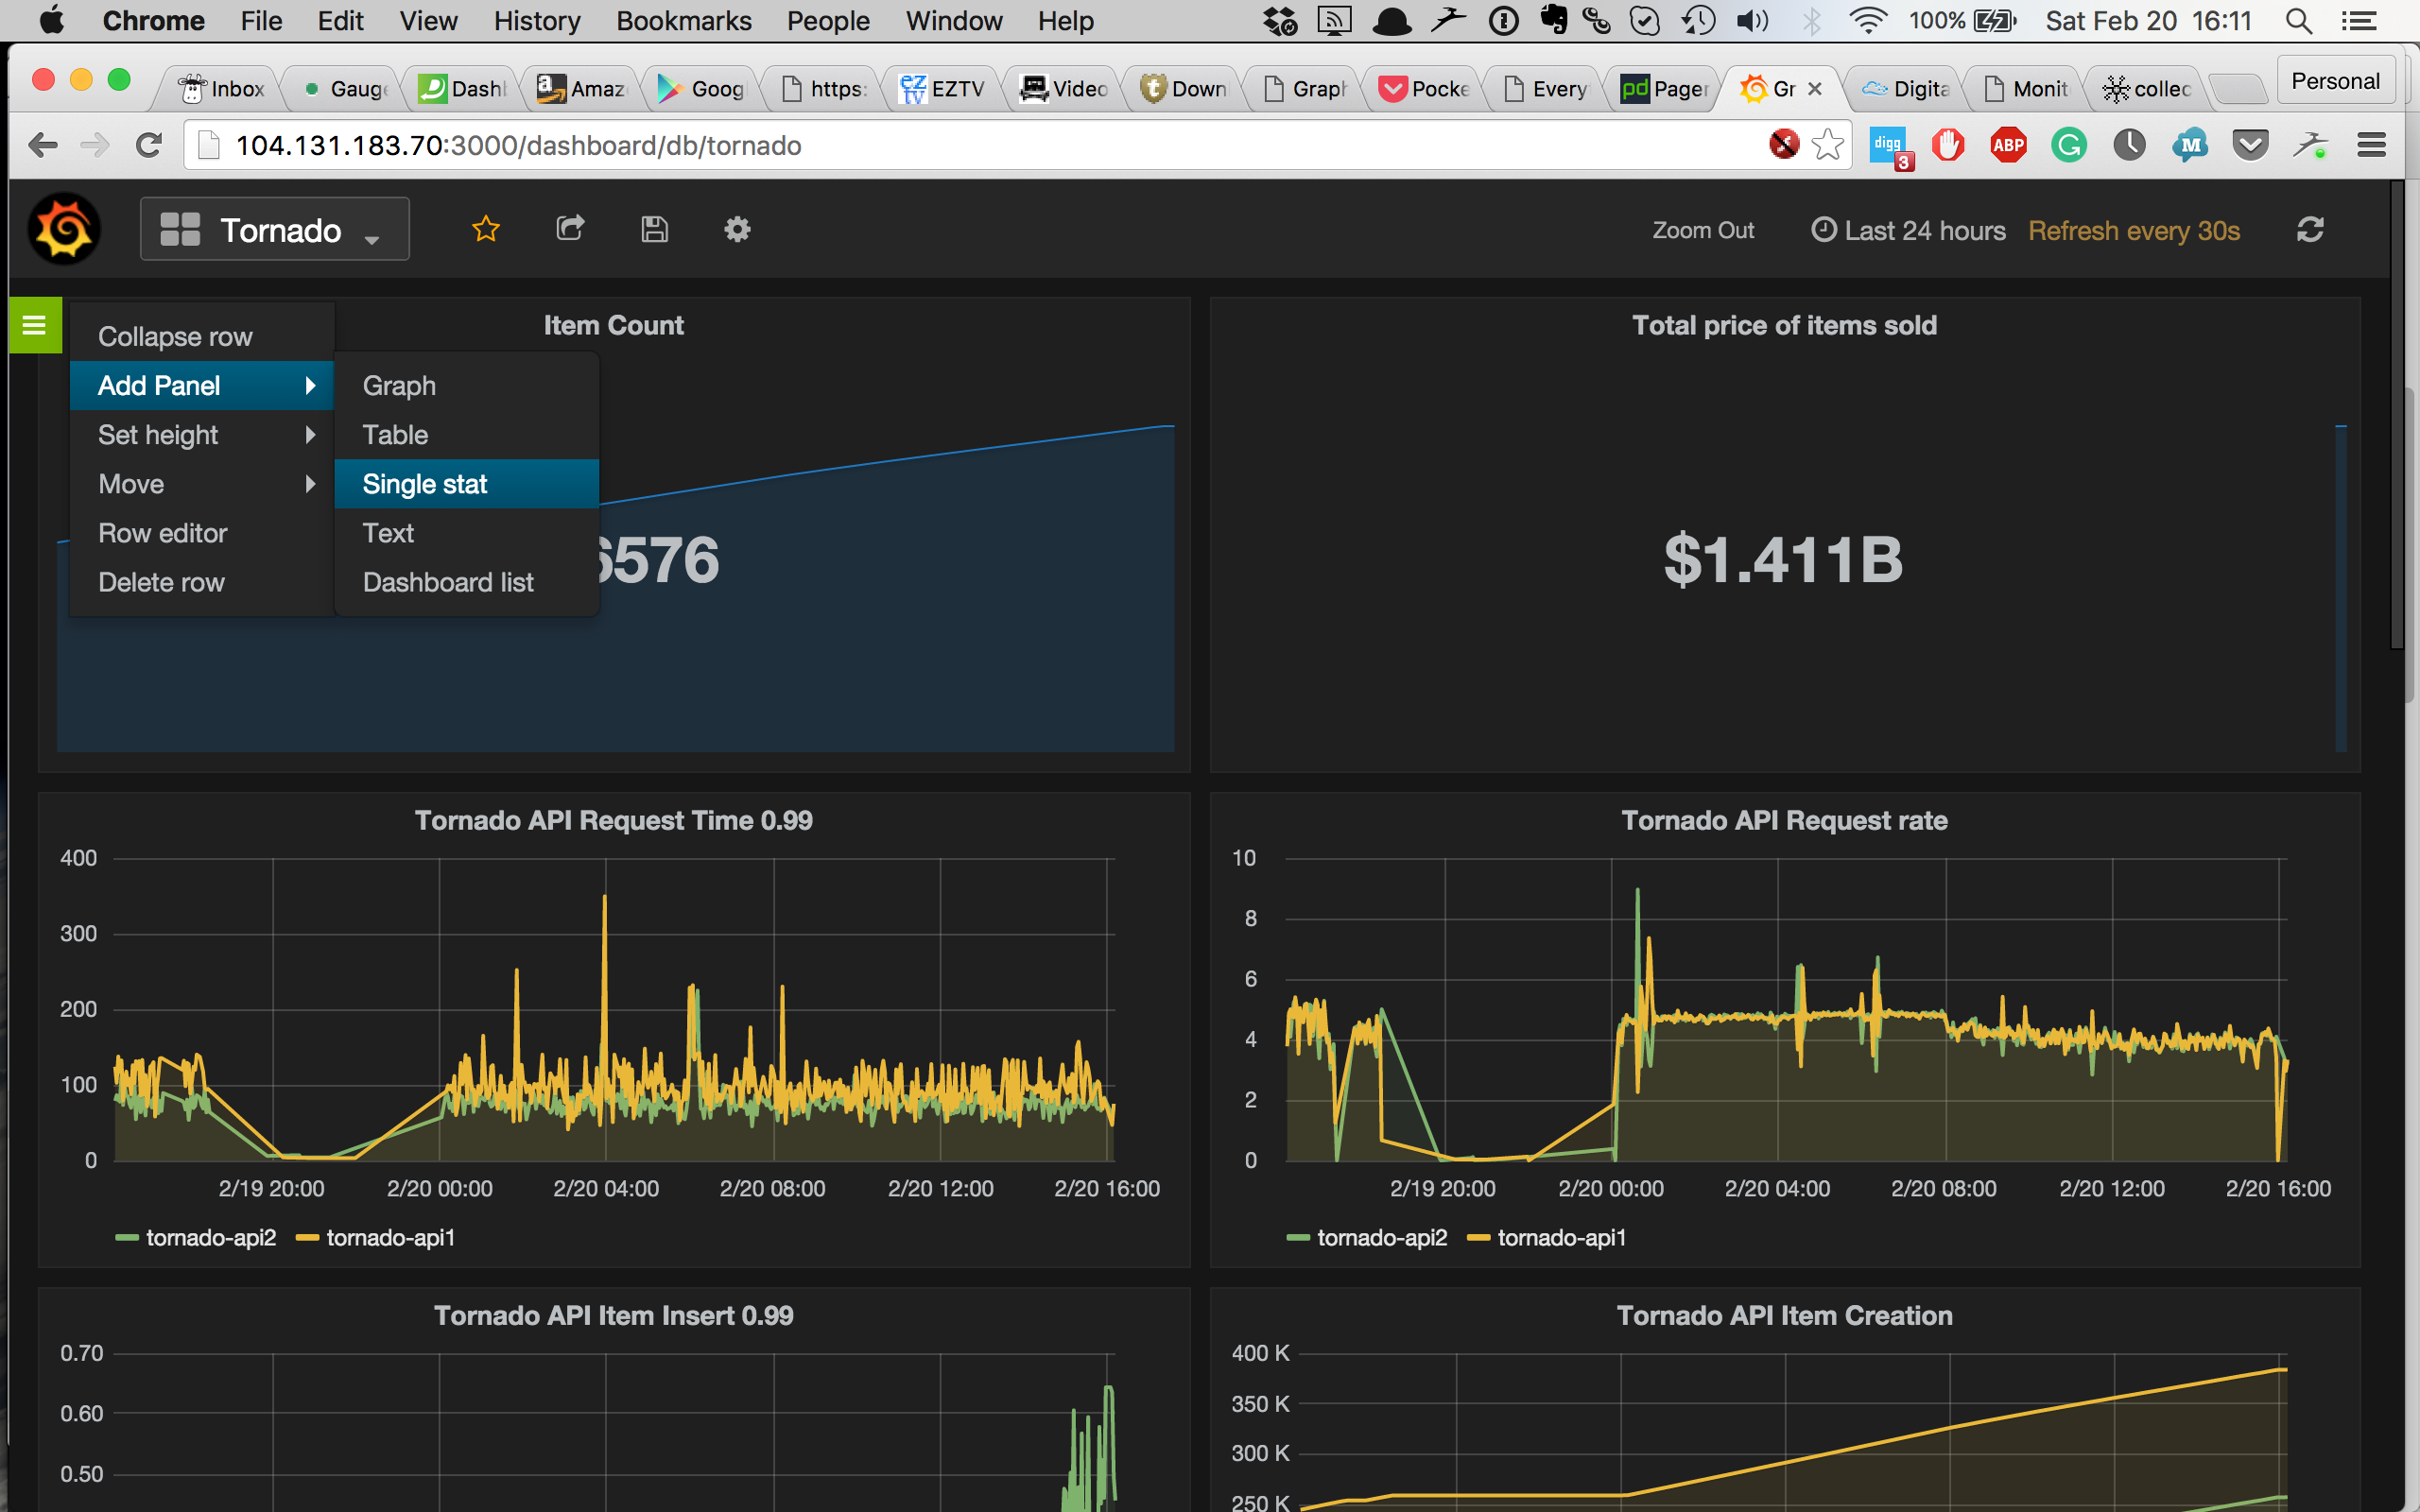
A single stat panel contains a single number or metric. We’re going to create our first one with the current item count of the Tornado application.
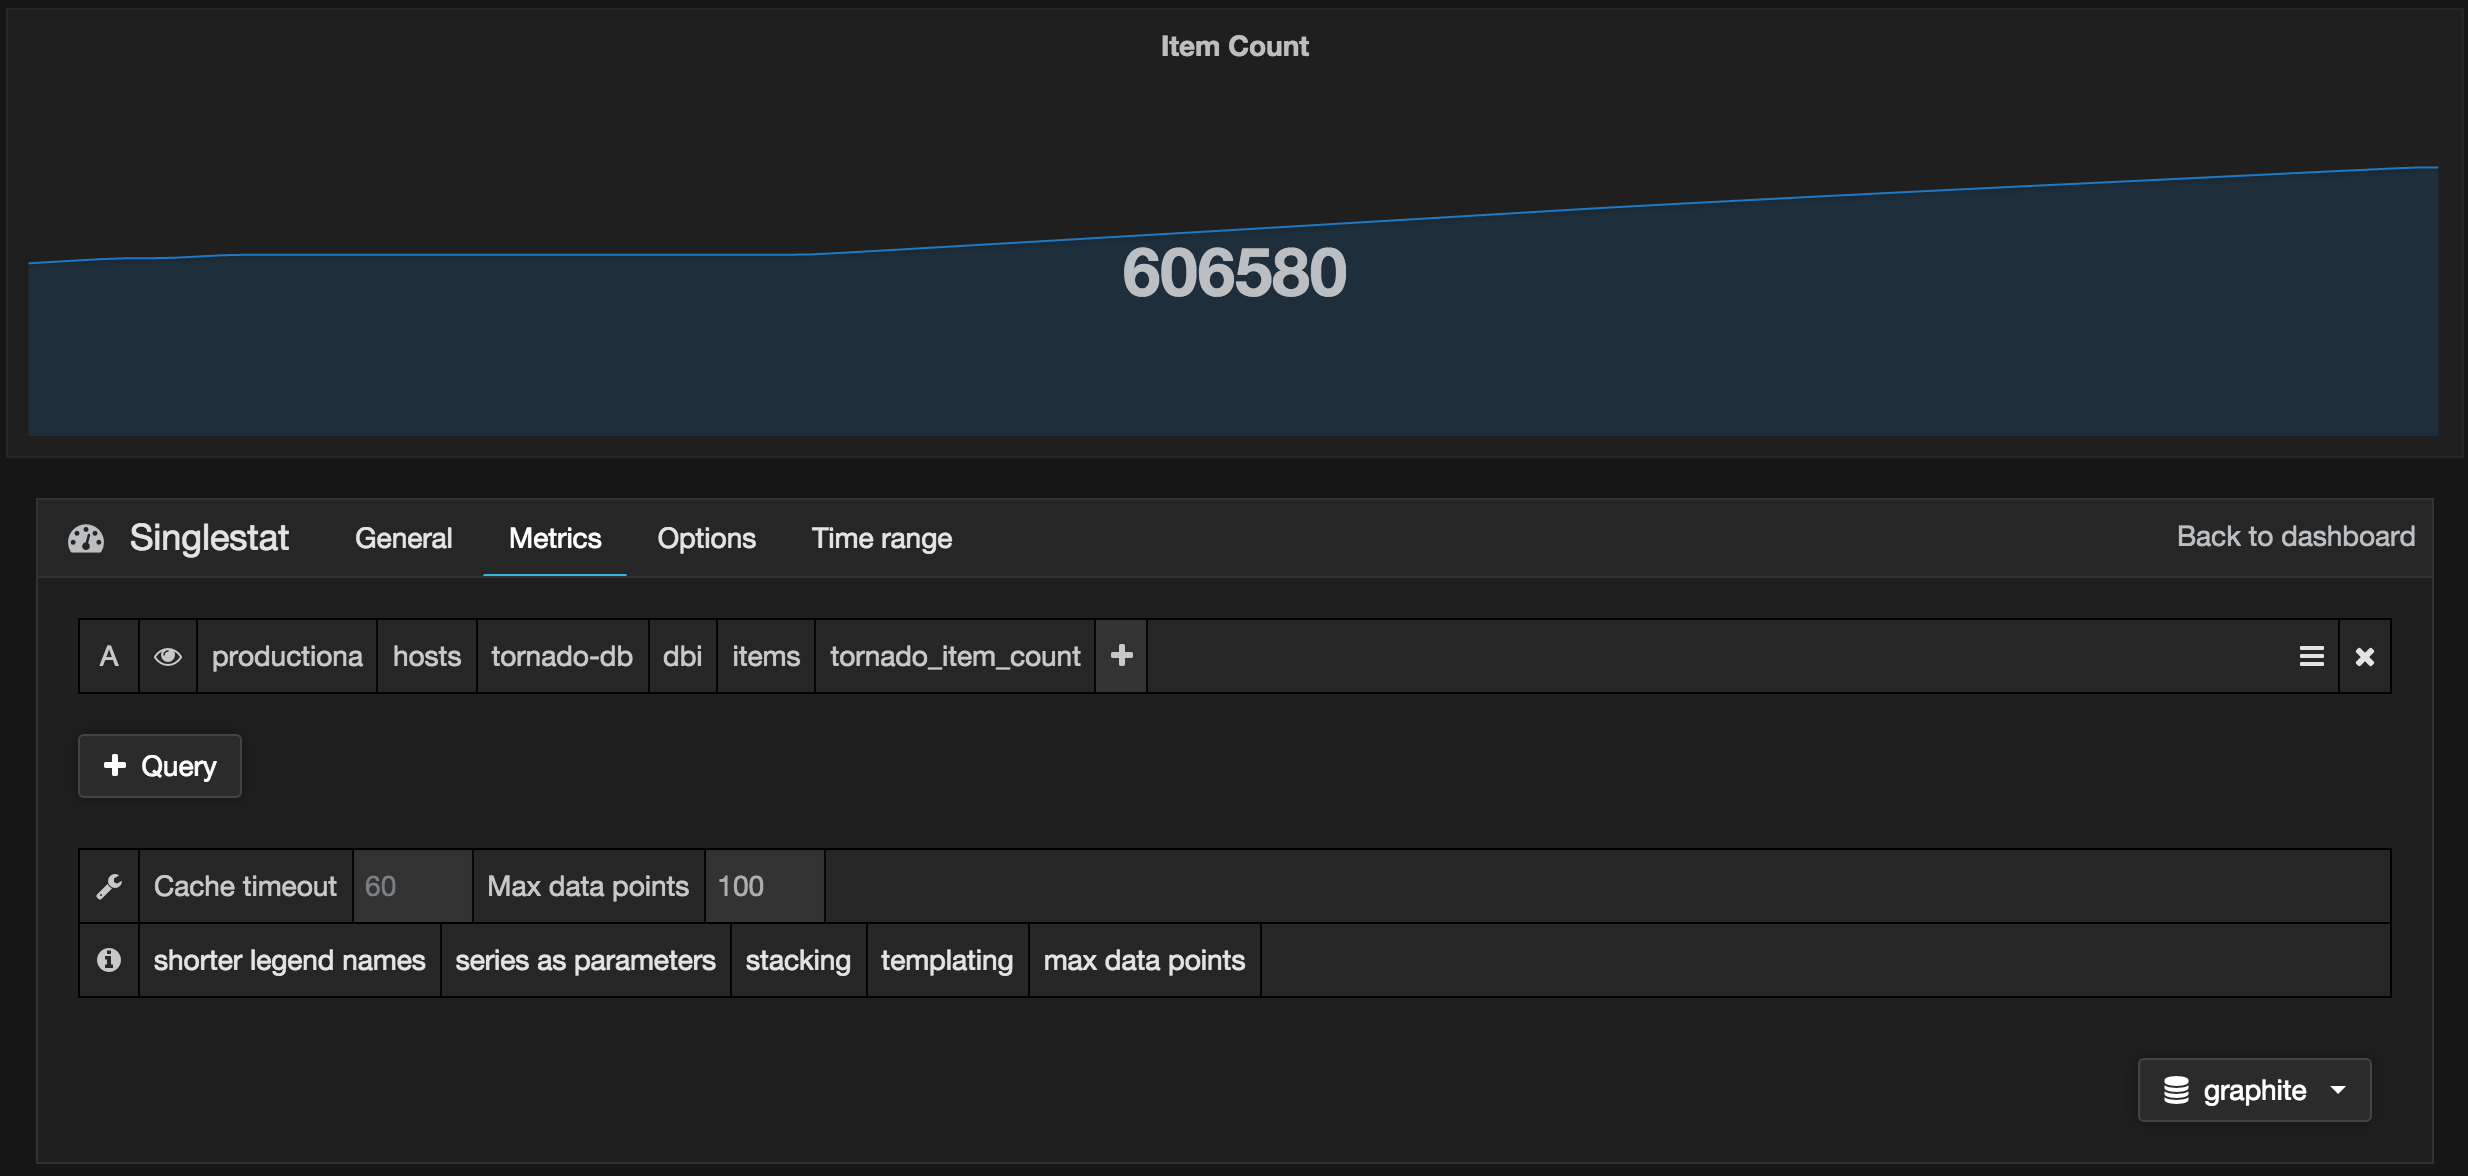
We specify the metric name of our item count:
productiona.hosts.tornado-db.dbi.items.tornado_item_count
And we give the panel a title, Item Count, and then save it. We’ll do the same for our total items sold price using the metric:
productiona.hosts.tornado-db.dbi.items.items_sold_total_price
And we give it a title of Total price of items sold. Then again for the metric:
productiona.hosts.tornado-db.dbi.items.items_bought_total_cost
And we give it a title of Total cost of item bought.
This will be the top row of our Tornado dashboard that will allow us to see the business metrics of our Tornado application.

We also want to create some graphs showing the current dollar value of items bought and sold. We can use a method like:
Here we’ve used a wildcard, *, to select all of the Tornado API metrics that record items bought:
productiona.hosts.*.statsd.gauge.tornado.api.item.bought.total
We’ve used two Graphite functions: alias and sumSeriesWithWildcards. The first function, alias, wraps around the outside of our formula. It aliases the tornado-api1 and tornado-api2 servers into a single alias: Tornado API servers. The second function performs a sum of a series of metrics, in this case adding all the bought item metrics from the Tornado API servers.
We then use this formula on both the bought and sold items metrics to create two new graphs.

These new graphs show the total dollar value of all buying and selling transactions executed on Tornado API servers.
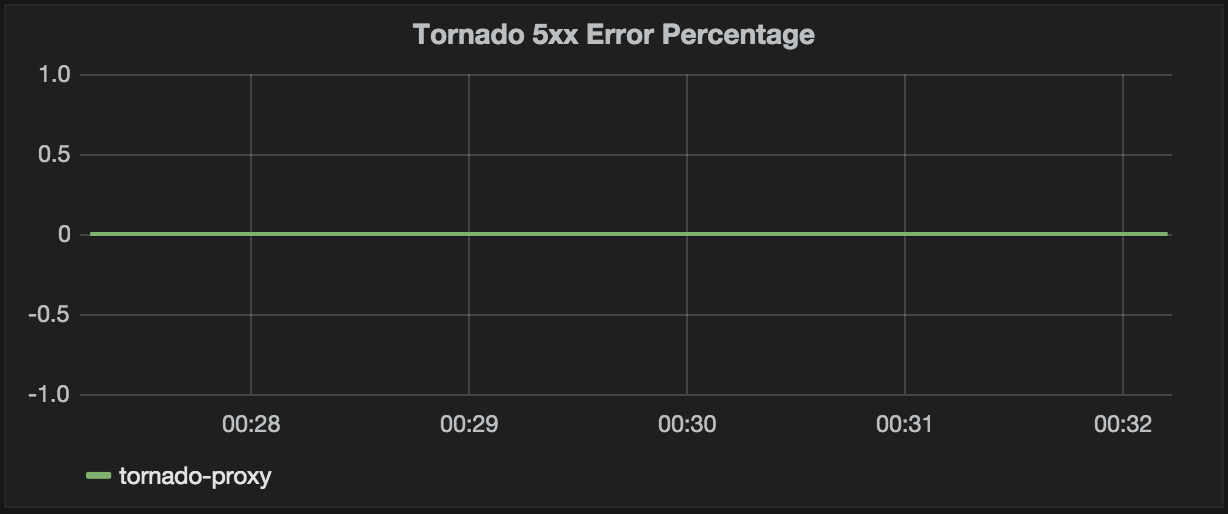
Let’s add a few more graphs that address our developers’ and operations team’s needs. Let’s start with the Tornado 5xx error percentage. Here we use the metric we created in Chapter 11:
tornado-proxy.haproxy.frontend.tornado-www.5xx_error_percentage
We want to alias it by node to see the host name.
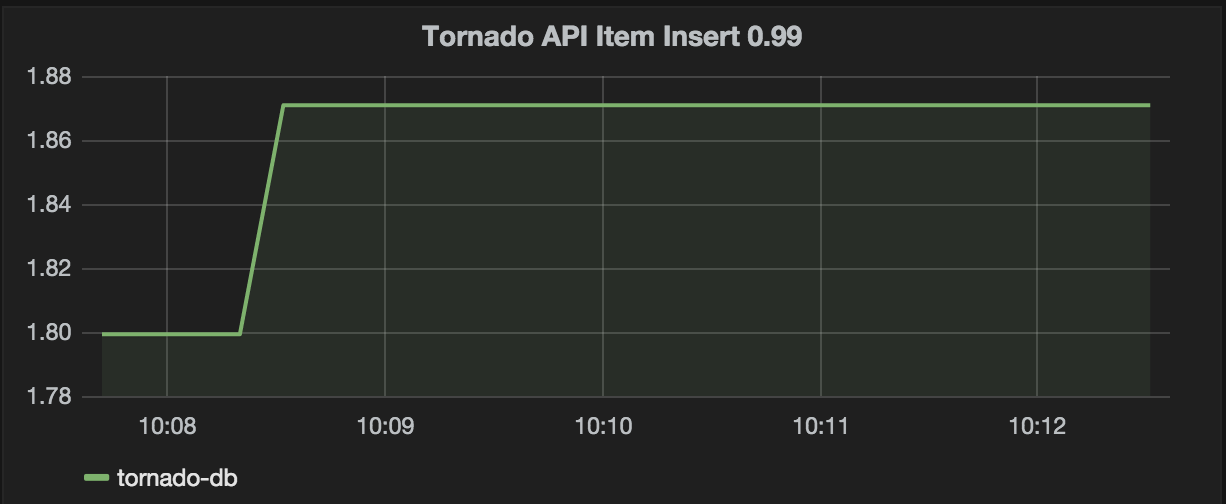
Next let’s create a graph for the insert query timing created from the performance_schema on tornado-db. We again alias by node to get the host name from the metric.
Then we create the graph.
The remaining graphs in the dashboard use the following configuration:
- Tornado API Requests Time 0.99
- Tornado API Request Rate
- Tornado DB Tier CPU Usage
- Tornado App Tier CPU Usage
- Tornado Web Tier CPU Usage
- Tornado Swap Used
- Tornado Memory Used
- Tornado Load (shortterm)
- Tornado Disk used on the / partition
And that completes our Tornado operational dashboard. You can see that business, ops, and developers can all make use of the dashboard to gain insight into the current state of the Tornado application.
If you can want to look at it in more detail, you can find the JSON source code for our dashboard in the book’s source code.
13.5 Expanding monitoring beyond Tornado
One of the most useful things about Riemann is that much of our configuration and many of our checks are reusable across applications and services. If we had many iterations of the Tornado app we could easily update our checks function’s let statement to select all of the relevant hosts. Let’s assume our Tornado applications were numbered (and all Tornado-application events were tagged by collectd):
(defn checks
  "Handles events for Tornado applications"
  []
  (let [web-tier-hosts #"tornado(d+)?-(proxy|web1|web2)"
        app-tier-hosts #"tornado(d+)?-(api1|api2)"
        db-tier-hosts #"tornado(d+)?-(db|redis)"]

    (splitp re-matches host
      web-tier-hosts (webtier)
      app-tier-hosts (apptier)
      db-tier-hosts  (datatier)
      #(info "Catchall" (:host %)))))
This would match hosts from the tornado-xxx, tornado1-xxx, or tornado10-xxx applications.
To be more sophisticated we could also replace the regular expression lookups for web-tier-hosts and the others with lookups of an external data source from a configuration management tool like PuppetDB or service discovery tools like Zookeeper or Consul.
Using this, and by modifying the regular expression, we could also match on events from a wide variety of applications. For example, we could create a generic set of three-tier web application checks by renaming our tornado namespace.
We can then update the stream inside our riemann.config to select events from multiple applications.
The tagged-any stream will match on events that have any of the tags listed; here events with either the tornado or the avalanche tags will be sent to the application/checks function. Assuming our host selection is also updated, the events will be routed to the relevant tier checks. We would then update any application-specific metric names in our streams to be generic.
This allows us reuse or build generic checks with our Riemann configuration.
13.6 Summary
In this chapter we monitored the Data tier of our Tornado application. We’ve again looked at both business and application performance metrics. We’ve constructed appropriate checks and thresholds for letting us know when the Data tier is available and when it is not performing in accordance with our expectations.
We’ve also exposed some of our metrics as visualizations in a dashboard for the business owners, as well as adding other graphs that meet the monitoring needs of our developers and operations teams.
Finally, combined, these last three chapters represent the capstone of the Art of Monitoring. They demonstrate how to combine the tools and techniques we’ve built in the preceding chapters to build a comprehensive monitoring framework. With these tools, techniques, and the real-world examples we’ve provided, you should be able to build and extend the framework to monitor your own environment.