
Chapter 6. Relationships, Mindset, and the Business Case
In war, the general receives his command from the sovereign.
—Sun Tzu
Thus far in Part I, “Staffing a Scalable Organization,” we have discussed the importance of getting the right people into the right roles, exercising great leadership and management, and establishing the right organization size and structure. Now we turn our attention to three additional pieces of the scalability puzzle:
• Building effective business leader/product team relationships
• Having the right “mindset” to build products
• Making the business case for product scalability improvements
Understanding the Experiential Chasm
We believe that a great many of the problems existing between many general managers (the people responsible for running a business) and their technical teams are a result of a vast and widening chasm in education and experience. From an education perspective, the technology executive may have a math-, science-, or engineering-focused degree, while the general manager likely has a less math-intensive background. Personality styles may also vary significantly, with the technical executive being somewhat introverted (“put him in a dark room alone and he can get anything done”) and the general manager being much more extroverted, friendly, and “salesperson like.” Their work experience likely varies as well, with the general manager having been promoted to this position through closing deals, selling proposals, and making connections. In contrast, the technical executive might have been promoted based on technical acumen or a demonstrated ability to get a product completed on time.
This mismatch in education and experience causes difficulty in communication for several reasons. First, with very little in common, there is often little reason outside of work-specific tasks for the two people to communicate or to have a relationship. They might not enjoy the same activities and might not know the same people. Without this common bond outside of work, the only way to build trust between the two individuals is through mutual success at work. Success may ultimately create a bond that kindles a relationship that can endure through hard times. But when mutual success has not yet been achieved, the spark that occurs kindles the opposite of trust—and without trust, the team is doomed.
Second, without some previous relationship, communication does not happen on mutual footing. Questions are often rightfully asked from a business perspective, and the answers are often given in technical terms. For instance, the general manager might ask, “When can we ship the Maxim 360 Gateway for revenue release?”, to which the technical executive might respond, “We are having problems with the RF modulation and power consumption, and we are not sure if it is a software potentiometer or a hardware rheostat. That said, I do not think we are more than two weeks off of the original delivery schedule to QA.” Although the technical executive here gave a full and complete response, it probably only frustrated the general manager. She quite likely has no idea what a soft-pot, rheostat, or even RF is. The information came so fast and was intermixed with so many important—but to her, meaningless—pieces of information that it just became confusing.
This resulting mismatch in communication quite often gives way to a more detrimental form of communication, which we call destructive interference. Questions begin to be asked in a finger-pointing fashion, such as “What are you doing to keep this on track?” or “How did you let it slip a week?”, rather than in a fashion meant to resolve issues early, such as “Let us see if we can work together to determine how we can get the project back on the timeline.” Of course, you should keep and hold high expectations of your management team, but doing so should not create a destructive team dynamic. It is possible to both have high standards and actually be a participative, supporting, and helpful leader and executive.
Why the Business Executive Might Be the Problem
Some questions can be asked to determine if the likely culprit of poor communication is the business executive. Do not fret; we will provide a similar set of questions to point the blame at the technology executive. The most likely case is that some amount of fault resides with both business and technology leaders. Acknowledging this fact represents a major step toward fixing the problems and improving communication.
• Has the head of technology been replaced more than once?
• Do different people in the technology team give the business leaders the same explanations but they are still not believed?
• Do business leaders spend as much time attempting to understand technology as they have invested in learning to read financial statements?
• Do the business leaders understand how to ask questions to know whether dates are both aggressive and achievable?
• Does the business executive spend time in the beginning of a product life cycle figuring out how to measure success?
• Do business leaders lead by example or do they point fingers?
Note how many of the preceding questions can be easily traced back to education and experience. For instance, if you are getting consistent answers from your team, perhaps you just do not understand what they are saying. There are two ways to resolve that: Either you can gain a better understanding of what they are telling you, or you can work with them so that they communicate in a language that you better understand. Better yet, do both!
These questions are not meant to imply that the business leaders are the only problem. However, failure to accept at least some culpability is often a warning sign. While perhaps a person (such as the CTO) needs to be “upgraded” to create a better team with better communication, constant churn within the CTO position is a clear indication that the issue is really the hiring manager.
Why the Technology Executive Might Be the Problem
Here is a similar list of questions to ask your technology leadership:
• Does the technology team provide early feedback on the likelihood of making key dates?
• Is that feedback consistently incorrect?
• Is the business repeatedly experiencing the same problems either in production or in product schedules?
• Do the technology team members measure their work against metrics that are meaningful to the business?
• Are the technology choices couched in terms of business benefit rather than technical merit?
• Does the technology team understand what drives the business, who the competitors are, and how their business will be successful?
• Does the technology team understand the business challenges, risks, obstacles, and strategy?
• Can the technology leadership read and understand the balance sheet, statement of cash flows, and income statement?
We often encounter technology executives who simply haven’t learned the language of business. The best technology executives define metrics in terms of things that are important to the business: revenue, profit, cost, time to market, barriers to entry, customer retention, and so on. It is critical for the technology executive to understand the means by which the business makes money, the drivers of revenue, the current financial reality within the business, the competitive landscape, and the current year’s financial goals for the business. Only with this knowledge can the CTO create the technology strategy necessary to achieve the business’s objectives.
It is common for CTOs to be promoted to their positions based on technical acumen. To be successful in that role, however, they must find ways to significantly increase their business acumen. Many accelerated, online, and part-time MBA programs are available that can help the technical executive bridge the gap between the executive team and the technology team. CTOs needing greater business acumen can also seek out executive coaches and add business professional reading to their reading lists, especially in the areas of finance, strategy development, and capital planning/budgeting.
Defeating the IT Mindset
There are two basic models for technology organizations: the IT organization model and the product organization model.
IT organizations often provide consulting and implementation services to other organizations for the purposes of decreasing costs, increasing employee productivity, and so on. They tend to focus on implementing enterprise resource planning (ERP) solutions, communication systems (telecommunications, email, and the like), and customer relationship management (CRM) solutions. Often they work to elicit a set of requirements from internal customers (other employees) to implement packaged or homegrown solutions to meet organizational objectives. IT groups are often viewed as cost centers and are run accordingly. Their primary objectives are to reduce the cost basis of the company by employing technology solutions rather than by expanding headcount to similar activities. In turn, IT organizations may be evaluated based on their costs to the enterprise. This may be done by determining costs as a percentage of revenue, as a percentage of total operating (non-gross margin) costs, or on a cost-per-employee (per capita) basis within the company. Most companies need an IT group, and being in an IT organization is a great way to contribute to a company and to help generate shareholder value.
The second model that technology organizations can use to structure themselves is the product model. Product organizations define and create the products that drive growth and shareholder value creation. Because their mission is different from that of IT organizations, product teams function, act, and think differently than their peers in IT. Rather than primarily being evaluated on a cost basis (e.g., cost per employee, cost relative to operating costs), product teams are viewed as profit centers. This is not to say that the cost of the organization is irrelevant, but rather that it is relevant only in evaluating the revenue and profit that the cost delivers. Whereas IT teams often see their customers as being other employees, product teams are focused on external market analysis, and they see their customers as being the users of the products created by the company.
The difference in mindset, organization, metrics, and approach between the IT and product models is vast. To better understand the differences between these two approaches, let’s employ an analogy. Suppose you are the offensive coordinator of an NFL team. If you were to employ the IT mindset for your offensive squad, you would tell your offensive line that their customer is the quarterback and running backs. In this analogy, the offensive line provides “blocking services” for the running backs and the quarterback. The problem here is that customers and vendors, by definition, aren’t part of the same team. They have different goals and objectives. Customers want value creation at a fair price, while vendors want to maximize shareholder value by selling their products and services at the highest price that attracts the number of customers needed to maximize revenue. While both can succeed, they don’t share common objectives.
Football teams, however, understand that they must succeed as a unit. Members of the offensive squad understand that their job is to jointly throw up as many points as possible while committing as close to zero turnovers as possible. When they work well, they work as a team—not as one component of the group providing services to another component. While the offensive squad is subject to the salary cap set for the football team, their primary measures of success are points, turnovers, and ultimately wins. Their customer is the fan, not their teammates.
Successful companies such as eBay, PayPal, Amazon, and Google understand in their DNA that technology is part of their product and that their product is their business. These companies do not attempt to use IT metrics or IT approaches to develop their products. The product and executive teams understand that the customer is the outside person purchasing their solutions, not someone within their own company. They think in terms of revenue growth and the cost necessary to generate that revenue, not in terms of the cost per employee within the company. In such organizations, the business leaders use terms like “product architecture” rather than “enterprise architecture.” They seek to isolate faults within the products they create rather than looking for how to share resources (and failures) for the purposes of reducing costs.
Real problems emerge when a company creates a product for real customers but does so using processes meant for internal IT organizations. The documentation of requirements built into this approach tends to kill the notion of product discovery. Corporate technology governance tends to significantly slow time to market for critical projects. Top-down innovation from internal customers eliminates the advantages of broad-spectrum sourcing of innovation we described in Chapter 3, Designing Organizations (refer to Figure 3.5). Companies continue to seek internal solutions rather than sensing their market and reacting to how customers interact with their products. The bottom line is that IT mindsets are great for internal technology development, but disastrous for external product development.
Great products are built by companies that understand their customers. Great product teams innovate with their customers directly, rather than eliciting requirements from other employees. Great product companies understand the difference between running teams that create externally focused products and those that create internally focused efficiencies.
The Business Case for Scale
So far in this chapter, we have covered why a communication breakdown might occur between the technology leaders and business leaders as well as how to solve that problem. We also explored why the traditional IT mindset and approaches are inappropriate for the development of products. Armed with an understanding of these common problems and ideas about how to fix them, we now turn our attention to selling the need to invest in scale and availability.
We’ll start by explaining how not to sell any initiative. Business is about revenues and costs, profits and losses. A surefire way to guarantee that a project gets no funding is to sell the project on something other than revenue and cost. Put another way, no one cares that the project upon which you want to embark is the newest and greatest technology available. Your job is to explain how and why it will maximize shareholder value by maximizing revenue and minimizing costs. Your business is unique, so each business case (each “sales package”) will, in turn, need to be tailored for your platform or product.
By way of example, let’s take a pass at how we might frame the business case for investing in higher availability. Downtime (the opposite of being available) usually means lost revenue and/or unhappy customers. For sites with transaction-based revenue models, simply take the projected revenue for the quarter or month and calculate revenue generated per minute. While even the simplest sites are likely to experience wild fluctuations in the actual revenue per minute (the peak usage can be 100 or more times the overnight usage of an ecommerce site), this straight-line calculation is a good start. For products with recurring license fees, calculate (based on contractual remuneration) what each minute costs your organization in terms of customer credits or remunerations. For products monetized through advertising (as in ad impressions), use the ad revenue per minute calculation or identify the number of lost impressions (page views) multiplied by the per-page value. These calculations result in the revenue lost associated with any downtime on a per-minute or per-page basis.
For a more accurate example of downtime cost calculation, you can use a graph of your site’s normal daily and weekly traffic. Take last week’s traffic graph (assuming last week was a normal week), and lay over top of it the traffic graph depicting the outage. The amount of area between the two lines should be considered the percentage of downtime. This method is particularly useful for partial outages, which you should have if you follow our advice in Chapter 21, Creating Fault-Isolative Architectural Structures.
In Figure 6.1, assume that the solid line is your revenue per 10-minute interval for the prior week on Monday. The dotted line is the revenue for the Monday on which you had an intermittent service problem from roughly 16:30 hours to 18:20 hours.
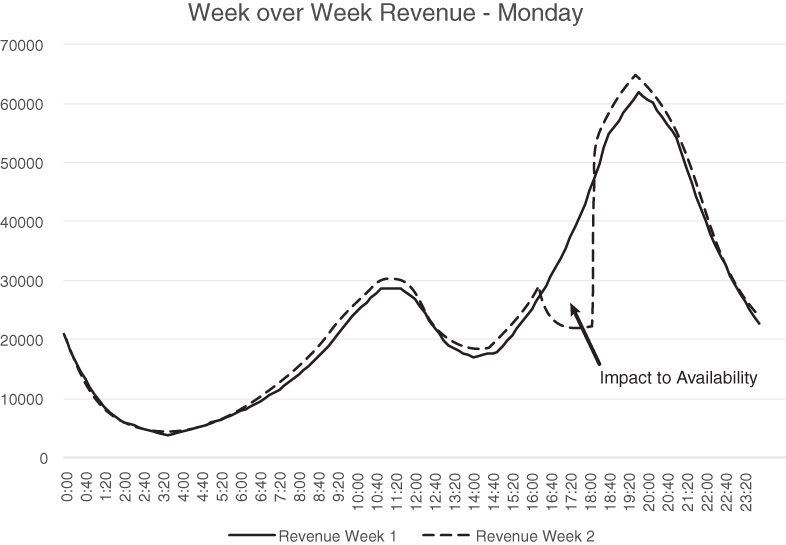
This graph serves multiple purposes. First, if the data is plotted in real time, the graph helps identify when things aren’t working as we expect. Our experience in high-volume sites indicates that these graphs tend to follow fairly predictive patterns. While you may increase your traffic or revenue (as the dotted is slightly higher than the solid line in Figure 6.1), the first and second derivatives of the curve (the rise over run and change in rise over run) are likely to display weekly or daily patterns. Put another way, the majority of the dotted line displays the same wave pattern as the solid-line curve. That is, the two are consistent until an event occurs at roughly 16:30 hours. If a team were watching this curve, it might give them an early indication that something is happening—something to which they should respond.
The second purpose of this graph is to measure the impact of an outage in transactions or revenue. As previously indicated, the area between these curves is a great approximation of the impact of this particular outage. In this case, because we are calculating revenue in the graph, we can identify exactly how much revenue we lost by looking at the area between the two lines.
Another approach to capturing platform issues in terms of business metrics is to relate them to customer acquisition cost. If your business spends marketing dollars to attract users to visit the site, there is a cost associated with each customer acquired. Knowing this cost helps the marketing team determine which channel or approach offers the lowest cost per acquired user. When the site is down, the marketing expenditures do not stop—usually these campaigns cannot be started and stopped immediately. Instead, the marketing spending continues and users are brought to a site that does not work properly. Newly lured potential customers become disgruntled with the experience, and you lose the opportunity to convert them to paying customers. Each downtime period then becomes a future revenue loss equivalent to the lifetime value of all the users who did not convert during the period of unavailability. Extending beyond this understanding, if you keep track of returning users, another metric to look at is how many users stop returning after an outage. If 35% of your users return to the site once per month, watch this metric after an outage. If their numbers drop, you may have just lost those users permanently.
Another idea for describing the outages or potential for outages in business terms is to translate it into costs within the organization. These costs can be cast in terms of operations staff, engineers, or customer support staff, with the last being the most immediately noticeable by the business. When downtime occurs and engineers and operations staff must attend to remedying this situation, they are not working on other projects such as customer features. A dollar amount can be calculated by determining the total engineering budget (e.g., salaries, support), then associating the number of engineers and time spent on the outage as a percentage of the total budget. As noted previously, the factor closest to the business would be customer support staff who are not able to work due to support tools being unavailable during the outage or who must handle extra customer complaints during the outage and for hours afterward. For companies with large support staffs, this amount of work can add up to significant amounts of money.
Although determining the actual cost of an outage can be a painful exercise for the technology staff, it serves several purposes. First, it quantifies the cost of downtime in real dollar values. This data should be helpful when you are arguing for support and staffing for scalability projects. Second, this calculation helps educate the technology staff about what an unavailable platform really costs the business. Understanding how profitability, bonuses, budgets, hiring plans, and so on are all correlated with platform performance can be a huge motivator to engineers.
Conclusion
In this chapter, we wrapped up Part I of this book by addressing the final link in the scalable organization chain: how to make the business case for hiring resources, allocating resources, and staying focused on scalability as a business initiative. An experiential chasm tends to exist between most technologists and their business counterparts, most likely including the CTO’s boss, but a business will benefit when all parties have a corporate mindset. Ideas about how to cross the chasm and undo the corporate mindset so the business can respond to the need to focus on scalability, especially from a people and organizational perspective, include hiring the right people, putting them in the right roles, demonstrating the necessary leadership and management, and building the proper organizational structure around the teams.
Key Points
• An experiential chasm separates technologists and other business leaders due to education and experiences that are missing from most nontechnology executives’ careers.
• Technologists must take responsibility for crossing over into the business to bridge this chasm.
• To garner support and to understand scaling, initiatives must be put in terms that the business leaders can understand.
• Calculating the cost of outages and downtime can be an effective method of demonstrating the need for a business culture focused on scalability.