Chapter 14
Using Level II Screens
In This Chapter
• Nasdaq Level II screens provide detailed pricing
• Level II screens let short-term traders see market
• Charts translate data into information
• Expense is not prohibitive and information is necessary
Information is the active trader’s best tool. If you’re going to compete in the intraday trading frenzy, you must have access to the same information as your competitors. That means detailed order and price information on securities you want to trade.
Throughout this book, you have heard Nasdaq Level II price screens referenced for short-term traders. In this chapter, we’ll look into the system and discuss its place in your active trading system. Charts that use detailed quotes (both intraday and moving averages) provide short-term traders visual representations of massive amounts of information that is easy to digest and act on. Having a large amount of information in front of you is only beneficial if you can quickly organize it on your computer’s desktop for easy retrieval and comprehension.
Level II Screens for Short-Term Traders
Nasdaq Level II screens give active traders a live view of market activity in a stock. You see the orders, not just the bid and ask prices (which is all the information provided by Level I quotes).
Even though the quotes are called Nasdaq quotes, all traded securities on all exchanges are reported through this system. The transparency of pricing and orders is not complete, but Level II screens do give everyone connected the same view of the market during intraday trading. By transparency, I mean all participants in trading see the same information with the exception of market makers and market specialists. These professionals have access to Level III screens, which display order flow and other information relevant to maintaining a stable market in the security. The playing field will never be completely level because professionals such as market makers and specialists, large institutional traders, pension funds, mutual funds, and so on can still move the market. (More about how they do this in subsequent chapters. In Chapter 17, we’ll look at how some professional traders and others can use tricks to fool you and novices into bad trades using Level II screen information.)

Trading Tip
When you see stock quotes, you can identify issues traded on the New York Stock Exchange by their three-letter ticker symbol (IBM). Stocks traded on Nasdaq have four-letter ticker symbols (MSFT).
Not all active traders need the power (and expense) of Level II screens. If you plan to stick with swing and position trading, you probably don’t need the detail of Level II screens. As we’ll see when we look at those strategies, trading at that pace is much more focused on price moves over longer holding periods—days, weeks, or months. There is little need for intraday prices.
However, many active traders will find themselves looking at short-term opportunities as well as the longer perspectives of swing and position trading. If you do enough short-term trading to justify the use of a direct access broker, which will give you Level II quotes, the research and charting power will help you with swing and position trading, also.
For active traders who trade short term, Level II screens are your most important source of information, although many traders look to charts generated by intraday pricing and volume for trade signals. In a fast-moving market, the numbers on Level II screens will be changing very fast. Charts often make it easier to see what is happening and so you can plot your next move.
Short-term traders must have Level II screens—there is no substitute. There is almost no chance of success for people who attempt short-term trading with a regular discount brokerage account. You will always pay more than necessary for your buys and receive less than the best possible price when you sell. That doesn’t make for a winning strategy.

Margin Call
A strategy of earning your way into a short-term trading career has little chance for success. It is no different than starting a business with no capital. Neither indicates a real commitment to succeed.
What You See Onscreen
It is important to note that direct access providers and services that sell Level II services may format their displays slightly different from what is described here. Some providers include graphic displays, while others may not include some of the information I describe.
Most direct access providers show you two columns of prices—the bid and ask. At the top of the columns are the best current prices. These are the “at market” prices.
If you bought or sold at this very instant, these are the prices you would likely receive. You can’t say for sure you would receive those prices because another factor besides price is supply. In other words, how many shares are available at that price? If your market order is only one of many, it may not be filled before the supply at that price runs out and/or the price changes. Market orders are processed in the order they are received.
The prices under the best bid and best ask price are listed in order of how close they are to the best price. For example, if the best ask price is $25.35 per share, the next one might be $25.33 per share. When the supply of shares at $25.35 is gone, then $25.33 becomes the market price. If new orders come in above $25.33, they will become the new market price.
Digging Deeper
You’ll notice that there is much more information than just prices, and every bit of it can be helpful to short-term traders who know how to read it. Short-term trading is a battle of wits and nerve. Successful traders arm themselves with every weapon they can. As you study Level II screens, you’ll learn which areas are important and how to find the information you need quickly. This is one of the most, if not the most, important skills to learn first, before you attempt short-term trading.
What does the Level II screen tell you? Across the top, you’ll find Level I price quotes, which you remember is the most recently traded price for the stock. You’ll also find the previous closing price, the high and low for the day, the volume, and the size of the last trade.
This shows a Level II screen for Apple (AAPL—Nasdaq) from Interactive Brokers’s Trader Workstation. As you can see, the orders are building on the ask side of the screen, indicating that more sellers are in the market at this particular moment. This may indicate that the price is headed down.
(Photo courtesy of Interactive Brokers.)
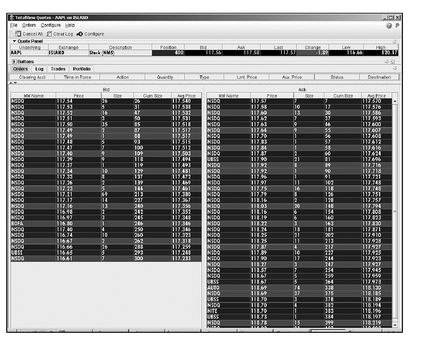
Under both the bid and ask columns you will find three columns of information:
• Order. The first column shows you which market maker, specialist, or Electronic Communications Network (ECN) has placed the order. This is useful information, which we’ll spend more time on in Chapter 17. ECNs are anonymous ways for institutional investors to hide their actions, and by breaking a large order up into several smaller orders, they try to hide potentially price-changing actions.
• Price. The bid or ask price is listed in the middle column. Notice how the spread between the bid and ask price changes as the prices move away from the inside price. The prices at the top of the bid and ask columns are the best available at that moment. If you submitted a market buy or sell order at that exact moment, you would get these prices. Notice how many other orders are lined up under the best bid and ask at the same prices. These would be filled in order. Right below those best prices is another level of prices, below that another level, and so on.
• Size. The size of each order is listed in the third column. The orders are listed in hundreds, which is called a round lot. So an order with a 5 is for 500 shares. There are some special designations for larger orders, which we’ll cover in Chapter 17.
The final item is the Time and Sales screen, which may be a separate screen or part of the Level II screen. This report, which is continually updated, shows actual transactions as opposed to orders so you can follow completed trades. The actual trades reported on the Time and Sales screen will tell you if the stock traded up or down from the previous trade (by its color) and the price.

This shows a Level II screen recording Time and Sales for Apple (AAPL—Nasdaq) from Interactive Brokers’s Trader Workstation. This screen tracks actual sales by the minute and is one the short-term active trader refers to constantly during the trading day. Different colors mark whether the trades were inside the ask or bid or outside.
(Photo courtesy of Interactive Brokers.)

Trading Tip
As you master elements of the advanced platform you choose, you will find the desktop of your computer crowded with open windows. It is important that you limit open windows to those screens you need to look at every minute and minimize the rest.
Let’s look at all of these areas in more detail to discover what they tell the short-term trader.
Level I Quotes
The Level I quotes across the top of the Level II screen contain more information than the trading novice might think. The information is packed into a relatively small area, so it is important that you become familiar with where the data items are located.
At the top, you will see the “Last” quote, which is the last trade for this stock. This represents an actual sale; the number indicating how much the price changed is listed under “Chg.” Next to it tells you how much the trade was up or down from the previous trade. Also listed is the size in actual shares of the last trade. In many cases, the price for the last quote will be the same as the top ask price—but not always. Remember, the ask price is what you pay for the stock if you want to buy—it is always higher than the bid, which is what you receive if you sell the stock. The difference is the spread. At the inside price, the bid-ask spread shouldn’t be too far apart—no more than a couple of pennies. We’ll see why that’s important in Chapter 17.
Opening and Closing Quotes
Also in the top section, usually in the Level I price information, is the opening price for today’s trading and the closing price for yesterday’s trading. When there is a difference, the stock is said to gap at open. If the gap is modest, it probably doesn’t mean anything except the market specialist is adjusting for volume or some other technical correction.
def·i·ni·tion
Gap is a term used to describe a jump (up or down) in price from the closing price to the next day’s opening price. Gaps also occur during intraday trading when prices skip up or down. Several factors, both good and bad, can cause a gap. Gaps are warning signs to active traders to pay attention.
However, if the gap is large, it may be due to news about the company, economy, or industry that was released after the market closed the previous day. Traders are reacting to the news by lowering or raising expectations when the market opens the next day. We’ll see in Chapter 17 that gaps can play an important role in short-term trading.
Prices and Volume
The Level I area also contains the current best bid and ask price along with a ratio of orders on both sides. This is important information, because it can tell you at a glance if orders are building on one side or the other. For example, if the screen reported a ratio of 350 × 1,200, that means there are 35,000 shares at bid prices and 120,000 shares at ask prices. This tells you that more traders are looking to sell than to buy, which could mean prices will move lower because of the imbalance in order size—lower supply of buyers (35,000 shares) and higher supply of sellers (120,000 shares). By watching this section, you will be able to keep up with the flow of orders from buy to sell or sell to buy. This information will help you determine which direction the stock’s price is headed.
Another set of price numbers is the current day’s high and low. These numbers give you a frame of reference concerning the price range where the stock is trading. Momentum traders will find this information helpful. You will also get a volume number for the day that is constantly updated. If you follow the same stock with any frequency, you know when it breaks out of its normal range patterns.
Bid and Ask Columns
The bid and ask columns are identical in format. The first column is the code for the entity placing the order. Some orders will come from market makers or specialists depending on the exchange, while others are placed by ECNs. With some experience, you will quickly recognize which entity is placing the order. This can be important because some big players may try to hide their moves by going through an ECN. (You can place your order through an ECN too, if you wish.) Most advanced platforms will let you specify how to route your order. This can be important when dealing with a market maker who controls a particular stock, as we’ll discover in Chapter 17. There is a list of major players in Appendix A.

Trading Tip
The market maker responsible for a particular stock is called the ax. You will often get a quicker fill by placing your order through the ax than other routes.
Like prices are grouped together in the order in which they are placed. The closer the price is to inside the market, the closer it will appear to the top of the list. Different shading shows you where there are levels or tiers of orders at the same price. This gives you an idea about supply and whether your limit order has a chance to be filled.
The size column tells you how big the order is in round lots of 100 shares. Some systems will display the size by the actual number of shares—5,000, for example.
Time and Sales Screen
The Time and Sales Screen is usually positioned to the right of the Level II quotes. This screen records the price and size of each sale. The screen is divided into minutes. Other providers list the price with the actual time and the size.
When the price ticks up it appears in green, and when it ticks down it appears in red, following traditional market-reporting colors.
TotalView for Even More Information
Nasdaq offers an additional service to augment Level II quotes called SuperMontage TotalView. SuperMontage is the electronic order execution system Nasdaq uses. The exchange was created as an electronic market, and this is the latest version of its processing system.
Its TotalView product looks deeper into the orders than Level II does, approaching the detail previously available only to market makers and other exchange professionals. For short-term traders who are deeply into the fine art of trading against major market players, this is a must-have piece of information.

Margin Call
Be careful of “analysis paralysis,” which happens when you load up with information and spend more time studying than trading. Short-term trading is about taking the best information you have on intraday pricing and making a decision. It’s not guessing, but it’s not an extended study either.
Most beginning active traders should focus on mastering Level II screens first and become comfortable with reading and understanding how they work before attempting TotalView. Once you are up to speed on Level II, you can try TotalView and see if the additional information is worth the extra cost. Several providers will give you a free trial. Check with your direct access provider about its policy.
What You See Can Be Confusing
Level II screens can appear to be a blur of numbers for an actively traded stock. Prices change and orders are filled several times a second. As we discuss in Chapter 17, you must have a plan before the market opens or you will make bad decisions in the heat of the moment. Things do happen that call for a change of plans or a reversal of plans, but you will not last long as an active short-term trader if you simply react to the market every day.
Level II quotes can tell you if the market is building depth on the buy or sell side, and that information is important in your trading decisions. You can watch the flow of orders go from one side to the other as the buyers or sellers take hold. Combine this with a screen that shows the short interest (how many traders are betting the stock will go down) and you have some useful information about where prices are headed.
However, you probably won’t see much of this the first time you look at Level II quotes of an actively traded stock. It will take some time and practice to develop an understanding of what the numbers represent and who the players are. This is why it is so important to paper trade until you develop that understanding—if not, it will be an expensive lesson.
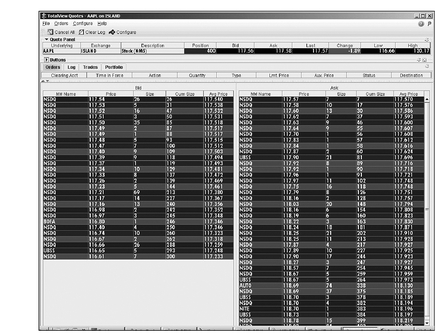
This shows a Level II TotalView screen for Apple (AAPL—Nasdaq) from Interactive Brokers’s Trader Workstation. This is the first of three screens to show how quickly the order balance can change. The three screens were taken in sequence over a period of just a few minutes. In this first screen, we see the orders are heavier on the ask side of the screen (the bottom is cut off from view).
(Photo courtesy of Interactive Brokers.)
In this second screen, we see that the orders now appear roughly balanced between bid and ask; however, if you can read the cumulative size of orders, the ask still outweighs the bid side significantly.
(Photo courtesy of Interactive Brokers.)
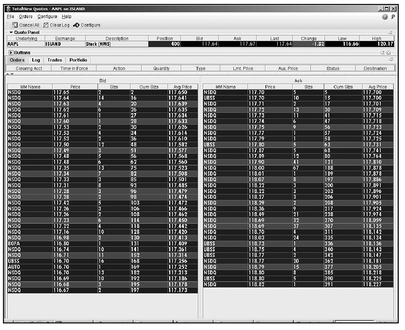
In this last screen, we see that the orders have swung from heavily weighed on the ask side of the screen to about even with the cumulative bid size. All of this changed in a matter of minutes.
(Photo courtesy of Interactive Brokers.)

Using Level II Information
Do short-term traders trade off Level II information alone? Some undoubtedly do; however, many use charts that combine intraday prices and other indicators to observe buy and sell points. Most direct access systems let you enter your trades directly from the Level II screens. This gives you pinpoint accuracy in your price and the best chance for order fill. (We’ll discuss more about buy and sell signals and order entry in Chapter 17.)
Level II services are available from all direct access providers, either as part of their standard packages or as an add-on feature. You can also subscribe to Level II information independently through a number of providers. Be cautious when looking for an independent source of Level II quotes so that you don’t get “Level II-like” quotes.

Trading Tip
Level II quotes move as fast as the stock trades. Practice on a stock that is not highly traded to get a feel for the screen and then move to more actively traded issues.
Prices for Level II services are all over the place. Many brokerages price them from $15 to $50 per month and then waive the fee if you execute a minimum number of trades per month. Independent vendors may charge $15 per month and up. Vendors also pass on an exchange fee of approximately $9 per month. The Nasdaq TotalView is often offered at about the same price. However, this is a very competitive market, so it pays to shop.
For most active investors, you will get the service through your direct access provider because you’ll want it integrated into the order-entry system. Be certain you understand the pricing for the quotes and any additional fees (such as exchange fees) that may be involved. The money you spend on Level II screens is a necessity if you want a chance to succeed as a short-term active trader.
The Least You Need to Know
• Short-term active traders must know Level II screens.
• Level II screens give traders a view of the whole market.
• Traders can see depth building on the buy or sell side.
• It takes practice to read and understand Level II screens.
..................Content has been hidden....................
You can't read the all page of ebook, please click here login for view all page.
