
If you see can see more of the whole, you are moving closer towards the truth.
Why Is There a Need for This Book?
On many data modeling consulting engagements, clients have asked the same question: “Where can we find a book showing a standard way to model this structure? Surely, we are not the first company to model company and address information.”
Many organizations develop their data models or data warehouse designs with very few outside reference materials. A large cost is associated with either hiring experienced consultants or using internal staff to develop this critical component of the system design. Often there is no objective reference material that the company can use to validate its data models or data warehouse designs or to seek alternate options for database structures.
Based on numerous experiences of using template or “universal data models” and customizing them for various enterprises, we have concluded that usually more than 50 percent of the data model (corporate or logical) consists of common constructs that are applicable to most organizations, another 25 percent of the model is industry specific (these models are covered in The Data Model Resource Book, Volume 2), and, on average, about 25 percent of the enterprise's data model is specific to that organization. This means that most data modeling efforts are recreating data modeling constructs that have already been created many times before in other organizations.
With this in mind, doesn't it make sense to have a source to use to get a head start on your data model so that you are not “reinventing the wheel” each time a company develops a new system? Organizations can save time and money by leveraging the use of common or universal database structures. Even if a company has data models from its previous systems development efforts, it is very helpful to be able to check the designs against an unbiased source in order to evaluate alternative options.
Although a large number of publications describe how to model data, very few compilations of data model examples exist in published form. This book provides both a starting point and a source for validating data models. It can help data modelers minimize design costs and develop more effective and integrated database designs.
Who Can Benefit from Reading This Book?
This book can assist many different systems development professionals: data administrators, data modelers, data analysts, database designers, data warehouse administrators, data warehouse designers, data stewards, corporate data integrators, or anyone who needs to analyze or integrate data structures. Systems professionals can use the database constructs contained in this book to increase their productivity and provide a checkpoint for quality designs.
The Need for Universal Data Models
Data modeling first gained recognition in Dr. Peter Chen's 1976 article, “Entity-Relationship Modeling,” which illustrated his newfound approach. Since then data modeling has become the standard approach used to design databases. By properly modeling an organization's data, the database designer can eliminate data redundancies, which are a key source of inaccurate information and ineffective systems.
Currently, data modeling is a well-known and accepted method for designing effective databases. Therefore, there is a great need to provide standard templates to enterprises (the term “enterprise” is used to describe the organizations for whom the models and systems are being developed) so that they can refine and customize their data models instead of starting from scratch.
Although many standards exist for data modeling, there is a great need to take data modeling to the next step: providing accessibility to libraries of common data model examples in a convenient format. Many different organizations and industries should be able to use these libraries of data models. Such universal data models can help save tremendous amounts of time and money spent in the systems development process.
A Holistic Approach to Systems Development
One of the greatest challenges to building effective systems is integration. Systems are often built separately to meet particular needs at different times within each enterprise. Enterprises need to build many systems: contact management systems, sales order systems, project management systems, accounting systems, budgeting systems, purchase order systems, and human resources systems, to name a few.
When systems are built separately, separate pools of information are created for each system. Many of these systems will use common information about organizations, people, geographic locations, or products. This means that each separate system will build and use its own source of information. A huge problem with this approach is that it is almost impossible to maintain accurate, up-to-date information because the same type of information is stored redundantly across many systems. In large organizations, it is not uncommon to see information about customers, employees, organizations, products, and locations stored in dozens of separate systems. How is it possible to know which source of information is the most current or most accurate?
Another disadvantage of building separate systems with non-integrated data structures is that the enterprise (the organization for which the models and systems are being designed) does not have the benefit of viewing integrated information. Being able to see a complete profile for a person, organization, product, or inventory item is an enormous benefit. Imagine systems that are built so that each part of an organization knows what the other part is doing, where the customer service, sales, purchasing, and accounting departments of an organization have integrated information about the people, organizations, and products of the enterprise. This integration can make a big different in the service, sales, and performance of an enterprise.
Another way to approach systems development is from a perspective that an enterprise's systems are connected and, in fact, may be viewed as one interconnected system. From this perspective, there are tremendous benefits to building an enterprise-wide framework so that systems can work together more effectively. Part of this framework should include a corporate data model (i.e., an enterprise data model) that can assist the enterprise in maintaining one of its most valued assets: information. Because each system or application may use similar information about people, organizations, products, and geographic locations, a shared information architecture can be invaluable.
The IS (information systems) industry has recognized the need for integrated designs, prompting the many corporate data modeling and corporate data warehouse modeling efforts. Unfortunately, the IS track record for building and implementing corporate data models has been very poor. Enterprises have realized that it takes a tremendous amount of time and resources to build these models.
Enter CASE (Computer-Aided Systems Engineering) tools. These tools claimed tremendous productivity and time savings when used for corporate-wide modeling efforts. While these tools help document the models, unfortunately they do not reduce the time needed to develop good corporate models.
Many enterprises have stopped building corporate data models because of their time constraints. They are looking at the track record of corporate data modeling and CASE efforts and choosing other alternatives.
Enter data warehousing. Finally, here is an approach to provide executives with the management information they need, without all the time and expense of corporate data modeling. Enterprises are now extracting the various pieces of information they need directly from their operational systems in order to build decision support systems.
The only problem with this approach is that the same problem, exists! First of all, the information in the data warehouse may be extracted from several different, inconsistent sources. If there are multiple places where customer information is being held, which system represents the most accurate source of information?
According to data warehousing principles, the transformation routines are responsible for consolidating and cleansing the data. If different departments have different needs for various pieces of data, then each department may build its own extracts from the operational systems. One department may transform the information using one algorithm; a different department may use another algorithm. For example, if two departments are extracting sales analysis information, one department may use the order entry system as its source and another department may use the invoicing system as its source. A high-level manager may view information from both data warehouses and see inconsistent results, thus questioning the credibility of all the information. This type of scenario actually compounds the initial problem of many data sources by creating even more slices of data.
This is not to say that data warehousing is the wrong approach. It is an ingenious approach that can be used extremely effectively not only to create decision support systems but also to build a migration path to an integrated environment. The data warehouse transformation process helps to identify where there are data inconsistencies and data redundancies in the operational environment. It is imperative, though, to use this information to migrate to more integrated data structures.
The answer is still to build integrated data structures in order to provide good, accurate information. The only effective way to do this is to understand how the data within an enterprise and the relationships fit together and to be able to see the data in a holistic integrated manner. It is necessary to understand the nature of the data in order to build effective systems. Instead of saying that corporate data modeling or CASE is the wrong approach because it just takes too long, the IS community needs to find a way to make it work effectively. By building common, reusable data structures, the IS community can produce quicker results and move toward integrated structures in both the transaction processing and data warehouse environments.
What Is the Intent of This Book and These Models?
Most data modeling books focus on the techniques and methodologies behind data modeling. The approach behind this book is dramatically different. This book assumes that the reader knows how to model data. Data modeling has been around long enough that most information systems professionals are familiar with this concept and will be able to understand this book. Therefore, this book makes no efforts to teach data modeling principles, except by example. Data modelers can use this book, and their previous experience, to build on and refine the data model examples contained within the book in order to develop more customized data models. Essentially, it gives the modeler fundamental tools and building blocks that can be reused. Therefore, the modeler can be more productive and save a great deal of time by starting with standard data models instead of building data models from scratch.
Furthermore, the reader can also benefit from the data warehouse models that are applicable to decision support environments. This book not only presents examples of data warehouse designs, but it also explains in detail how to convert the logical data models to an enterprise-wide data warehouse, then to departmental data marts. The logical data models and data warehouse models presented here are applicable across a wide variety of enterprises.
These models are intended to be a starting point for developing logical and data warehouse data models for an enterprise. Each enterprise will have its own detailed requirements; the models will need to be modified and customized in order to be implemented for a specific enterprise. Because the data warehouse data models reflect actual database designs (as opposed to logical data models), they are even more dependent on the business needs of the specific enterprise wishing to use these models. In addition, the models in this book can be used to validate an enterprise's existing data models.
The models presented in the first part of this book (Chapters 2 through 9) are logical data models, not physical database designs. Therefore, these models are normalized and may require some denormalization when designing the physical database. Consistent with this point, the logical data models do not include any derived attributes because derived attributes do not add anything to the information requirements of a business. They merely serve to enhance performance of the physical database.
These logical data models represent possible data requirements for enterprises. They do not include many of the business processing rules that may accompany data models. The data models generally provide all the information needed to enforce business rules; however, the reader is advised in many cases that additional business rules may need to be developed to supplement the data models. Examples of the need for business rules are provided throughout this book.
These data models were designed to benefit many different industries and enterprises. They were picked specifically because they represent very common data constructs that appear in most organizations. Within these models, whenever there was a data modeling decision that may have been dependent on a specific enterprise, the most flexible data modeling option was chosen in order to accommodate many different enterprises.
Furthermore, the chapter on Implementing Universal Data Models provides an explanation on how to use the data models to build an enterprise data model, logical data models, and physical database designs. Detailed examples are provided for how to transform the data models into a physical database design that can be implemented for a database management system.
What Is New in the Second Edition of the Data Model Resource Book?
The second edition of the Data Model Resource Book provides many enhancements and additional models. There are a great number of updates and additions; the following points describe them at a high level.
A great majority of the data models in the original Data Model Resource Book have been significantly enhanced with additional entities, attributes, and relationships.
Many of the data models have slightly different and more enhanced data structures. Based on numerous usages and implementations of these models, the models have been updated to reflect even more effective data structures.
A number of new chapters have been added to the second edition. Chapter 14 provides additional star schemas that can be used as templates for data analysis solutions. Chapter 15 provides an explanation of how to use the universal data models to create an enterprise data model, a logical data model, and a physical database design. This chapter provides examples of customizing enterprise and logical data models and several physical database design examples for implementing one of the universal data models. A great number of new universal data models have been added to the already existing comprehensive library from the first edition. Table 1.1 provides a listing of the new models.
Table 1.1 Data Models Added in Second Edition
| CHAPTER | NEW DATA MODELS THAT HAVE BEEN ADDED FROM THE FIRST EDITION TO THE SECOND EDITION |
| 2 Parties | 2b Person-alternate model 2.4 Party roles 2.5 Specific party relationships 2.6 Common party relationships 2.11 Facility versus contact mechanism 2.12 Party communication event 2.13 Communication event follow up event |
| 3 Products | 3.4 Product feature 3.10a Products and parts 3.10b Products and parts-alternate model |
| 4 Orders | 4.3 Sales order parties and contact mechanisms 4.4 Purchase order parties and contact mechanisms 4.6 Order adjustments 4.12 Agreement roles |
| 5 Shipments | 5.4 Shipment receipt for incoming shipments 5.5 Item issuances for outgoing shipments 5.6 Shipping documents 5.7 Shipment route segments |
| 6 Work Efforts | 6.1 Work requirement 6.2 Work requirement roles 6.12 Work effort results |
| 7 Invoices | 7.8a Invoice payments 7.8b Invoice payments-alternate model 7.9 Financial accounts, withdrawals and deposits |
| 8 Accounting | 8.2 Business transactions versus accounting transactions 8.4 General ledger account associations and subsidiary ledger accounts 8.7 Budget revision 8.8 Budget revision review 8.9 Budget scenario |
| 9 Human Resources | 9.8 Benefits tracking 9.10 Employee application 9.11 Employee skills and qualifications 9.12 Employee performance 9.13 Employee termination |
| 12 Star Schema Designs for Sales Analysis Star Schema Designs | 12.2 Transaction oriented sales data mart |
| 14 Additional Star Schema Designs | 14.1 Inventory management star schema 14.2 Purchase order star schema 14.3 Shipment star schema 14.4 Work effort star schema 14.5 Financial analysis star schema |
| 15 Implementing Universal Data Models | 15.2. Customized party contact mechanism (using different terms) 15.3 Additions to the party contact mechanism model 15.4 Detailed model for sales force (showing a customized version for a particular application) 15.6 Party roles and relationships physical design option 1 15.7 Party roles and relationships physical design option 2 15.8 Party roles and relationships physical design option 3 |
Conventions and Standards Used in This Book
The following section describes the naming standards and diagramming conventions used for presenting the models in this book. Details are provided for entities, subtypes, attributes, relationships, foreign keys, physical models, and illustration tables.
An entity is something of significance about which the enterprise wishes to store information. Whenever entities are referenced throughout the book, they are shown in capital letters. For example, ORDER represents an entity that stores information about a commitment between parties to purchase products. When the name of an entity is used in a sentence to illustrate concepts and business rules, it may be shown in normal text—for example, “Many enterprises have mechanisms such as a sales order form to record sales order information.”
The naming conventions for an entity include using a singular noun that is as meaningful as possible to reflect the information it is maintaining. Additionally, the suffix TYPE is added to the entity name if the entity represents a classification of information such as an ORDER TYPE (i.e., sales versus purchase order) rather than a specific instance of a real thing such as an ORDER (“order #23987”).
The data models in this book include TYPE entities on the diagrams, even though they usually have only an id and a description. These entities are included for completeness and to show where allowable values or look-ups are stored.
Entities are included in the data model if it is a requirement of the enterprise to maintain the information included in the entity. For example, if an enterprise doesn't really care about tracking the tasks associated with a shipment, then even though this information exists in the real world, the data model should not incorporate this information because it may not be important enough information for the enterprise to maintain.
Entities are represented by rounded boxes. Figure 1.1 shows an example of the entity ORDER.
Figure 1.1 An entity.

A subtype, sometimes referred to as a subentity, is a classification of an entity that has characteristics such as attributes or relationships in common with the more general entity. LEGAL ORGANIZATION and INFORMAL ORGANIZATION are, for example, subtypes of ORGANIZATION.
Subtypes are represented in the data modeling diagrams by entities inside other entities. The common attributes and relationships between subtypes are shown in the outside entity, which is known as the supertype. The attributes and relationships of the supertype are therefore inherited by the subtype. Figure 1.2 shows the supertype ORGANIZATION and its sub-types LEGAL ORGANIZATION and INFORMAL ORGANIZATION. Notice that the name applies to the supertype ORGANIZATION and the federal tax ID applies only to the LEGAL ORGANIZATION subtype. It is therefore shown at the subtype level of LEGAL ORGANIZATION because it applies only to that subtype. Both LEGAL ORGANIZATION and INFORMAL ORGANIZATION would have a name because they will inherit the values of the supertype.
Figure 1.2 Subtypes and supertypes.

Supertypes may have many levels. Figure 1.2 shows that a CORPORATION and GOVERNMENT AGENCY are subtypes of LEGAL ORGANIZATION, which is also a subtype of ORGANIZATION. Thus boxes may be in boxes down to any level to illustrate which subtypes inherit the attributes and relationships of the parent supertype (its outer box).
The subtypes within an entity should represent a complete set of classifications (meaning that the sum of the subtypes covers the supertype in its entirety) and at the same time be mutually exclusive of each other (an exception of handling separate sets of non-mutually exclusive subtypes will be covered in the next section). Many times the data model includes an OTHER...subtype to provide for other possible classifications of the entity that may be defined by the enterprise using the model. For example, each INFORMATION ORGANIZATION may be a TEAM, FAMILY, or OTHER INFORMAL ORGANIZATION.
While the subtypes represent a complete set of possible classifications, there may be more detailed subtypes that are not included in the data model; instead, they may be included in a TYPE entity. In this case, subtypes are shown in two places on a model: as a subtype and in a TYPE entity that shows the domain of allowed types for the entity.
Non-Mutually Exclusive Sets of Subtypes
Sometimes, subtypes are not mutually exclusive; in other words, supertypes may be subtyped different ways and more than one set of subtypes may apply to the same supertype.
Consider Figure 1.3, which shows that a REQUIREMENT may be subtyped different ways. A REQUIREMENT may be from a customer (CUSTOMER REQUIREMENT) or may represent an internal requirement of the enterprise (INTERNAL REQUIREMENT). At the same time, the REQUIREMENT may be a requirement that states the need for a specific product (PRODUCT REQUIREMENT) or a requirement that states the need for work to be done (WORK REQUIREMENT).
Figure 1.3 Non-mutually exclusive subtypes and supertypes.

Therefore, more than one subtype could occur for a REQUIREMENT; for instance, it could be a CUSTOMER REQUIREMENT and PRODUCT REQUIREMENT. Figure 1.3 illustrates a convention to show mutually exclusive sets of subtypes by having a box around each set of possible subtypes with no name for the box. The boxes merely serve to establish when there is more than one set of subtypes for a supertype.
An attribute holds a particular piece of information about an entity, such as the order date on an order. Attributes are identified in the text of the book by boldface, lowercase letters such as the previous order date example.
Attributes may be part of the unique identifier of an entity (also referred to as a primary key), mandatory, or optional. The primary key attribute(s) is identified by a “#” sign preceding the attribute name on the diagram. Mandatory attributes are signified by a “*” before the attribute name. Optional attributes have an “o” before the attribute. Figure 1.4 shows that the ORDER entity has order ID as a primary key attribute, order date as a mandatory attribute, and entry date as an optional attribute.
Figure 1.4 Attributes.

Certain strings included in an attribute's name have meanings based on the conventions shown in Table 1.2.
Table 1.2 Conventions Used in Attribute Naming
| STRING WITHIN ATTRIBUTE NAME | MEANING |
| ID | System-generated sequential unique numeric identifier (i.e., 1, 2, 3, 4,…) |
| Seq id | System-generated sequence within a parent ID (e.g., order line sequence number) |
| Code | Unique mnemonic—used to identify user-defined unique identifiers that may have some meaning embedded in the key (i.e., an example of a geo code to store Colorado may be “CO”) |
| Name | A proper pronoun such as a person, geographical area, organization |
| Description | The descriptive value for a unique code or identifier |
| Ind (indicator) | A binary choice for values (i.e., yes/no or male/female) |
| from date | Attribute that specifies the beginning date of a date range and is inclusive of the date specified |
| thru date | Attribute that specifies the end date of a date range and is inclusive of the date specified (to date is not used because thru date more clearly represents an inclusive end of date range) |
Relationships define how two entities are associated with each other. When relationships are used in the text, they are usually shown in lowercase as a normal part of the text. In some situations, where they are specifically highlighted, they are identified by boldface lowercase letters. For example, manufactured by could be the way a relationship may appear in the text of this book.
Relationships may be either optional or mandatory. A dotted relationship line next to an entity means that the relationship from that entity is optional, and a continuous line means that the relationship is mandatory (the relationship has to exist for all occurrences of each entity). Figure 1.5 shows a relationship that “each SHIPMENT must be shipped from one and only one POSTAL ADDRESS.” This means that the postal address for each shipment must be specified in order to create a shipment instance. The same relationship has an optional aspect when read in the other direction: “Each POSTAL ADDRESS may be the source of one or more SHIPMENTs.” Hence, there could be a postal address which has not been used for a shipment yet.
Figure 1.5 Mandatory versus optional relationships.

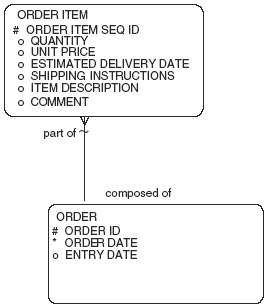
Relationships may be one-to-one, one-to-many, or many-to-many. This is generally known as the cardinality of the relationship. The presence of a crowsfoot (a three-pronged line that looks like a crow's foot) defines whether an entity points to more than one occurrence of another entity. Figure 1.6 shows that “each ORDER must be composed of one or more ORDER ITEMs” because the crows-foot is at the ORDER ITEM side. The other relationship side states that “each ORDER ITEM must be part of one and only one ORDER.” A one-to-one relationship doesn't have any crowsfeet on the relationship, and a many-to-many relationship has crowsfeet at both ends of the relationship. Sometimes, one-to-many relationships are referred to as parent-child relationships.
Figure 1.6 One-to-many relationship.
Sometimes the term “over time” needs to be added to the relationship sentence to verify whether the relationship is one-to-many. For instance, an ORDER may appear to have only one ORDER STATUS; however, if status history is required, then each ORDER may be in the status of by one or more ORDER STATUSes, over time.
The data models in the book have very few one-to-one relationships because most of the time one-to-one relationships can be grouped together into a single entity when normalized. The data model diagrams do not show many-to-many relationships because many-to-many-relationships are almost always broken out into intersection entities.
A foreign key is defined as the presence of another entity's (or table's) primary key in an entity (or table). For example, in Figure 1.6 the order ID from the ORDER entity is part of the ORDER ITEM entity; therefore, it is a foreign key. Any one-to-many relationship indicates that the primary key of the entity on the one side of the relationship is brought into the entity on the many side of the relationship. Some data modelers show this foreign key as an attribute of the entity (this is sometimes known as key migration). The data models in this book do not show the foreign keys of entities as attributes because this is redundant.
Instead, the relationship itself identifies the foreign key. In Figure 1.6, the order ID is not shown as an attribute in the ORDER ITEM entity because the one-to-many nature of the relationship reveals that it is a foreign key.
A diagramming convention in this book is to use a tilde (“~”) relationship line to indicate that the inherited foreign key is part of the primary key of the child entity. The tilde (“~”) line across the relationship in Figure 1.6 indicates that the order ID is part of the ORDER ITEM entity primary key. This convention allows a shorthand notation, providing for the primary key to be identified as a combination of the primary key attributes (identified with a “#”) as well as the primary keys of the entity to which the relationship with a tilde is pointing.
Therefore the primary key to the ORDER ITEM is the order item seq ID plus the primary key of the order, order id.
This convention allows a shorthand notation to document the primary keys of each entity without taking up a great deal of space by repeated foreign keys that form part of another entity's primary key. This notation also shows the semantics of the primary key by clearly specifying the relationships that make up the primary key as well as any attributes with a “#” symbol next to them.
Intersection or Association Entities to Handle Many-to-Many Relationships
Intersection entities are also known as associative entities or cross-reference entities. They are used to resolve many-to-many relationships by cross-referencing one entity to another. Often they include additional attributes that may further delineate the relationship. Figure 1.7 shows a many-to-many relationship between a PARTY and a CONTACT MECHANISM that is resolved in this way. The diagram indicates that a PARTY may be contacted via more than one CONTACT MECHANISM such as a POSTAL ADDRESS, TELECOMMUNICATIONS NUMBER, or ELECTRONIC ADDRESS because a party may have many ways to be contacted. Conversely, a CONTACT MECHANISM may be used by more than one PARTY. For instance, many people may have the same work address or work phone number. This many-to-many relationship is resolved by the intersection entity PARTY CONTACT MECHANISM.
Figure 1.7 Many-to-many relationships.

Each associative entity inherits the key to each of the entities it intersects. Therefore the tilde (“~”) is always used in the reference relationships of an associative entity to show that the associative entity inherits the key of each of the referenced entities (see “foreign key inheritance” mentioned in the last section). For example, the party id and the contact mechanism id are parts of the primary key to PARTY CONTACT MECHANISM, along with the from date.
Notice that in all the examples given, each relationship has two relationship names associated with it that describe the relationship in both directions. The relationship names should be combined so that they read as a complete sentence, as shown in the following format: “Each ENTITY {must be/may be} relationship name {one and only one/one or more} ENTITY, over time,” where the appropriate choices are filled in.
In the models presented, the crowsfeet on the relationships generally point up and to the left in order to provide a consistent mechanism for reading the diagrams. This tends to organize the data models in a more understandable format.
Exclusive arcs are used to identify relationships where an entity is related to two or more other entities, but only one relationship can exist for a specific entity occurrence. The exclusive arc is represented by a curved line going through two or more relationship lines. Figure 1.8 shows an example of an exclusive arc. The relationships are read as “Each INVENTORY ITEM must be either located at one and only FACILITY or must be located within one and only one CONTAINER, but not both.” This communicates that inventory items are stored at one of two types of levels: They are either located at facilities such as a warehouse or stored within containers such as a bin that is located within a facility.
Figure 1.8 Exclusive arcs.

Recursive relationships are relationships that show how one entity is related to itself. For example, a recursive relationship could be modeled either via a relationship pointing from an entity to itself or via a many-to-many-relationship. This depends on if it is a many-to-many recursion or a one-to-many recursion. It is possible for an entity to have many recursive relationships.
Figure 1.9 shows an example of a one-to-many recursion around the WORK EFFORT entity to show that work efforts may be redone. It also shows a many-to-many recursion that is resolved by the intersection entity WORK EFFORT ASSOCIATION to show that work efforts may be either dependent on other work efforts (WORK EFFORT DEPENDENCY subtype) or broken down into several lower-level work efforts (WORK EFFORT BREAKDOWN subtype).
Figure 1.9 Recursive relationships.

The data warehouse models and diagrams (Chapters 10 through 14) as well as some of the models in Chapter 15, represent physical database designs. The
same notations can be used as previously stated with the exception that because these models represent physical database designs, each box represents a table, and the field names are columns.
Conventions Used for Illustration Tables
Many parts of the data models are illustrated via tables that contain possible values for attributes. Each illustration table is normally defined to show a specific entity and the relevant information from related entities. For instance, there may be a table illustrating the ORDER ITEM entity, as shown in Table 1.3.
Table 1.3 Order Item

In order to illustrate the details of an ORDER ITEM, Table 1.3 brings in some attribute information from the ORDER entity. Whenever data from each illustration table is referenced in the text of this book, it is surrounded by double quotes. For instance, the text may refer to specific order “12930,” order item seq id “1”, which has a comment of “Need this item urgently.”
Conventions Used to Reference Figures
Because there are two volumes for the Data Model Resource Book, figures are referenced by the following notation:
| Vx:Figure x.x | |
| Where | Vx signifies a reference to either Volume 1 or Volume 2 |
| and | Figure x.x references a specific figure in that volume. |
For example, V1:2.1 references Figure 2.1 in Volume 1, the Organization data model. V2:2.2 references Figure 2.2 (Parts and products) in the second volume. If there is no Vx in front of the reference, then the reader may assume that the figure is in the current volume.
The Companion Electronic Product
This book and its appendices provide very detailed descriptions of the models discussed. The diagrams lay out all the relationships, the mandatory attributes and columns, the primary keys, and they even include some optional attributes. The appendices include the physical details for the attributes and columns, such as the datatype and size. With this information, it would be possible for a data modeler or database designer to recreate these models in the tool of his or her choice or write the SQL code to build them in a database.
This, however, would take a substantial amount of time and opens the possibility of data entry errors. To assist those interested in quickly implementing the models described in these pages, the models are provided in electronic form. The Demo CD-ROM that accompanies this book offers a free demonstration of the electronic models. The full set of models for Volume 1 is sold separately. See “How to Use the Electronic Product” at the end of this book for details on purchasing, accessing, and using the CD-ROM.
The demo files on this CD-ROM contain a sample of SQL scripts derived directly from the models in the book. In the full version, all the entities, attributes, tables, and columns discussed are implemented with this code. Scripts are provided for several database platforms. There are also generic standard SQL scripts that could be used with other ODBC databases.
Because the CD-ROM includes standard SQL scripts, they should work with not only the current versions of these database management systems but also with future versions. This includes object-relational databases assuming that they support relational designs. The constructs in the book are, of course, also generally applicable to any relational or object-relational database.
Use of the scripts on the CD-ROM will allow an enterprise to more rapidly deploy the models presented in this book. In addition to the time savings, there is obviously a cost savings as well (nobody has to type in all the definitions or write SQL scripts). Once the scripts have been run, the models could be reverse-engineered into the enterprise's favorite CASE tool (most popular CASE tools provide a reverse-engineering feature). Once the models have been brought into a repository, they are easily accessible and may be customized for a specific enterprise's needs. Additionally, they can be used to jump-start the development of corporate data models, new applications, data warehouse designs, or decision support systems.
The CD-ROM also contains the data model diagrams in elecronic formats and a series of reports that list and cross-reference the subject data areas, entities, attributes, tables, and columns of the data models.
The remainder of this book will provide many examples of universal data models and data warehouse designs that can assist in increasing the productivity of system development efforts. Detailed examples of how to implement these models will be provided in chapter 15, “Implementing Universal Data Models.”