
If you ask people what makes a project successful, "a realistic schedule" usually tops the list. But ask them to be more specific, and several characteristics of a realistic schedule emerge. A realistic schedule:
Includes a detailed knowledge of the work to be done
Has task sequences in the correct order
Accounts for external constraints beyond the control of the team
Can be accomplished on time, given the availability of skilled people and enough equipment
Finally, a realistic schedule takes into consideration all the objectives of the project. For example, a schedule may be just right for the project team, but if it misses the customer's completion date by a mile, then it's clear that the whole project will need reassessment. Building a project plan that includes all the necessary parts and achieves a realistic balance between cost, scheduling, and quality requires a careful, step-by-step process.
Chapter 6 dealt with the first step in planning the project: the work breakdown structure. This chapter explains planning steps two through five. Each planning step relies on the one preceding it, and each adds a new element to the plan. You can use the diagram in Figure 6.1 (see page 127) as a guide in this chapter.
Here is a quick recap of the steps involved in planning a project. The first two actions prepare the groundwork for planning and so can be considered preplanning activities. The remaining five steps develop the detailed plan.
Create the project definition. The project manager and the project team develop the statement of work, which identifies the purpose, scope, and deliverables for the project and defines the responsibilities of the project team (Chapters 3 and 4).
Develop a risk management strategy. The project team evaluates the likely obstacles and creates a strategy for balancing costs, schedule, and quality (Chapter 5).
Build a work breakdown structure. The team identifies all the tasks required to build the specified deliverables. The scope statement and project purpose help to define the boundaries of the project.
Identify task relationships. The detailed tasks, known as work packages, are placed in the proper sequence.
Estimate work packages. Each of these detailed tasks has an estimate developed that includes the amount of labor and equipment needed and the duration of the task.
Calculate initial schedule. After estimating the duration of each work package and figuring in the sequence of tasks, the team calculates the total duration of the project. (This initial schedule, while useful for planning, will probably need to be revised further down the line.)
Assign and level resources. The team adjusts the schedule to account for resource constraints. Tasks are rescheduled in order to optimize the use of people and equipment used on the project.
These steps generate all the information required to understand how a project will be executed. The steps are systematic, but they don't necessarily come up with the "right answer." It may take several iterations of these steps to find this answer, which is the optimal balance between cost, schedule, and quality. Chapter 9 will address the challenge of finding the optimal cost-schedule-quality equilibrium for a project, but right now, we will look at the step-by-step instructions for creating a project plan. Step one is the creation of a work breakdown structure, which was covered in the previous chapter. We start here with step two, which involves identifying the relationships between the different tasks.

The sequence in which detailed tasks—work packages—are performed is determined by the relationship between the tasks. To illustrate this point, consider the following five tasks from the landscaping project described earlier. These tasks constitute a subset of that project:
Acquire lawn materials
Remove debris
Prepare soil
Plant lawn seed
Plant shrubs
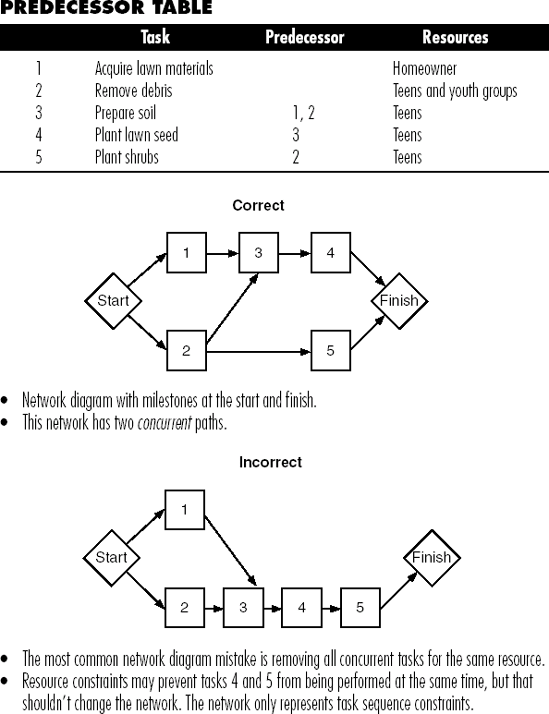
As the homeowner and the teenage children who will be working on this project contemplate these tasks, the question arises: What is the proper sequence? Any time a series of tasks is performed, there will be sequence constraints— that is, certain tasks that must be performed before others. Sequence constraints are governed by the relationships of different tasks. For instance, rocks, weeds, and other debris must be removed before the lawn seed can be planted. Performing these tasks in the reverse order doesn't make sense because the seed would be lost when the weeds were removed. Figure 7.1 shows both a predecessor table and a network diagram, two different ways of recording sequence constraints. A predecessor table is a common way to display task relationships. (In fact, this is exactly the way most project management software records the relationships.)
Notice that tasks 1 and 2 have no predecessors. Either one can be done first, or, if there are enough people, they could be done at the same time. Tasks that can be performed at the same time are known as concurrent tasks.
There are just two basic rules when graphing task relationships with a network diagram:
Define task relationships only between work packages. Even though a project might have hundreds of work packages and several levels of summary tasks, keep the sequence constraints at the work package level. Summary tasks, remember, are simply groups of work packages, so it wouldn't make sense to put a task relationship between a summary task and its work package. (The only exception to this rule occurs, occasionally, on very large projects, where networks can be created to illustrate project relationships at the summary level.)
Task relationships should reflect only sequence constraints between work packages, not resource constraints. Changing a network diagram because of resource constraints is the most common error in building network diagrams. The fact that there aren't enough people or other resources to work on multiple tasks at the same time is irrelevant here. Regardless of resources, the tasks will still have to be performed in the same order. (Figure 7.1 demonstrates the mistake of rearranging the network because the same resource, in this case, the teenagers, are working on tasks 4 and 5.)
In setting up the sequence of events, many project managers find it useful to mark significant events in the life of a project. These markers—called milestones—are often used in work breakdown structures and network diagrams (see Figure 7.2). Milestones have zero duration, so adding them to a project doesn't affect the schedule at all. There are three great reasons to use milestones:
Project start and finish milestones are useful anchors for the network. The milestones don't change anything on the project, but many people find it easier to read.
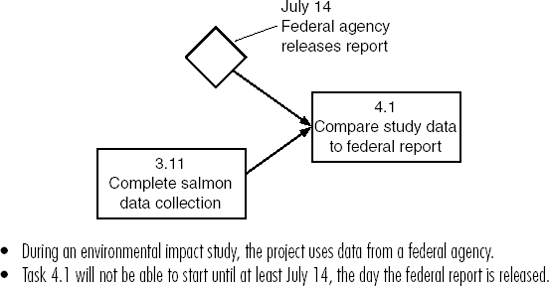
Milestones can be used to mark input from one party to another. Many projects are dependent on inputs from certain external sources (they have external dependencies). For example, a government agency might release an environmental impact report for an electric utility on a certain date. A project in that electric utility can use that release date as a milestone. Figure 7.2 shows a milestone representing an external dependency.
A milestone can represent significant events that aren't already represented by a work package or summary task. For example, if a firm receives progress payments based on work accomplished, these payment points could be shown with milestones.
Milestones are useful to show major progress points, but the real progress indicators remain the detailed work packages. Every work package has specific completion criteria and a tangible result—which is the ultimate progress indicator.
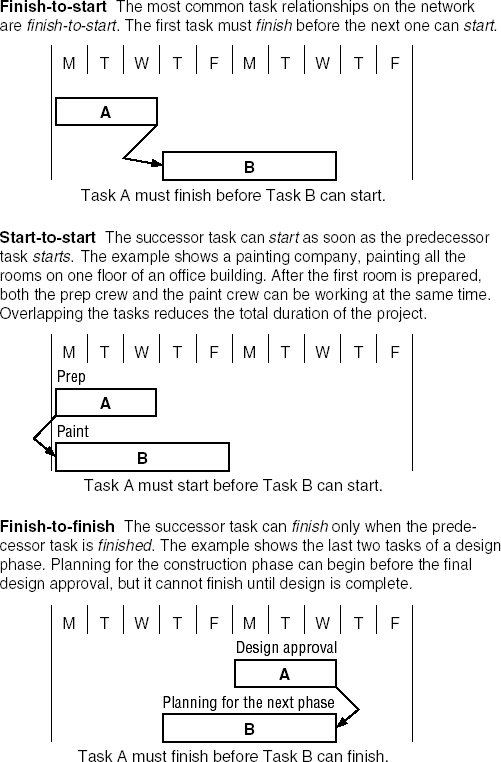
Finish-to-Start Relationships
The finish-to-start relationship states that one task must be completed before its successor task can begin. The network diagrams in this chapter all follow this simple assumption because it is the most common, but there are other types of relationships. Tasks with start-to-start (SS) relationships allow the successor task to begin when the predecessor begins. Finish-to-finish (FF) tasks can start independently of each other, but the successor cannot finish until the predecessor finishes. Figure 7.3 shows the value of using these other types of task relationships.
In order to determine the cost and duration of an entire project, it's necessary to build a cost and schedule estimate for each work package; this is called bottom-up estimating. A lot of information is generated in the estimating process, so it is critical to record it in a systematic manner. (Table 7.1 shows the work package estimates for the home landscape project. Tables 7.2 to 7.5 illustrate some of the variables that affect work package estimates.)
The schedule estimate for a task measures the time from initiation to completion. This estimate is usually referred to as duration of a task. When building a schedule estimate, it's important to include all the time the task will span. For instance, it may take only 1 day to order materials, but if it takes 10 days for delivery, the total duration of the task will be 11 days. Similarly, while a certain decision might take only two hours to make, it might be more realistic to estimate duration at 5 days if the decision maker is likely to be busy at that time.
Cost estimates come from four sources:
Labor estimates. These project how much human effort will be put into a task. If three people work 8 hours a day for three days, the total labor estimate will be 72 hours. On small work packages, labor is estimated in hours. (At the project level, labor can be such a large item that it is sometimes expressed in years.) In addition to recording the labor estimate, you will need to record the skill requirement. For example, a task might specifically require an electrician eight hours a day for three days. If more than one skill type is required, list them all.
Equipment estimates. Equipment requirements need to be identified at the work package level. These estimates then become the basis for estimating the total equipment cost for the project. Equipment, in this case, includes the tools necessary to perform the task, from cranes to specialized software. (Don't bother to list common tools such as word processors, copy machines, or hammers.) Like labor, equipment use should be estimated in hours.
Materials estimates. Materials for the project can be a major source of project cost—or virtually nonexistent. While a construction project may have a significant portion of its total cost represented by raw materials, a project to institute new hiring guidelines will have no raw materials. Software development projects have no raw materials, but an information system project to install commercial off-the-shelf (COTS) software will have to include the cost of the software. Even though materials costs can be a major portion of the project's cost, total materials cost should be estimated from the product specifications—not estimated from the bottom up using the work breakdown structure. (Chapter 8 covers project budget development in greater detail.) Including materials in the work package estimate helps to identify exactly when each of the materials will be needed; these schedule requirements, in turn, will determine order and delivery dates.
Table 7.1. HOME LANDSCAPE PROJECT WORK PACKAGE ESTIMATES
ID
Task Name
Duration
Labor Hours
Resource Names
On task 1, both the homeowner and teens are working 4 hours per day.
1
Design home landscape
5 days
80 hrs.
Homeowner [0.5], Teens [1.5]
2
Put in lawn
3
Acquire lawn materials
2 days
64 hrs.
Homeowner, Teens [3]
4
Install sprinkler system
5
Identify sprinkler locations
1 day
Fixed fee, 8 hrs.
Contractor homeowner
6
Dig trenches
2 days
Fixed fee
Contractor
7
Install pipe and hardware
3 days
Fixed fee
Contractor
8
Cover sprinkler system
1 day
Fixed fee
Contractor
9
Plant grass
10
Remove debris
4 days
256 hrs.
Teens [3], Youth group [5]
11
Prepare soil
4 days
96 hrs.
Teens [3], rototiller
12
Plant lawn seed
1 day
16 hrs.
Teens [2]
13
Plant shrubs
6 days
96 hrs.
Teens [2]
14
Build fence
15
Acquire fence material
2 days
16 hrs.
Homeowner
16
Install fence
17
Mark fence line
1 day
32 hrs.
Homeowner, Teens [3]
18
Install posts
5 days
80 hrs.
Teens [2]
19
Install fencing and gates
6 days
144 hrs.
Teens [3]
20
Paint/stain fence and gates
3 days
72 hrs.
Teens [3]
Table 7.2. WORK PACKAGE ESTIMATE: EXAMPLE 1
Task description: During an environmental study, a power company counts salmon during a 40-day salmon run.
Assumption: The federal agency overseeing the power company dictates the length of the study.
Duration: 40 days
Materials: None
Labor and Equipment Table
Type
Average Use
Total
Increasing the number of people on this task does not change the duration, but it could increase the accuracy of the study.
Salmon specialist
1 @ 10 hrs./day
400 hrs.
Field technician
2 @ 10 hrs./day
800 hrs.
Truck
1 all day
40 days
Fixed-price bids. Fixed-estimate costs can replace the three previous cost sources. For example, a vendor or subcontractor might make a fixed-price bid that includes labor, equipment, and materials. Fixed-price bids mean that the vendor takes responsibility for costs; should there be overruns, the cost to the project will not change. (The landscape project in Table 7.1 includes fixed-price bids by the sprinkler contractor.)
Is it really necessary to concentrate on costs when trying to build a realistic schedule? It is, because each cost represents a resource constraint. Costs such as hiring subcontractors and purchasing materials will constrain the schedule. Later on, the schedule will be adjusted to account for these resource constraints (this is the fifth step of planning), but before adjusting the schedule we need to identify all the resource requirements, one work package at a time.
How the Amount of Labor Relates to Duration
How long it takes to perform a task usually depends on how many people are assigned to do it. When you estimate the duration of a task, you will normally figure in the amount of available labor. In the example in Table 7.3, when a training manager added one more technician to a task involving a software upgrade, this addition, plus longer working days, cut the duration of the task from five days to two.
Table 7.3. WORK PACKAGE ESTIMATES: EXAMPLE 2
Task description: During a training project, software is upgraded on 20 workstations in a training room. |
Assumption: The average time to install the software is 2 hours per workstation. Testing is 1 hour per workstation. Only 1 person can work on one workstation at a time. |
First Estimate |
Duration: 5 days Materials: 20 copies of the new software |
Labor and Equipment Table |
Type | Average Use | Total |
|---|---|---|
The training manager did not want the training room out of use for a whole week. In fact, he wanted the upgrade done over a weekend so the training room didn't lose any availability. | ||
Computer technician | 1 @ 8 hrs./day | 40 hrs. |
Tester (user or technician) | 1 @ 4 hrs./day | 20 hrs. |
Software test kit | 1 per tester | 1 test kit |
Revised Estimate |
Duration: 2 days Materials: 20 copies of the new software |
Labor and Equipment Table |
Type | Average Use | Total |
|---|---|---|
By adding 1 computer technician and working longer days, the duration was cut from 5 days to 2. | ||
Computer technician | 2 @ 10 hrs./day | 40 hrs. |
Tester (user or technician) | 1 @ 10 hrs./day | 20 hrs. |
Software test kit | 1 per tester | 1 test kit |
The work package estimates for the home landscape project in Table 7.1 include an example of using extra people to reduce the duration of a task. When the project team (the homeowner and the family's three teenagers) estimated task 10, "Remove debris," they agreed it would be a long, unpleasant task if they worked on it alone. So they recruited some of the members of their local youth group to help them for a few days. With eight people working on the task, it can be accomplished in four days.
Table 7.4. WORK PACKAGE ESTIMATES: EXAMPLE 3
Task description: A government agency is mapping a forest. Aerial photography of the entire area is the first step in creating the maps. |
Assumption: An aerial photography subcontractor rents airplanes (complete with pilots and photographers). The agency has one scientist ride with every airplane. The forest is broken into 60 squares. They can photograph one square per day. During the flight, a ground technician stays in radio contact with the scientist to answer mapping questions. |
First Estimate |
Duration: 60 days |
Materials: None |
Labor and Equipment Table |
Type | Average Use | Total |
|---|---|---|
The forest area traditionally has so much cloudy weather that the agency estimates there will be only one clear day out of every three, but the photography needs to take place during the three months of summer when there is no snow. Given this requirement, they decide to fly two airplanes every clear day. On days they can't fly there is no airplane cost and the scientist and ground technician can work on other things. A single ground technician can stay in contact with both airplanes. | ||
Scientist (in plane) | 1 @ 8 hrs./day | 480 hrs. |
Airplane | 1 @ 8 hrs./day | 480 hrs. |
Ground technician | 1 @ 8 hrs./day | 480 hrs. |
Revised Estimate |
Duration: 90 days |
Materials: None |
Labor and Equipment Table |
Type | Average Use | Total |
|---|---|---|
Since one ground technician can talk to both airplanes, the total labor for that person is cut in half. The expected hours for the scientist and the airplanes stay the same. The average use estimates are used during the resource-leveling step to indicate the average amount of time the scientists and ground technician will have available to work on other projects during this 90-day period. | ||
Scientist (in plane) | 2 @ 2.7 hrs./day | 480 hrs. |
Airplane | 2 @ 2.7 hrs./day | 480 hrs. |
Ground technician | 1 @ 2.7 hrs./day | 240 hrs. |
Table 7.5. WORK PACKAGE ESTIMATES: EXAMPLE 4
Task description: A systems analyst is working on three projects at the same time. One of her project managers asked her to estimate the design of a subsystem. |
Assumption: She will continue to work on all three projects simultaneously. |
First Estimate |
Duration: 40 days |
Materials: None |
Labor and Equipment Table |
Type | Average Use | Total |
|---|---|---|
Her project manager needed the design performed much faster and suggested he could get another analyst to work with her part-time. | ||
System analyst | 1 @ 2.5 hrs./day | 100 |
Revised Estimate |
Duration: 30 days |
Materials: None |
Labor and Equipment Table |
Type | Average Use | Total |
|---|---|---|
Adding people to a design task can speed up some of the work, but much of it will be done together so it results in an increase in the total labor cost. It is possible the resulting design will be better, but that is another assumption. Then the project manager asked her what it would take to get it done the fastest. "Talk to my other project managers and arrange to get me completely off those projects for a few weeks so I can concentrate 100 percent on yours." | ||
System analyst | 2 @ 2.5 hrs./day | 150 |
Revised Estimate |
Duration: 10 days |
Materials: None |
Labor and Equipment |
Type | Average Use | Total |
|---|---|---|
Not only was she able to spend more time per day on this task, but she knew if she was able to concentrate on it 100 percent she would be more productive. | ||
System analyst | 1 @ 8 hrs./day | 80 |
How Productivity Relates to Duration
When estimating the number of people needed for a task, you will need to consider their productivity. Adding people to simple tasks always reduces the duration. Productivity is said to be constant when the total labor hours do not change as the number of people assigned to the task changes. (The productivity of the technicians in Table 7.3 was constant; so was the "Remove debris" task in Table 7.1.)
However, in the case of tasks involving knowledge workers, adding more workers does not always result in greater productivity and a shorter duration of a task. For example, if two engineers are working on a complex problem, adding three more may actually slow the task and produce no recognizable change in product quality. The result is a measurable decrease in productivity because the cost for labor increased while the product stayed the same. (The estimate in Table 7.5 is another example of this factor.)
Another point to consider when measuring productivity is that people who spend all their time on one project are usually more productive than people who spread their time across multiple projects (again, see Table 7.5). The analyst estimated that the most productive way for her to work—requiring the fewest hours and fewest days—was to be able to devote her attention 100 percent to one project.
When calculating hours for your part-time project workers, it is usually unnecessary to figure out exactly what hour of which day they'll be working on your project. By assigning an availability assumption, such as "two hours per day," to all their tasks, the estimates for the duration of the task are proportionally increased. This approach allows each individual team member to decide for him- or herself when to actually work on the task. It doesn't matter whether they get started on it as soon as it's scheduled or work on it the last day. All you need to do to prepare a detailed plan is to give them a start time and a completion time.
As you can see, there is much to be considered when estimating the costs and duration of work packages. Chapter 8 will discuss the subject further, with many more tips and techniques.
Calculating a schedule may be one of the most well known, but unappreciated, of all project management techniques. It can be particularly tedious and time-consuming when done by hand for large projects. Yet it is the key to establishing realistic schedules and meeting them. (The tedium involved is a compelling reason to use project management software.)
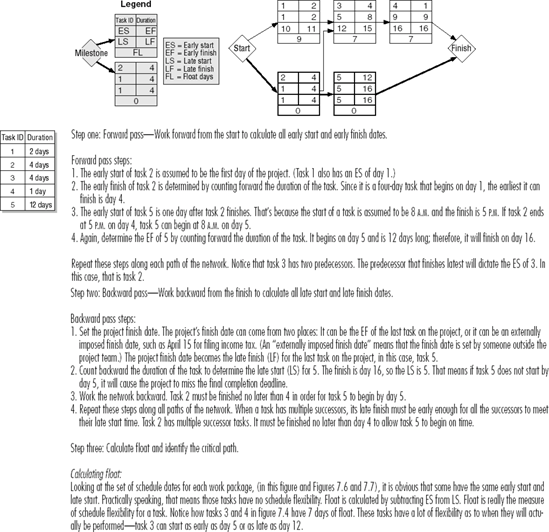
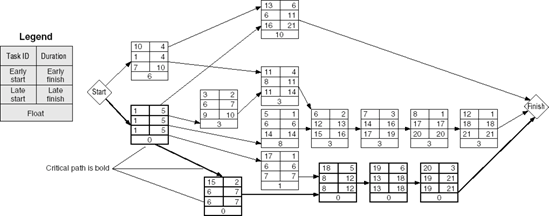
As discussed earlier, the initial schedule is calculated by using the network diagram and the duration of each work package to determine the start and finish dates for each task, and for the entire project. Figure 7.4 shows how the network and task duration can work together to produce an initial schedule. Schedule calculation provides a set of detailed schedule data for every work package, as shown in the following:
- Early start
—The earliest date a task can begin, given the tasks preceding it.
- Early finish
— The earliest date a task can finish, given the tasks preceding it.
- Late start
— The latest date a task can begin without delaying the finish date of the project.
- Late finish
— The latest date a task can finish without delaying the finish date of the project.
Calculating the schedule to determine these four dates is a three-step process. Referring to Figure 7.4 will help to clarify this process.
Step One: Forward Pass
The forward pass will help you determine the early start (ES) and early finish (EF) for each task. It is so named because it involves working through a network diagram from start to finish. (The next step will involve the reverse—a backward pass.) In Figure 7.4, we follow a forward pass through the diagram, step by step.
Figure 7.5 shows another way of displaying this information. It's called a time-scaled network because it uses a time scale across the top and each task is laid out across the calendar. Notice that all the early start dates are the same in Figures 7.4 and 7.5.
Step Two: Backward Pass
The backward pass determines the late start and late finish dates. All of us have made this calculation hundreds of times—whenever we set an alarm clock. The goal of the backward pass is literally to work backward from the project finish date to determine how late any task can begin or end. The late start (LS) and late finish (LF) are calculated in Figure 7.4.
Step Three: Calculate Float
Some tasks have flexibility in when they can be performed in the schedule and others have no flexibility. The term for this schedule flexibility is float. (Another common term is slack.) Float is calculated by subtracting early start from late start. (How to calculate float is demonstrated graphically in Figures 7.4, 7.6 and 7.7.)
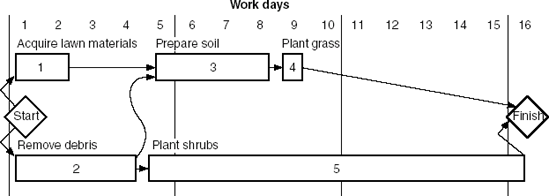
Figure 7.5. Time-scaled network. This contains the same network information as Figure 7.4, but the format is different.
When the initial schedule has been calculated, the project schedule begins to take shape. One of the key features of the initial schedule is the critical path. The term critical path is one of the most widely used—and most widely misunderstood—of all project management terms. But the concept is simple: The critical path is defined as all of the tasks with zero or negative float. When outlined on a network diagram, the critical path is the longest path through the network. (The critical path is boldly outlined in Figures 7.4 and 7.4.)
The tasks that have zero float must be completed at their early finish date or the project finish will be delayed. Making sure that all critical path tasks begin and end on time is the surest way of making the project end on time. That's why you'll hear a project manager motivating someone to complete a task by telling the person, "It's on the critical path!"
Since it is the longest path through the network (the longest path means the longest duration, not necessarily the most tasks), the critical path is one measure of schedule viability. This is because it demonstrates the minimum time the project will take. Sometimes it takes a network diagram with the critical path outlined to show stakeholders that their optimistic schedule estimate is unrealistic.
These are just two of the ways that the project manager might use the critical path. Several more are described later in this chapter and in Chapters 9 and 13.

Tip
Shop Early and Avoid Negative Float
Not every project has a critical path. If a project has an externally imposed finish date that allows more than enough time to complete the project, all tasks will have float. A simple example is Christmas shopping. December 25 is the externally imposed finish date. Early in the year, when there are 200 shopping days until Christmas, nobody is stressed because there is still plenty of float. Like Christmas shopping, most projects with no critical path are put off until all the float is used up.
When all the float has been used up, a new term emerges to describe the situation: negative float. Negative float results when externally imposed finish dates are impossible to meet (such as 10 presents to buy at 6 P.M. on December 24). Figure 7.8, for example, shows a network diagram with a critical path that is longer than the allotted schedule. When there is negative float, it means that adjustments will have to be made to bring the schedule in line with the critical path. This is the kind of information you will need when you renegotiate the cost-schedule-quality equilibrium.
A picture is worth a thousand words. The network diagram is essential in calculating the schedule, but it can be terribly difficult to decipher on a large project. Thankfully, there are two very good alternatives, which display both the schedule information and the task relationships.
Gantt charts, named after Henry Gantt, who developed them in the early 1900s, have become the most common method for displaying a project schedule. Figure 7.9 is a Gantt chart for the home landscape project. It has the same schedule dates as the network in Figure 7.6. Notice that all the tasks are currently scheduled at their early start date—you can tell that because all noncritical tasks display float. The great advantage of the Gantt chart is its clarity: The horizontal axis shows the schedule and the vertical axis lists the work breakdown structure.
Another excellent graphic for displaying a schedule is the time-scaled network (as shown in Figures 7.5 and 7.5). One advantage that this diagram has, compared to the Gantt chart, is the ability to condense the network onto less paper. On large projects, the Gantt charts can grow too large to print, whereas the time-scaled network, because it combines many tasks on one line, can be made one-half to one-tenth the height of the Gantt.
The initial schedule represents the combination of task sequence and task duration, but it's called an initial schedule because it hasn't taken into account people and equipment limitations. The next planning step uses the initial schedule as a starting point and balances it against the resources available to the project.
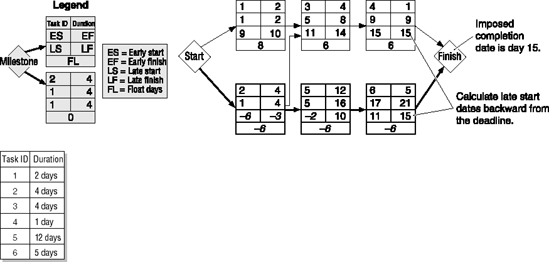
Figure 7.8. Negative float. When imposed deadlines result in negative float, that is a warning the project is out of equilibrium the cost, schedule, or quality objectives must be revised.
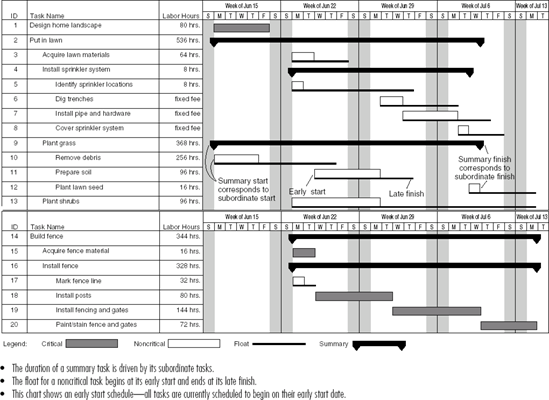
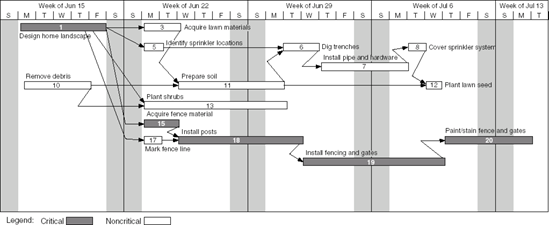
Figure 7.10. Time-scaled network for home landscape project. This time-scaled network has the same initial schedule information as Figure 7.9.
The goal of resource leveling is to optimize the use of people and equipment assigned to the project. It begins with the assumption that, whenever possible, it is most productive to have consistent, continuous use of the fewest resources possible. In other words, it seeks to avoid repeatedly adding and removing resources time and again throughout the project. Resource leveling is the last step in creating a realistic schedule. It confronts the reality of limited people and equipment and adjusts the schedule to compensate.
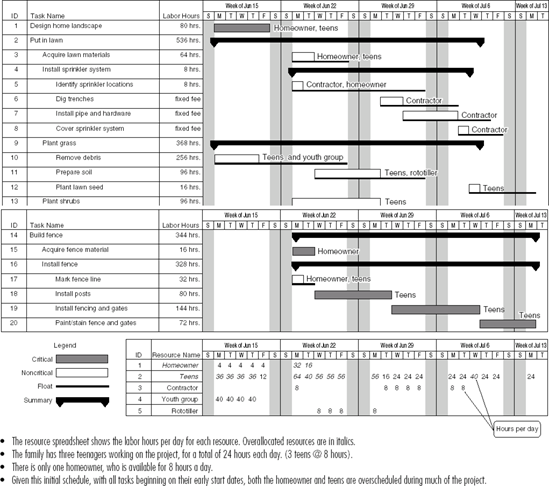
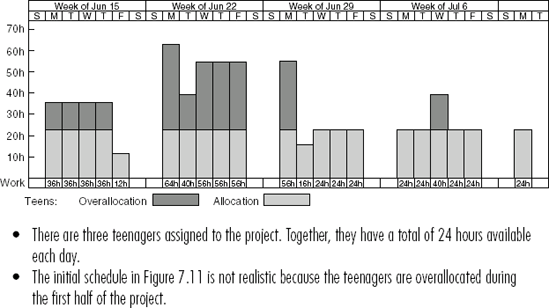
Using the home landscape project as an example, we can see how resource leveling makes a project schedule more realistic. The network (Figure 7.6) shows, in terms of task scheduling, that it's possible to put in the lawn and build the fence at the same time. But when we consider that the family has only the three teenagers available to work on the project, that means they have just a total of 24 labor hours available per day (3 teens × 8 hours a day). Trying to put in the lawn and build the fence concurrently is unrealistic because it would require each teen to work far more than eight hours a day for more than half the project. (The resource spreadsheet on the Gantt chart in Figure 7.11 indicates clearly how unrealistic the schedule is.) Resource leveling will adjust the schedule to keep the teens busy at a consistent, reasonable rate. (Figure 7.12 on page 158 shows the same project as Figure 7.11, but with the resources leveled.) Not only does resource leveling take unreasonable overtime out of their project, but it keeps the teens employed for a longer time at a steady rate. That's usually an advantage for any project team.
Let's consider a few of the problems faced by project managers in this process of leveling resources.
Every project faces the reality of limited people and equipment. The idea is to avoid both over- and underallocation. As the home landscape project demonstrates, too many concurrent tasks can call for more resources than are available. For example, as discussed, the initial schedule had the teens working on the fence and the lawn during the same period, and this resulted in the teens being overallocated during the first half of the project (they would have had to work more than eight hours a day to meet this schedule).
Project managers need to remember that whether it's teenagers planting the lawn, bulldozers, or programmers, there are rarely a bunch of spares sitting on the shelf. This overallocation problem can become especially acute if project managers imagine that they have a large supply of a rare resource, such as the unlimited time of the only subject expert in the company. In this case, not only has the schedule become unrealistic, but the manager may have overloaded a key resource.

The other side of the problem is underallocation. If the project team isn't busy on your project, it will likely be reassigned to other projects and be unavailable when the next peak comes. In the worst case, during lulls in the project some of the unassigned people may get laid off, becoming permanently unavailable and taking valuable knowledge about your project with them.
A further problem arises if people working on this project are also working on several others at the same time. If every project in the firm has wild swings in its resource requirements, it is almost impossible to move people smoothly between projects. Instead, people are yanked off one project to help another catch up, only to be thrown at yet another that is even further behind.
The Process of Resource Leveling
It is important to remember how we are defining the term resources. Resources are the people, equipment, and raw materials that go into the project. Resource leveling focuses only on the people and equipment; the materials needed for the project are dictated by the specifications.
Resource leveling begins with the initial schedule and work package resource requirements (see Table 7.1). The leveling follows a four-step process:
Forecast the resource requirements throughout the project for the initial schedule. The best tool for this process is a resource spreadsheet such as the one portrayed in Figure 7.11. This spreadsheet, correlated to the schedule, can forecast all the people and equipment needed on each day of the project. The initial schedule is sometimes called an early start schedule. At first, this might seem like good project management, that is, getting as early a start on everything as possible. But an early start schedule usually has a lot of uneconomical resource peaks and valleys. For example, the overallocation of the teens during the first half of the home landscape project is the kind of misallocation common to early start schedules.
Identify the resource peaks. Use the resource spreadsheet (Figure 7.11) and the resources histogram (Figure 7.13) to find the periods in the project where there are unrealistic or uneconomical resource amounts.
At each peak, delay noncritical tasks within their float. Remember that float is schedule flexibility. Tasks with float can be delayed without changing the project deadline. By delaying these tasks, you'll also be filling in the valleys of the resource histogram, that is, moving tasks from periods of too much work to periods when there is too little work. This means that you will need fewer people, and they will be more productive, but the deadline will stay the same. (A comparison of the initial schedule in Figure 7.11 with the leveled schedule in Figure 7.12 demonstrates how task 5 was delayed within its float, thus removing a resource peak for the homeowner on June 24.)
Eliminate the remaining peaks by reevaluating the work package estimates. Using the project float in step 3 may not be enough to eliminate all the peaks and valleys. For example, instead of having two or three people working together on a task, consider whether just one person could do the work over a longer period of time. (Task 12 in Figure 7.12 was changed from two teenagers for one day to one teen for three days.) Alternatively, available people might be added to a task to shorten its duration. When performing these changes, take note that each change to a work package estimate is going to change the amount of float, or time flexibility, for that task. In other words, after changing a work package estimate, you will need to return to step 4 and recalculate the initial schedule. Then you will also need to repeat the first three steps of resource leveling. (This kind of recalculation is made much easier by using project management software.)
Reestimating work packages and delaying tasks within their float can remove the worst resource peaks and valleys, but the plan might still contain unrealistic or uneconomic resource peaks. At that point, your next option is accepting a later project completion date.
On the home landscape project, the schedule had to be extended by two weeks to balance the available labor with the amount of work. This can be a difficult decision, but that's what it means to create a realistic cost-schedule-quality equilibrium. In Chapter 9, there will be further discussion of the factors that balance the schedule against cost and quality.
Warning
Computers Will Not Do Everything
Some of the tedious calculations described here are easily performed by project management software, but don't be fooled. Computers really perform only two tasks: data storage and calculations. Even if you employ a good software package, you will still have to understand each one of the steps in this chapter. (The appendix summarizes the planning steps using the home landscape example.)
The detailed planning techniques presented in this chapter are often downplayed as mere scheduling techniques. But not only do they build a realistic schedule, these techniques form the foundation of the science of project management.
The planning model in this chapter portrays the step-by-step method of building a detailed plan. Laying out a detailed plan may not solve all the problems you'll face as a project manager, but it does provide a tool set for solving many of them. Every one of these planning techniques will be referred to again in later chapters. They are the entry point to the science of project management; without them it's impossible to practice the art.

Large or complex projects can follow the advice in Part 3 together with project management software to build detailed action plans. Simpler projects may call for a simpler format.
The action plan template is simply a spreadsheet formatted with standard headings for recording the basic information of a plan and tracking actual performance. Fill in the calendar portion by shading the cells to create a Gantt chart. This template is available for download at www.versatilecompany.com/FFMBAinPM.
Table 7.6. Home Landscape Action Plan[a] Project Manager: Home Owner Last Updated: 6/27
Task ID | Task Name | Assigned to | Baseline Start | Actual Start | Baseline Finish | Actual Finish | Baseline Labor | Actual Labor | Labor Remaining | Comments |
|---|---|---|---|---|---|---|---|---|---|---|
'Assigned to' Initials HO = Homeowner Tn = Teens Cn = Contractor YG = Youth Group Rt = Rototiller | ||||||||||
1 | Design home landscape | HO, Tn | 16-Jun | 16-Jun | 20-Jun | 20-Jun | 80 | 72 | 0 | |
2 | Put in lawn | |||||||||
2.1 | Acquire lawn material | HO, Tn | 23-Jun | 24-Jun | 24-Jun | 25-Jun | 64 | 64 | 0 | |
2.2 | Install sprinkler system | Cn | 30-Jun | 8-Jul | fixed | na | na | |||
2.3 | Plant grass | |||||||||
2.3.1 | Remove debris | Tn, YG | 16-Jun | 16-Jun | 20-Jun | 23-Jun | 260 | 350 | 0 | |
2.3.2 | Prepare soil | Tn, Rt | 25-Jun | 26-Jun | 30-Jun | 96 | 60 | 40 | work weekend | |
2.3.3 | Plant lawn seed | Tn | 9-Jul | 11-Jul | 16 | 16 | ||||
2.4 | Plant shrubs | Tn | 1-Jul | 4-Jul | 96 | 96 | Call 6/30 – shrub dlvry | |||
3 | Build fence | |||||||||
3.1 | Acquire fence material | HO, Tn | 3-Jul | 4-Jul | 16 | 16 | ||||
3.2 | Install fence | Tn | 8-Jul | 28-Jul | 328 | 328 | ||||
[a] Copyright Eric Verzuh 2008. Original purchasers of this book are permitted to photocopy or customize this page by downloading it from | ||||||||||
Table 7.7. Home Landscape Action Plan[a]
Gantt Schedule(week begining) | |||||||||
|---|---|---|---|---|---|---|---|---|---|
Task ID | Task Name | Assigned to | 15-Jun | 22-Jun | 29-Jun | 6-Jul | 13-Jul | 20-Jul | 27-Jul |
'Assigned to' Initials HO = Homeowner Tn = Teens Cn = Contractor YG = Youth Group Rt = Rototiller | |||||||||
1 | Design home landscape | HO, Tn | MTWTF | ||||||
2 | Put in lawn | ||||||||
2.1 | Acquire lawn material | HO, Tn | MT | ||||||
2.2 | Install sprinkler system | Cn | TWTF | MT | |||||
2.3 | Plant grass | ||||||||
2.3.1 | Remove debris | Tn, YG | MTWTF | ||||||
2.3.2 | Prepare soil | Tn, Rt | WTF | M | |||||
2.3.3 | Plant lawn seed | Tn | WTF | ||||||
2.4 | Plant shrubs | Tn | TWTF | ||||||
3 | Build fence | ||||||||
3.1 | Acquire fence material | HO, Tn | TF | ||||||
3.2 | Install fence | Tn | TWTF | MTWTF | MTWTF | M | |||
[a] Copyright Eric Verzuh 2008. Original purchasers of this book are permitted to photocopy or customize this page by downloading it from | |||||||||
Answers to these questions are found at www.versatilecompany.com/FFMBAinPM.