
True or false? It becomes increasingly important to track progress as the deadline nears to see how close the project will be to finishing on time and on budget.
False! This is a pretty easy question to answer if you've read the previous chapters. By the end of the project it doesn't matter how close you are because you have almost no ability to change your cost and schedule performance. The key to finishing on time and on budget is to start out that way and stay on track throughout the project.
When projects start with challenging schedules, if they fall behind, even by a little, they spend the rest of the project trying to catch up. Other projects, however, seem to have a self-correcting process built into them; if they fall behind a little, the problem is quickly identified and dealt with immediately. The best project managers find problems early and solve them without overtime. They make the project look easy.
Progress measurements are the tools we use to identify problems when they are small—when there is still time to catch up. Since cost and schedule progress comprise two-thirds of the cost-schedule-quality equilibrium, they are the primary focus of progress measurement.

Each work package in the plan is a measurable unit of progress. Each has start and finish dates. The smaller the work packages, the more progress points you can refer to, and therefore the more accurate your schedule progress will be. (Work package size guidelines are covered in Chapter 6.) The following story highlights the importance of breaking down a project into small, measurable units.
A software project manager responsible for a major release of a flagship product was trying to ascertain the schedule status. Several of the development managers had broken their work down into only a few tasks that were six months long. All were reporting that they were "on schedule" four and a half months into their work. The project manager's gut feeling was that the developers really had no idea where they were. She also felt that they were not likely to recognize a schedule problem for at least three more weeks—and that they wouldn't admit to it even at that point. To get the truth, she sat down with each development manager and said, "We've got six weeks until your deadline. Can you give me a week-by-week description of the work you have left to do?" During these meetings, three of the four managers had to admit they were dangerously behind schedule. Although they were 75 percent through the project schedule, the managers were able to finish their portion on time by turning all their developers onto this project.
This near-disaster illustrates the importance of questioning schedule status when the work is not broken down into small, detailed tasks.
The primary tool for illustrating a schedule is also good for displaying schedule status. Figure 12.1 is a Gantt chart showing schedule progress.
Notice that the focus here is on displaying schedule status. You will use project status meetings, as described in Chapter 11, for capturing actual task completion status. The real truth about schedule status is often elusive because it is hard to pin down what proportion of a project is really complete. The following tips are commonsense ways to get the most accurate picture possible of a project's progress.
Tip
A project manager should always be suspicious of work package status that is reported in detailed increments, such as 12 percent, 35 percent, or 87 percent, unless there is empirical basis for this amount of detail. When possible, use the 0-50-100 rule for recording schedule completion of tasks that span no more than two reporting periods.
0 percent complete: The task has not begun.
50 percent complete: The task has been started but not finished.
100 percent complete: The task is complete.
Using this method, as long as the work packages are small, no task will have 50 percent completion for two status meetings in a row (because the maximum time to complete each task is no more than two reporting periods).
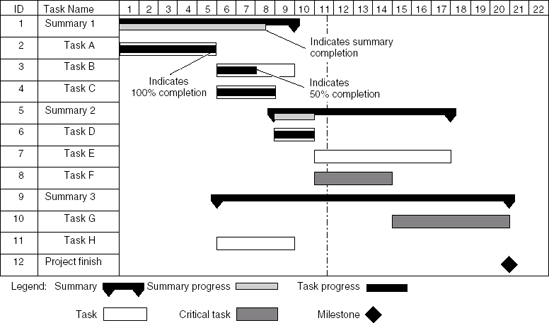
Figure 12.1. Gantt chart with schedule progress bars. All progress bars are behind the current date, showing the project behind schedule.
Tip
Take Completion Criteria Seriously
Every work package is supposed to have completion criteria (see Chapter 6) and should not be considered 100 persent complete until it meets these criteria. You need to be rigid about this—if tasks are consistently allowed to register as complete before all the final details are taken care of, the project might fall far behind, even though the official status reports it as being on schedule.
Tip
Schedule Performance Measures Accomplishment
Schedule completion measures accomplishment, not effort expended. Just because you've used up 50 percent of your labor budget doesn't mean you've accomplished 50 percent of the project. Schedule status is a measure of whether you've accomplished as much to date as you had planned to.
Warning
The Dangers of Management by Exception
Management by exception is a seductive method for keeping the project on schedule that, in many cases, can actually increase schedule problems. Management by exception focuses on keeping critical path tasks on schedule while ignoring noncritical tasks that fall behind their scheduled start or end dates. Although it may be true that tasks that have float can continue to be delayed until they run out of float and become critical, these delays can lead to a resource crisis at the end of the project—which is the worst time to try to get extra work accomplished. The people poured onto the project at the end will have had little or no experience with the project. In addition, you will have increased your schedule risk, because a late completion of any one of the critical tasks can delay the project finish.
There is a way to measure schedule progress if your project contains many similar tasks. To begin, consider what these three projects have in common:
Driving hundreds of piles into marshy soil to form the foundation for a huge building
Creating thousands of engineering drawings to produce a next-generation fighter aircraft
Converting hundreds of computer programs originally written for one brand of hardware to run on another manufacturer's hardware
In each case, the portion of the total number of piles, engineering drawings, or computer programs completed can produce a useful schedule status. Figure 12.2 shows an example of a simple graph that displays this type of status. This graph can be generated by simple spreadsheet programs or project management software. These graphs can be extremely useful, but they can be misleading because they don't differentiate between easy and difficult tasks. For example, if all the easy piles were driven first, or if all the easy drawings were created first, the projects might initially show progress ahead of schedule, only to fall behind later when the time comes to handle the difficult piles and drawings.
Measuring costs accurately is critical as a project progresses because cost measures productivity. Every work package has cost estimates for labor, equipment, and materials. As each one is executed, be sure to capture the actual costs; comparing planned and actual costs will tell you whether the project is progressing as planned (see Table 12.1).
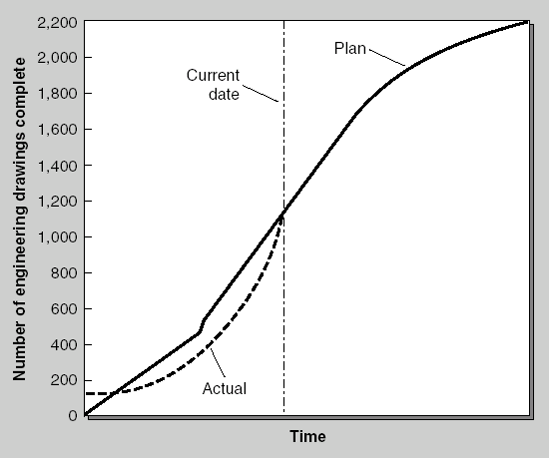
Table 12.1. TRACK ACTUAL COSTS FOR EACH WORK PACKAGE
Planned | Actual | |||||
|---|---|---|---|---|---|---|
Task Name | Labor | Equipment | Materials | Labor | Equipment | Materials |
Task n | 40 hrs. | $1000 | $1500 | 50 hrs. | $1200 | $1500 |
Task p | 30 hrs. | $200 | $100 | 25 hrs. | $200 | $150 |
Task r | 60 hrs. | 0 | 0 | 55 hrs. | 0 | 0 |
Tip
How to Get Cooperation in Reporting Labor Hours
If project management is new to your firm, you may encounter plenty of resistance to tracking actual labor hours on tasks. Engineers, programmers, scientists, and other knowledge workers often complain bitterly about the lost productive hours they must spend each week just writing down their labor for specific tasks (even though experience has shown that this rarely takes more than five minutes a day). Here are two approaches for overcoming their resistance. These methods concentrate on winning their cooperation rather than forcing their compliance:
Point out that there is a legitimate need to track actual labor hours. Being able to compare planned and actual labor provides early warning on cost problems—and will improve estimates on future projects. Help them to understand that they will benefit from both of these factors.
Make it easy for them to report by using the largest increments possible for reporting actual hours. For instance, a department in a software company that was introducing project management chose to estimate and report labor in increments of five hours. As long as the work packages were kept small, it was easy to report actual labor at every project status meeting. This might not have been quite as accurate as planning and reporting in hourly increments, but it was a great leap forward compared to what they did before (which was nothing).
Warning
Problems Associated with Graphing Cost Performance
Graphing cost performance usually compares the projected expense over time to actual expenses (see Figure 12.3). That's useful information, but this kind of graph has some potential drawbacks:
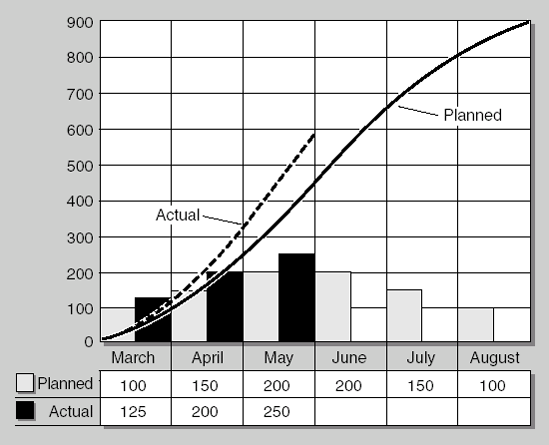
Figure 12.3. Planned versus actual cost over time. During the first three months, the project spent money faster than forecasted, but that isn't necessarily an indication the project will be over budget—it might be ahead of schedule.
The rate at which money is being spent doesn't indicate whether the work is getting done. For example, the project in Figure 12.3 could show higher-than-planned expenditures because it is ahead of schedule.
Accounting lag times can make cost information arrive months late. This kind of delay means that a project's cost performance might appear to be excellent all the way through the project—but after completion the bills just keep coming in.
Comparing planned cash flow with actual cash flow has its uses, but it doesn't tell you whether the project will be over or under budget. To get the true picture of cost performance, the planned and actual costs for all completed tasks need to be compared. This is accomplished with a technique called earned value reporting. Earned value reporting uses cost data to give more accurate cost and schedule reports. It does this by combining cost and schedule status to provide a complete picture of the project. For example, projects can be ahead of schedule (good), but over budget (bad). Or they can be ahead of schedule (good), and under budget (good). Altogether, there are five possible combinations when you include "on schedule and on budget" (see Figure 12.4). As this diagram shows, project managers who track only cost or only schedule are getting only half the picture and won't really know if their project is in trouble.
Calculating the Cost Variance Using Earned Value
Tracking cost with earned value introduces some new terms:
Planned cost: The planned (budgeted) cost of any or all tasks.
Budgeted cost of work performed (BCWP): The planned (budgeted) cost of tasks that are complete. This is the actual earned value of the project to date, because it is the value of the work that has been completed. Tasks that are partially complete can claim some BCWP. A $100 task that is 50 percent complete has a BCWP of $50.
Actual cost of work performed (ACWP): The actual cost of tasks that have been completed.
Cost variance (CV): The cost variance is the difference between planned and actual costs for completed work. CV = BCWP – ACWP.
Cost variance percent (CV%): The cost variance divided by the planned cost. A positive CV% is good; it means the work was performed under budget. A negative CV% is bad, because it means the work was over budget. CV% = CV/BCWP.
Cost performance index (CPI): Earned value (BCWP) divided by actual cost (CPI > 1.0 = under budget; CPI < 1.0 = over budget).
Budget at completion (BAC): The budget at the end of the project. This represents the approved budget for the project.
Estimate at completion (EAC): This is a reestimate of the total project budget. The original budget is multiplied by the ACWP and divided by BCWP. It's a way of saying that if the current cost performance trends continue, the final cost can be predicted.
Estimate to complete (ETC): The budget amount needed to finish the project, based on the current CPI. ETC = EAC = AC.
Variance at Completion (VAC): The estimated difference, at the end of the project, between the budget and actual cost of the project. VAC = BAC = EAC.
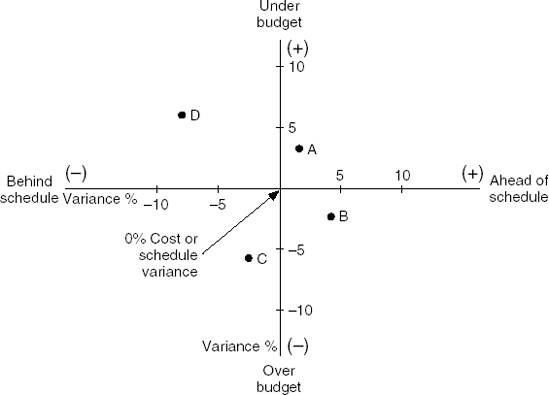
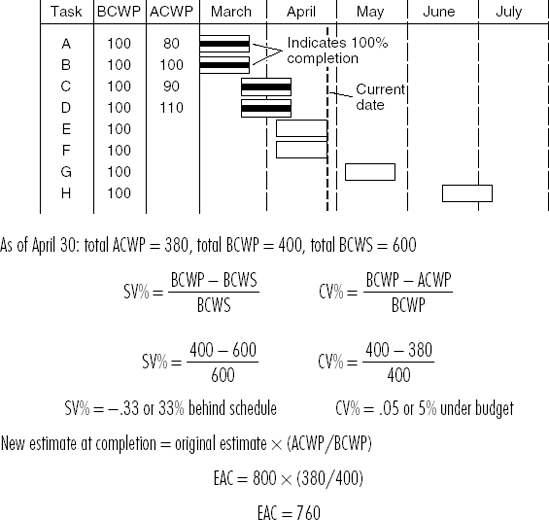
Figure 12.5 shows an example of using earned value both to measure cost performance to date and to recalculate the budget.
Warning
New Terminology: BCWS = PV, BCWP = EV, ACWP = AC
Not long ago, only the U.S. Department of Defense (DoD) used earned value to manage projects. Now the practice has spread to large and small commercial firms as well as the civilian agencies of the federal government. Through increased use, the terminology is beginning to change. Although international standards organizations still promote use of the preceding terms, the Project Management Institute (PMI), based in the United States, recommends substituting the following terms:
Planned value (PV) replaces budgeted cost of work scheduled (BCWS).
Earned value (EV) replaces budgeted cost of work performed (BCWP).
Actual cost (AC) replaces actual cost of work performed (ACWP).
Firms that want to be aligned with PMI terminology and individuals studying for one of PMI's certification exams should take special note of these terms.
Warning
Use the Cost Variance to Identify Problems Early
Recalculating the estimated cost at completion using earned value implies the current trends will continue. But be careful not to assume that just because you are over budget now that you will be granted more budget. Instead, the cost variance should be used as a warning flag to help you identify problems early, when there is still time to get back on track.
Calculating Schedule Variance Using Earned Value
Is the project on schedule? This is a question that all the stakeholders want answered. But it can be difficult to measure the degree to which a project is ahead or behind schedule. What if the majority of tasks are on schedule, but a few are ahead of schedule and others are behind? What is an accurate description of this project's schedule status? In this kind of situation, earned value calculations can help measure schedule variance just as they help in measuring cost variance. Calculating schedule variance uses some of the same concepts as the cost variance calculation. (Substitute PMI terminology here as well). These are:
Budgeted cost of work performed (BCWP): The planned (budgeted) cost of tasks that are complete.
Budgeted cost of work scheduled (BCWS): The planned (budgeted) cost of work that should have been completed to date.
Schedule variance (SV): The schedule variance is the difference between the value of the work that was planned for completion and the value of the work that was actually completed. It uses cost values to measure schedule performance. SV=BCWP-BCWS. (The example in Figure 12.5 demonstrates how schedule variance works.)
Schedule variance percent (SV%): The schedule variance divided by the planned cost to date. A positive SV% is good; it means more work has been performed to date than originally planned. A negative SV% is bad, because it means less work has been completed than the plan called for. SV%=SV/BCWS.
Schedule performance index (SPI): BCWP divided by BCWS (SPI > 1.0 = ahead of schedule; SPI < 1.0 = behind schedule).
Using the cost figures as the basis for schedule measurement is useful because it takes into account the number and size of tasks that are behind schedule. That means if 10 concurrent tasks, each worth $10, 000, are all one week behind schedule, the schedule variance will be larger than if only one of those tasks is one week behind schedule.
Graphing Earned Value
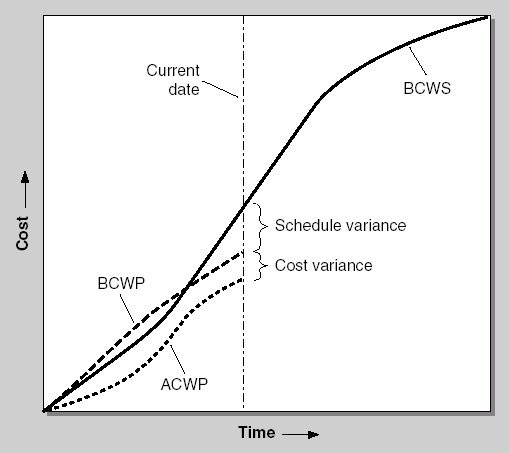
There is no more accurate presentation of a project's cost and schedule performance than earned value charts. Not only do they show the cost and schedule status at any given date, but they also indicate performance trends. Figure 12.6 shows an earned value chart.
An executive with 10, or even 100, projects under his or her control can use the kind of graph shown in Figure 12.4 to pinpoint the cost and schedule performance of each one. This will help to determine which project demands the most attention.
The example in Figure 12.5 shows how simple it can be to use earned value metrics to report progress. Unfortunately, many firms trying to apply earned value practices find it much more confusing. If you've read the previous chapters in this book and are practicing the discipline as it is described here, earned value metrics are practically free. In other words, if you have a detailed plan and capture actual performance data, the earned value calculations become easy. What follows here are some hard-won insights on applying the earned value reporting methods on projects.
The Work Breakdown Structure Is Critical
The secret to making earned value work is in the work breakdown structure (WBS). Each task on the WBS must be a discrete task that meets these criteria:
It must have defined start and finish dates.
The task must produce a tangible outcome whose completion can be objectively assessed.
Costs must be assigned to the task, even if they are only labor costs.
If you've applied the guidelines in Chapter 6, your WBS will probably enable easy earned value reporting. The problem occurs when the WBS contains one of these mistakes:
- WBS tasks should rarely represent an ongoing activity.
There will always be some tasks that are planned as level of effort (LOE) tasks, meaning that a function within the project requires some basic staffing level that runs throughout the project. Project management is an example of an LOE task—we expect a certain amount of labor cost each week to be spent on project management, and the total duration of this activity is dictated by the length of the project. A construction project that hires security services to monitor the site is also an example of a task where a weekly cost can be estimated, and the task duration depends on the project's duration. But these should be the exception within the WBS. The problem arises when a category of tasks is lumped together under a heading such as "Engineering." Rather than breaking all the engineering work into separate discrete tasks, the manager simply assigns people to the task for a period of time. The result is a WBS task like this: " 'Engineering' will last four months, and we'll assign eight engineers." That produces a couple of problems:
With this task description we can't track cost or schedule variance—as long as the task begins on time and doesn't use more than eight engineers, there is no cost or schedule variance.
LOE tasks produce the illusion that the task is on schedule and on budget until the day that it doesn't finish on time—then every day after that we watch the costs and schedule variances increase.
An LOE task that is understaffed actually sends the message that it is under budget because fewer people are working on the task than originally called for. Of course, since there is no objective way to track incremental schedule progress, the news might look very good until the day the task is supposed to be complete yet isn't.
- Keep the lowest level tasks small.
The size of work packages plays a big role in calculating cost and schedule variance accurately. When it comes to assessing schedule progress at the task level, you really know only two things: whether the task has started and whether it is finished. In between we are guessing if we report incremental progress. The simple method of assigning 50 percent of the BCWP to a task once it has begun and 100 percent of the BCWP when it is complete results in very accurate schedule variance calculations if the work packages are small. If the work packages are large, the variance is likely to be skewed, both positively and negatively, from week to week.
Data Isn't Information
What does a CPI of 0.95 really mean? If my SPI is 1.1 what should I do? Although we've defined the basic terms of earned value analysis, we still need to make sense of the numbers in the context of our project.
- Trends are more useful than snapshots.
A CPI of 0.95 means the project is over budget. But if the CPI a month ago was 0.90, it means we may have figured out the problem behind the cost overrun. A major value of these metrics are their predictive capability—forecasting the total cost or schedule variance for the entire project based on variance early in the project. Focusing on trends tells us whether our management strategies are working. The graphing techniques shown in Figures 12.4 and 12.4 can show earned value data over time. (The graph in Figure 12.4 could be drawn for a single project, with each week's variance represented as a single point—connecting the dots tells a story.)
- Schedule variance doesn't tell the whole story.
Don't forget the importance of the critical path as you track schedule. Projects with many concurrent tasks benefit from tracking schedule variance, because with many tasks being simultaneously performed, many are bound to be ahead while others will be late. In this scenario, however, many noncritical tasks could be ahead of schedule while critical path tasks are falling behind—providing a positive schedule variance and false confidence. If critical path tasks are late, sooner or later the entire project will be held up. Watch both the schedule variance and the critical path.
Warning
Size Increases Complexity for Earned Value
The projects that benefit most from earned value will have the greatest challenges implementing it. The larger the project, the more difficult it is to understand all the parts and to stay on top of cost and schedule variance. That's why these practices were invented—to manage huge defense programs. Putting the infrastructure in place to generate honest data on a routine basis is a formidable task on a major project or program—but the alternative is even worse.
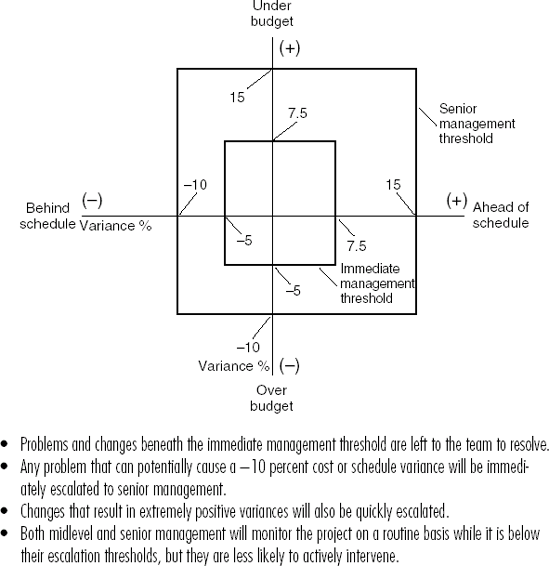
While the project team has the authority to solve certain problems, others need to be escalated to higher management or may even demand the direct attention of senior management. The determining factors for who handles a problem or approves a solution are its cost and schedule impacts. Escalation thresholds represent preset variances that signal the severity of a problem; these thresholds are set during the planning process. The communication plan developed early in the project and described in Chapter 4 contains a description of the cost and schedule escalation thresholds (see Figure 12.7).
Thresholds accomplish several important functions:
Change management thresholds separate the types of changes the project team can approve from those the change board must approve (see Chapter 11).
Problem-resolution thresholds bring the proper level of attention to specific problems. When a problem is encountered that threatens project cost and schedule goals, it needs to be identified and raised to the proper level immediately, skipping the normal project status process. Any single problem that is big enough to cross an escalation threshold is big enough to demand immediate attention; passing the problem from one level of management to the next using the normal status process of weekly or monthly status meetings would take much too long. The threshold shows exactly who needs to be involved in solving the problem.
Overall project progress thresholds signal upper management it is time to become actively involved in the project. The project may have fallen behind a little at a time, and the trend may have been apparent over several status periods, but at a certain point in this decline the escalation threshold will be crossed. This is the signal that management must intervene to solve the problems or set new cost and schedule goals.
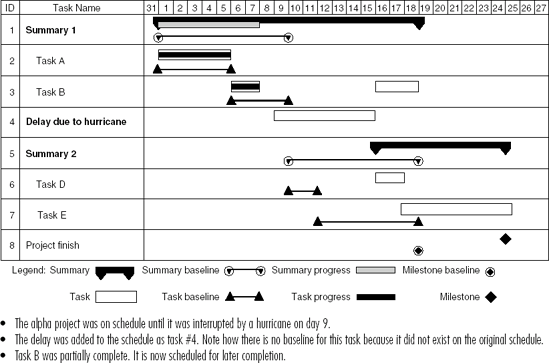
A baseline is a comparison point. Cost and schedule baselines represent the original project plan as approved by the stakeholders. Ideally, a project should never vary from its original plan, so a comparison between actual performance and the baseline would show no variance. But in reality this zero variance never happens. Even though everything may not happen according to the plan, however, many projects do meet original cost and schedule goals. Keeping the baseline cost and schedule goals visible is one way of holding the focus on the original goals, even when changes start to happen. Earned value reporting, as shown in Figure 12.6, is one way of keeping this vital information visible, because it emphasizes variance from the baseline. A Gantt chart may be used to focus on schedule variance alone (see Figure 12.8).
The baseline is more than just a starting point; it also represents the accepted cost-schedule-quality equilibrium on the project. The project team is committed to meeting the baseline and should assume it will continue to be held to the baseline, unless otherwise directed by the project manager. Consider the following example.
The BoxBetter project had been stuck about two weeks behind schedule for a month. The project manager had tried several ways to catch up, but none of them were working. At this point, Terry and Madison, who spent about a quarter of their time on the project, gave up on bringing the schedule up-to-date and decided to turn their attention to other projects. Although the schedule for BoxBetter called for them to complete a task prior to the next status meeting, neither of them worked on the task. At the meeting, Terry and Madison were chagrined to learn that the other project team members had done extra duty to bring the project back on schedule. Their task was now the only one that was late—and others were waiting for them to complete it. In this case, Terry and Madison had mistakenly assumed that the baseline for the project had changed.
Changing the baseline, however, is a big deal because it represents a new cost-schedule-quality equilibrium. This new equilibrium requires approval from all the stakeholders. If the justification for the change is good enough, meeting the new baseline might even be considered a success. Other times, however, it simply represents accepting a new reality. If all the evidence suggests that the project will miss the original cost and schedule goals, then it probably makes sense to change them. Maintaining unrealistic goals is rarely motivating. At the same time, however, the baseline must be changed cautiously and honestly, because it affects motivation if the baseline is changed over and over again. The new baseline should be as realistic as possible, reflecting the level of performance that led to the baseline change.
It's surprising how many projects never really know their status until they get close to the deadline, when they have no hope of finishing on time or on budget. There's no mystery to measuring progress accurately; all you need is a detailed project plan with cost and schedule estimates for each work package. But it does require disciplined, systematic attention to the details. It is this attention to the details that enables the project manager and team to spot the problems early, when they are still small and there are still good options for solving them.
The financial analysts on Wall Street wouldn't stand for companies releasing quarterly or annual results based on gut feelings; they demand hard data to show quantifiable results. It's time every project was held to the same standard.
Answers to these questions are found at www.versatilecompany.com/ FFMBAinPM.