UNDERSTAND 1
Any fool can know. The point is to understand.
—Albert Einstein

 WHAT IS “UNDERSTAND” AND WHY IS IT IMPORTANT?
Most organizations have a long way to go before they are frictionless. An easy way to tell if you are close to eliminating friction is to look at how many people are in the customer service department. Let’s compare the percentages of customer care staff in four different businesses:
■ An online service provider has 44% of its staff in customer service.
■ A telecommunications company has 37% of its staff in customer care.
■ An accounting software business has 21% in customer support.
■ An insurance business has 18% in customer care and 9% in claims support.
The reason you can be sure these organizations are far from frictionless is that their busy customer contact teams are dealing with frustrations and problems—not sales opportunities. Even though these businesses now offer more contact choices, including options like chat and messaging, customers are still getting stuck and needing help. Contacts typically start with expressions like, “Why can’t I … ?” “I don’t understand” or “How does this work?” It’s common to have 60% to 70% of contacts represent these forms of dissatisfaction. The ISO 10002-2018 standard states that a complaint is an “expression of dissatisfaction made to an organization,”1 so in many ways, the contact centers in most organizations are handling different forms of complaints. The more of these dissatisfaction contacts an organization is handling, the further it is from being frictionless and the larger the opportunity to improve customer retention and reduce costs.
Given the size of these customer service workforces and the associated costs, you would think that that the ability to Understand and then to reduce contact drivers would be the top priority. However, even the measurement of contacts is not well understood within businesses. Ask most boards and executive teams if problem contacts are increasing, and few would be able to answer. Very few organizations collect, and virtually none of them publish, their contact rates against an appropriate measure of business growth. Very few annual reports feature commentary about the “lower rates of contact” from customers, and it rarely gets discussed in analyst briefings. There are exceptions in companies closer to being frictionless, however. Take Amazon, for example, whose founder and CEO, Jeff Bezos, declared back in 2007,
Execution focus is a big factor [for us], and you can see it in our financial metrics over the past ten years. It’s very obvious when, for instance, we look at the number of customer contacts per unit sold. Our customers don’t contact us unless something’s wrong, so we want that number to move down—and it has gone down every year for 12 years.2
Amazon has long reported and managed contacts per unit (CPU) shipped, recognizing that the larger the order (meaning the greater number of items, or units, in the order), the greater the risk of something going wrong. They still measure CPU today, but few organizations have followed suit. Tracking rates of contact has become harder to do as the number of contact channels have increased. Most organizations rarely report their call rates let alone their combined rate of chats, calls, emails, and messages.
Instead of mining these contacts to help drive improvements, organizations have focused on finding less expensive support methods. Many have moved contact operations to cheaper locations (for example, offshore to countries with lower labor costs) or have sought forms of automation regardless of the impact on the customer (as we’ll explore in chapter 4, “Digitize”). Automation and digitization, when executed well, can be part of a frictionless strategy, but to know what to automate and what to digitize and how to do it well, you need a good understanding of why customers are making contact and what they are looking for. The Understand strategy is therefore an essential step in driving subsequent strategies.
Understanding the rate of and reasons for contacts is the first step to becoming frictionless. The rate of contact shows the size of the prize and the extent of the imperfections. The reasons behind customer contacts show what problems need to be analyzed and fixed. It’s also great customer research, since customers are taking the time and effort to call, write, or text to show something isn’t working. Every contact is telling a valuable story. Consider, for example, a contact center with 100 agents having approximately 31,200 conversations a week3 with customers about what they do or don’t like about the company’s products and services. What a gold mine of potential insight! Imagine how much it would cost to engage a market research firm to interview 31,200 customers.
The recent business trend is to ask customers, “How well did we handle that?” in surveys that typically get 1% to 10% response rates. But the more fundamental question of Understand is “Why did the customer have to contact us?” There seems more to learn in understanding the reasons behind the customer contact, and looking at this data doesn’t put the customer to extra effort.
There are four levels to the Understand method.
Calculate and Track How Often Customers Contact Us across All Channels
This means understanding the rate of contact—and not just the volume of contact—and how that rate is trending. While the contact volume can fall when business is trending down or during off-peak seasons or grow when business is rapidly expanding, the contact rate looks at the extent of customer contact relative to the growth or decline of an organization’s customer base. Using the Understand strategy will show that most contacts are not valuable and that the goal should, therefore, be to reduce contact rates over time. Tracking the rate of contact answers two critical customer experience questions: (1) Are we getting easier to deal with or harder? and (2) Are we nearing a frictionless state?
Capture the Reasons for Customer Contacts and Associated Costs
To make sense of contact volume and trends, organizations need to understand what drove customers to make these contacts. Then they can start to analyze the root causes of the contacts and work out what related issues to tackle. This decision-making is easier when the total cost of each contact reason is understood, starting with the handling time and labor costs of assisted support and the cost of other actions or make-goods that happen (e.g., problem research time, refunds or replacements, sending a repair crew).
Determine Repeat Contact Rates and Causes by Channel
Repeat contacts are the greatest source of frustration for customers, since they represent multiple amounts of effort. Making a second or third contact about the same subject is more frustrating, especially if the first contact was a complaint. Repeat contacts can span channels, as well, so if a customer attempts to use a chatbot that fails; tries to check the app, which fails too; and finally ends up calling the contact center, then that’s already two repeat contacts. Understanding these repeats helps an organization get a grip on the key pain points for customers and adds disproportionately more cost than an initial contact.
Assess the Customer Impact of Contacts
Contacts affect revenue and customer relationships, and they cost organizations a lot of money. This “failure demand” may well cause customers to leave or do less business with an organization. The Understand method, therefore, looks at the relationship of contacts to other key customer behaviors, like leaving, spending, and rating the organization. It shows the complete impacts of the contacts.
Understanding customer interactions is a necessary first step toward becoming frictionless because it enables a systematic and fact-based approach for improvement. Put more simply, the ability to Understand allows an organization to assess which strategic actions to take. (Chapter 8, “Learn,” takes this further by describing how organizations can apply the Understand method continuously). The business world is littered with investments in self-service, digitization, and simplification that didn’t deliver the business case that was hoped for. For example, recently a company accepted a business case claiming that a chatbot could automate 40% of calls, but it was based on a vague analysis of the reasons for calls. They then obtained only half of this result, or a 20% success rate, because they didn’t understand the reasons for contact well enough.
As mentioned, it is getting more complex to apply Understand since customers can express dissatisfaction in multiple channels. The good news, however, is that the latest analytical and AI (artificial intelligence) technologies can help automate this analysis and provide rich, continuous, all-embracing insights. Executed correctly, the Understand actions help an organization to do the following:
■ Expose the size of the opportunity.
■ Quantify the root causes and opportunities.
■ Analyze the strategies needed to exploit these opportunities.
■ Identify the areas of the organization or the partners that need to be involved.
■ Determine why customers are buying less or are leaving.
■ Track the impact of investments and improvements.
■ Cut the costs of low-sample-size surveys and research.
The following stories show how organizations have been able to achieve these results.
GOOD STORIES
The 30 Reasons That Matter
Amazon once had more than 300 customer contact reasons for emails and 60 for phone calls. The wording of the reasons given for phone calls was different from that of emails, and the reasons for each type were reported in separate tables. Worse, the company added reasons whenever a new product category was launched or whenever an executive requested that a specific issue be tracked. Amazon thought they understood what was driving their customers to contact them for help, but in reality, the combined 360 reasons didn’t really add insight or drive change. Upon closer inspection, it turned out that there were really only 30 unique reasons for Amazon customers to contact the company, including “Where’s my stuff?” The recognition that it was possible for frontline staff to classify contacts into these magic 30 reasons turned out to be a gamechanger. The company trained its customer service agents to capture these 30 reasons using a two-digit identifier, which all agents quickly memorized. As the reasons became familiar to the agents, they also became reliable in the diagnosis. The number 30 turned out to be important. It wasn’t so large that each reason accounted for less than 1% of contacts and therefore appeared not worth fixing. Nor was it such an aggregated grouping that the underlying customer issues were not clear. Each of the 30 reasons also had a clear customer statement attached to it, like “I need to return X,” so that frontline staff could easily select the right reason to match what customers were saying.
Each reason was assigned to a single owner whose team was assigned to attack the reason and deliver solutions. Jeff Bezos made it clear that he wanted reason owners to be able to explain why their contacts were rising or falling. This forced all of the owners to work more closely with customer service to understand the issues. Amazon reviewed all of the reasons every Friday, an effort led by the VP of marketing, with each owner sharing how his or her assigned reason was trending down, or not, with details on how to accelerate progress. As a result, Amazon improved and simplified the customer experience. Thereafter, Amazon reduced the rate of contacts (or CPO) year over year, leading to the steady drop in CPU that Jeff Bezos pronounced in 2007.
Standardizing Globally
Each of Vodafone’s 20-plus markets (countries) across Europe, the Middle East, and Africa used to collect and report more than 500 customer intents or reason codes, each with different wording, preventing any comparison, trending, or common attack plans. An exercise in rationalization and standardization got the codes down to 102 standard intents across all three of its product groups (Prepaid Mobile, Postpaid Mobile, and Fixed Broadband). All markets then began to collect data on these codes, either from their frontline staff or by using analytics. This global standardization enabled Vodafone to share root causes and attack plans to accelerate their strategic actions and benchmark performance across the markets. Each product group’s support team only had to worry about 30 to 50 reasons—far more manageable than the previous hundreds.
Vodafone then calculated costs and KPIs (key performance indicators) for each reason, including direct and downstream costs, tNPS (transactional Net Promoter Scores), first-contact resolution (FCR), and customer churn. In cross-functional workshops, it selected call recordings to illustrate several of the more irritating reasons, bringing those reasons and their associated costs to life so that its executives and heads of departments could also understand. This meant that each reason code could then be assigned to an owner, who could have clear insight into the costs and customer impacts, and tackle the associated issues.
Simplifying Customer Needs
OLX is one of the leading online marketplaces. It operates in more than 40 countries and enables sellers of real estate property, vehicles, and everyday objects to find the right buyers. OLX kicked off a pilot in Portugal to test how to understand customer contact reasons and tag owners with responsibility to attack the most irritating reasons. After analyzing the range of issues across its phone, email, and web contact forms, OLX Portugal completely revamped its reason codes into simple expressions such as these:
■ “I need assistance to do X on your website.”
■ “I don’t understand X about your website or services.”
■ “I have a problem; my account is restricted or blocked.”
Then, OLX Portugal tracked its seller and buyer customer journeys using large A0-sized papers (33 by 47 inches), which it posted on the company’s walls, enabling every company manager to understand clearly where bottlenecks drove customers to contact and express these reasons. As a result, OLX Portugal reduced its contact ratio significantly, increased its customer loyalty levels, and won numerous awards. According to the company’s VP of Customer Happiness, David da Costa Mota, “In the first three months of this program our CSAT went from 65% to 80%. After one year, we are at 93% customer satisfaction.”4
To Balance or Not to Balance
Airbnb has grown into one of the most reliable places to find a vacation rental property, valued by hosts and guests alike. Over time Airbnb discovered that trying to balance the quantitative (data and metrics to drive performance) and the qualitative (stories to create empathy and drive action) wasn’t providing actionable details, so the company decided to overhaul its customer feedback system. The new system translated verbatim comments from guests and hosts into customer reasons such as “Payments—Extra Charges, Taxes, and Fees” or “Crewbie—Knowledge” (crewbies are what they call their frontline team), which were then assigned with operational impact scores that ranged from negative through positive numbers. By capturing and sharing these direct quotes widely, Airbnb further increased its ability to understand, and thereby to engage, its crewbies, hosts, and company staff in improvements.
Zip Up the Problems
Australian “buy now, pay later” short-term credit provider Zip Co experienced almost exponential growth in 2017–18. It was a classic Innovator story: a land grab for customers and retailers versus competitors such as Afterpay. Staff headcount was doubling every six months as the company’s customer counts boomed; Zip Co quadrupled their support staff in just a year. The problem was their systems and processes couldn’t keep up with this growth, which would leave customer care to mop up the damage. The director of customer care knew that they needed to understand and then tackle this contact demand.
Zip Co put in place a range of mechanisms to make sure they understood the problems, including the following:
■ Track CPTR, or contacts per transaction rate. This showed them the macro picture of whether they were getting harder or easier to deal with.
■ Define contact reasons to track, and only add more reasons if significant new issues emerged.
■ Create a “wall of pain” where new problems or issues were posted on visible sticky notes. This wall occupied what became a “war room” for problem owners to meet in and understand issues and priorities. Those responsible met every month in this room to understand new issues and track how solutions were progressing.
■ Separate issues into those that could be solved by an agile process team and those that needed deeper, more complex technology fixes.
Zip Co then used these mechanisms to understand the problems and keep a lid on problem growth. They recognized that customer contacts were key insights into potential improvements.
BAD STORIES
Call-Tag Mania
A major bank used its frontline staff to “tag” the reasons customers were calling or sending emails. The system of dropdown menus they used enabled agents to select combinations of reasons over four levels. In total, there were over 2,000 alternatives! A cursory review showed that agents were 50% more likely to select the first option in the lower menu levels. In short, no one trusted the information’s accuracy, and there was too much detail. Every year the customer care team would have to justify why it needed more staff to answer queries by showing the rising level of customer calls and associated costs, but they couldn’t explain why the volume and workload was increasing. While attempts were made to charge other departments for the calls they caused, the other areas had no faith that they were being charged appropriately, so they resented the charges. Rather than working collaboratively on the reasons, the other departments would try to prove they were paying too much. The lack of good information meant that no one was working on the contact causes, and the rate of contact continued to rise.
Lost in the Weeds
A major pension administration company had purchased analytics tools to help explain to their clients (the pension funds) why their customers were calling and emailing them. The analytics team let the machine loose on 80,000 calls and came back with a lengthy report that had over 1,000 different contact reasons that the analytics had found. This wasn’t a great help. These 1,000 reasons were far too numerous, and the largest reason represented less than 1% of calls, meaning none of the individual reasons was worth actioning. The analysis went nowhere. The analytics didn’t work because the technology was given no guidance. To the analytics tool, the customer statement “My contributions are wrong” would be seen as different from “My contributions are missing” or “I want to question my contributions.” The language used was distinctive and different; therefore, the uneducated analytics tools selected them as distinct problems. In reality, they could be grouped as a single customer problem that could then highlight flaws in the organization’s contribution process. The machine should have been “trained” to group these similar expressions and see them as the same reason for contact.
Same Every Week
A major utility reported the drivers of customer contacts every week in reports to senior management. The drivers were grouped into eight large buckets, such as “billing,” “credit,” “moving house,” and “payments,” based on the options the customer chose in the menus on the IVR (interactive voice-response system). Each week the volume of each reason and their proportions changed very little, and there was hardly any discussion about what actions to take. The business accepted that contacts were unavoidable. A more detailed analysis that explored customer statements at the start of calls found there were about 40 common reasons. Of these, 20% of the contacts were for functions that the customer could have completed in some form of self-service. The “billing” calls included complaints about late bills, incorrect bills, and problems that customers had raised in prior calls. These real call reasons shed a much better light on the problems with the business than did the previous shallow reporting methods.
HOW TO UNDERSTAND
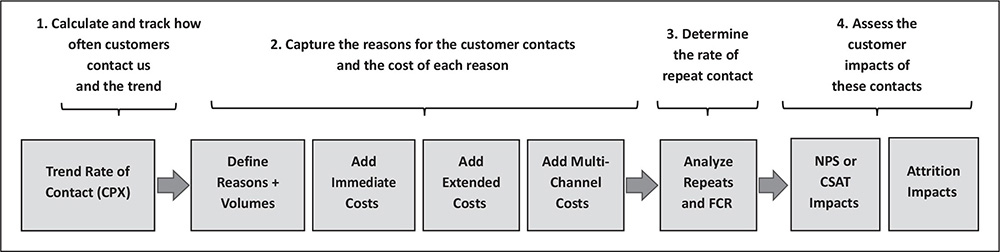
There are four levels in the Understand process (see figure 1.1) that deliver progressively deeper insights, each with more detailed steps. The goal of each level is to help the organization understand everything about contacts they receive, from their reasons to their costs, and how all of it affects customers and the organization.
This four-level approach had its origins in Amazon in the late 1990s and has been enhanced and proven over the next 20 years. The objective of these steps is to provide the fact base to drive strategic actions, determine appropriate ownership, and set priorities. The steps are critical for understanding today’s contacts, their trends, and their true costs and customer impacts. The process needs to start in one contact channel, usually in inbound phone calls, but it will be even more meaningful and actionable when all other channels are added.
Level 1: Calculate and Track How Often Customers Contact Us across All Channels and the Trends
It seems easy to say that we should “understand how often customers contact us.” Shouldn’t every organization be on top of this? If you pose the question to the CEO or CFO of most organizations, at most, they might know something like overall monthly or annual call volumes. But in most organizations, there is more data at the executive levels describing how quickly things get done (i.e., service levels for calls or emails) than there is trend data on contact volumes across channels. Few executives would know the volume of chat threads, the frequency with which customers used their app, or the trends in email traffic. As the number of contact channels has grown, it has become harder for leadership to stay on top of this demand picture and what it means.
In businesses where customer and transaction volumes are changing, it is also hard to assess if volume changes are proportionate or not. If the number of customers grows 20% in a year, is it to be expected that contacts also increase 20%? We’d say that it is unlikely to be a good outcome if customer and contact volumes move in lockstep; this would mean that the business is adding costs and friction at the same rate that it is adding customers. In a world where customer contact channels are evolving at great speeds, it is critical to know what is happening across all channels, along with their trends, and then to understand the demand in proportion to key business drivers like customer, account, or order growth.
FIGURE 1.1. Understand Approach
In table 1.1, a fictional example of a fast-growing airline illustrates the challenge.
This organization knows that calls more than doubled in two years when total customers doubled, that unique accounts grew 2.5 times, and that total flights quadrupled. Calls went up 250% in this period, and chats grew much faster. However, as noted earlier, we need to normalize the contact data to get to CPX (contacts per X) so that we can understand if the business got easier to deal with or added friction, as shown in table 1.2.
Examining the CPX ratios—or contacts per driver “X”—paints a very different picture. The ratio of calls per flight is falling, but adding in chat, the story is less convincing. This kind of analysis produces much greater insight as to whether the business is getting harder or easier to deal with (in this case, harder). Therefore, the three key actions are as follows:
TABLE 1.1. Core Measures for the Airline, by Year
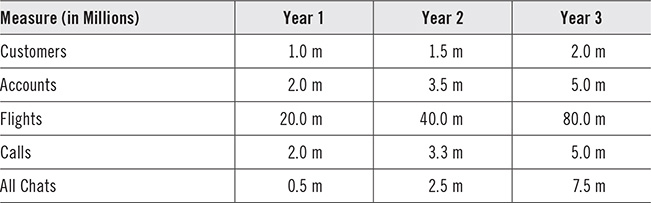
TABLE 1.2. CPX Ratios for the Airline, by Year
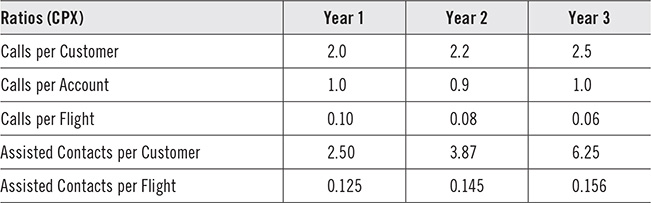
1. Determine which channels and contacts to include. In this example, we added calls and chats and then removed the automated chats handled by the bot.
2. Decide which denominator to use as the X in CPX (contacts per X).
This entails assessing which measure gives the best indicator of the growth or decline of the business. You might determine X to be the number of active customers, accounts, orders, embedded base units, or transactions. In this instance, we assumed that the number of flights is the best indicator of the volume of activity that could drive contacts.
3. Trend these key ratios over time with visualization tools. Figure 1.2 shows a significant increase in the number of contacts handled (both phone calls and chat messages), but since the number of customers rose less in the second chart, the company’s CPX, measured as contacts per customer, increased significantly over the first three years.
FIGURE 1.2. Contact Rate Visualization for the Airline, by Year
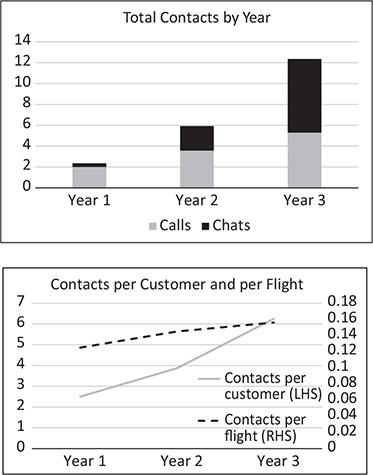
However, CPX measured as contacts per flight begins to plateau in year three, so while this is a good example of the path to becoming frictionless, this organization will need to double down going forward!
Level 2: Capture the Reasons for the Customer Contacts and the Cost of Each Reason
There are five steps that enable this level 2 action:
1. Understand the customer contacts at the right level of detail.
2. Associate all direct costs with each contact reason.
3. Attach all indirect or downstream costs.
4. Report customer contact volumes and costs by reason.
5. Add multichannel contacts and costs by reason.
Understand the Customer Contacts at the Right Level of Detail
Almost every organization collects contact reasons, but few of them do so at the right level of detail. Some organizations have thousands of customer reasons (the most that we’ve seen is 4,500, but 90% of them were never used, and 5% more were used once or twice during the year). Others have too few reasons, such as 8 to 10 major functional categories like “billing,” “payments,” and “maintenance,” that provide no direction. Unfortunately, neither extreme works well. Once an organization gets hundreds of reasons that are manually selected, no one trusts the accuracy, and the associated costs become so fractured that there appears to be little benefit in taking action. At the other extreme, having generic categories like “billing” or “payments” provides very little insight into what needs to be fixed or how to begin to attack the problems. We could label either extreme as “Too many to trust and act” or “Too few to add insight.” If there is a magic number, it is typically between 25 to 50 reasons for each product category or business function, but ideally these reasons span product categories.
Tracking the right level of detail is critical for the following reasons:
■ Analysis and strategies hang off of this classification.
■ Credibility with the business is dependent on getting it right.
■ Other analyses, like repeat contacts and customer impacts, also depend on it.
Understanding customer contacts requires building consistent contact categories using the reasons that customers state in their language (e.g., “Where’s the closest branch?”). This is different from the organizational view that sees that as an admin question. Techniques to identify these contact reasons include sampling contacts by listening to calls and reading emails or chat threads. A good way to start is to ask frontline staff via round-tables, surveys, or workshops. Germany-based fintech company N26’s former global director of customer operations, Carmen Beissner, followed this path to create actionable customer contact reasons: AI-tagged reasons in their chatbot plus agent coding during the live chat sessions.5
Organizations should be able to consolidate down to 25 to 50 unique reasons for each product group or business function since the reasons in customer care will be different from the reasons in other areas, like claims or technical assistance. It’s harder than it sounds to consolidate thousands of reason codes down to this magic 25–50 level, but one way to force the process is to sample enough volume to work out what the top reasons are. The 25–50 range is magic because it allows an organization to build the case to tackle the root causes that drive each reason. With too many reasons, the justification is harder, since each one will only account for <1% of costs. With too few reasons, either the problems aren’t clear or they amalgamate so many issues that the root causes and owners aren’t clear.
Associate All Direct Costs
The direct costs of each contact reason come from its handling time multiplied by the associated labor costs. But even that isn’t as easy as it sounds, because in contact centers, overall average handle times are fairly easy to collect but not at the reason level. For other channels, such as retail shops, email messaging, and chat, handle times are often not tracked at all. A range of methods can be used in the channels that do not track their time against contact reasons:
■ Use call listening samples to estimate handle time by reason.
■ Ask frontline staff to bucket the time by reason, using levels from “very long” down to “very short.”
■ Task frontline staff to track time for a short period.
■ Put the analytics to work to calculate durations.
■ Add handle time to the tick boxes that QA teams complete when sampling customer contacts.
■ Ask staff to keep logs in a tablet that can be analyzed.
Attach All Indirect or Downstream Costs
Few organizations factor in the indirect post-contact costs associated with contact reasons because those costs often lie in other areas of the business. For example, customer care may initiate a repair crew visit to a customer, but the repair costs are tracked by the dispatch or field operations team. The extent of these other costs varies by company and industry. Some industries have to roll a truck to send an engineer to the customer site or engage other suppliers in the process, such as energy network providers. The costs of these downstream activities can be far greater than the costs of handling the call or email. Additional costs can include writing off fees or issuing refunds and credits. Some contacts also kick off work in other teams, such as recalculating an invoice or revising a contract. Downstream costs therefore need to be quantified by tracking service requests, counting trouble tickets, and capturing transferred or escalated calls.
Calculating and applying direct and downstream costs will make a huge difference in understanding priorities as well as the potential benefits of tackling these issues. For example, cable TV and broadband provider Cable One knew that truck rolls to its subscribers’ homes represented significant costs. But it wasn’t until they associated these downstream costs with specific contact reason codes such as “My connection keeps dropping” that they were able to isolate the root causes and build the case for change.
Report Customer Contact Volumes and Costs by Reason
To ensure that all of an organization’s departments understand the issues that customers face, it is important to produce robust reporting of contact reason volumes, costs, and rates. Frequent and trusted reporting helps executives understand the impact of various types of friction on the customer. Reporting, in turn, connects the owners with the problems that their teams create. Initially, the reaction may be one of hostility and denial (i.e., “What does this have to do with my department?”) The steps in the next chapter, which deal with the Assign strategy, explain how to tackle that problem.
These costs and volumes become even more powerful by adding two key components:
■ Normalize each volume category against the business volume driver that was used to calculate CPX. It may be necessary to use different denominators (X’s) in different areas. In an insurance business, for example, contacts per policy may make sense for the customer care area, but in the claims function, contacts/claim may provide greater insight. Possible CPX metrics include CPT (contacts per transaction), CPnC (contacts per new customers), or CPeC (contacts per experienced customers), since CPnC is often three to five times higher than CPeC, CPD (contacts per device) (e.g., different mobile phones or set-top boxes), and CPA (contacts per account), as well as the Amazon duo of CPO (contacts per order) and CPU (contacts per units ordered).
■ Include sufficient time series and points of comparison so that trends are clear. Showing six-week trends for each reason will span monthly billing cycles, while other indicators, such as “this time last year,” add even greater insight. Figure 1.3 illustrates this week-by-week trending on a CPX-indexed basis. Most of the reasons were flat or down (which is good), but the left-most reason, which has the highest CPX, is rising (which is bad).
Add Multichannel Contacts and Costs by Reason
The analytics tools available today allow organizations to report contact reasons not just in call centers but across all channels. The call center is one of the harder and more expensive channels to apply analytics because calls usually include more than one reason and are often recorded as speech, so they have to be converted from speech to text. It can also be difficult to separate what customers said from agents’ responses.
Email, chat, and messages are all in text form, so basic text analytics engines can identify, parse, and match reasons in those channels, and they are often similar to inbound call reasons. Chat tends to be more specific to associated apps or websites, but generally for the same reasons codes can be used, with slight variations and adaptations.
Retail shop reasons (bank branches, product sales, etc.) are harder to collect because the interactions aren’t generally captured in any fashion.
FIGURE 1.3. Contact Rate Pareto Chart

A retail bank employee may enter a transaction or some customer notes, but conversations are not recorded or captured. For this reason, some organizations are now deploying many of their contact center tools to retail so that conversations can be captured in the same way.
Analytics tools can classify and analyze reasons in these alternate channels once they are converted to text. The harder part is allocating costs, because many interactions are often not measured and timed as they are in call centers. It is hard to measure the time agents invest in chat dialogues, for example, because they often manage multiple chat sessions at the same time. Similarly, with email, agents are often not timed per message, although it’s possible to do.
Level 3: Determine the Rate of Repeat Contact
Level 3 tackles the gnarly issue of FCR. Repeat contacts, which occur when problems aren’t solved the first time, and FCR are notoriously hard to measure. Customer research usually puts “Resolving my query” among the top three customer needs on any contact; if customers go to the effort to call, email, or chat, then they want an answer or a solution. The flip side of not resolving the customer query, or doing so in a way that wasn’t satisfactory or that they didn’t understand, is that they will make contact again. That’s if the organization is lucky; some customers simply give up and never return! Repeat contacts and FCR are mirror images and inversely linked. An operation that fails to resolve problems will get more repeat contacts. When customers were limited to one channel of contact (e.g., inbound calls), the repeat tended to occur in the same channel. In a multichannel world, the secondary or repeat contacts can and do turn up in other channels. For example, if a customer doesn’t get the answer to an email, they might then call or open a chat session.
Even in a single-channel world, it was hard to measure resolution and repeats, so much so that many organizations have resorted to two flawed techniques:
■ Assume that if a customer calls twice in a short period, it must be for the same reason and is therefore a repeat. This is an approximation, at best, because many contacts are not related, and most companies use an arbitrary seven-day period, which misses many repeats where the customer may not recognize the problem that fast.
■ Ask the customer in a survey if resolution was achieved. One problem with this is that, while an organization may commit to resolving an issue, it will still take some work, and customers usually don’t know whether the organization will follow through on actions that they promised. In other instances, the customer may have been put to work to resolve the issue, and they aren’t clear what will happen next.
There are four more accurate techniques to calculate FCR:
■ Listen to 100 or more contacts (for each reason) to get a grip.
■ Task the QA team to estimate FCR and repeats to get three for the price of one.
■ Add management processes to handle snowballs, or repeat contacts.
■ Use analytics to do repeat measurements.
Listen to Contacts to Get a Grip
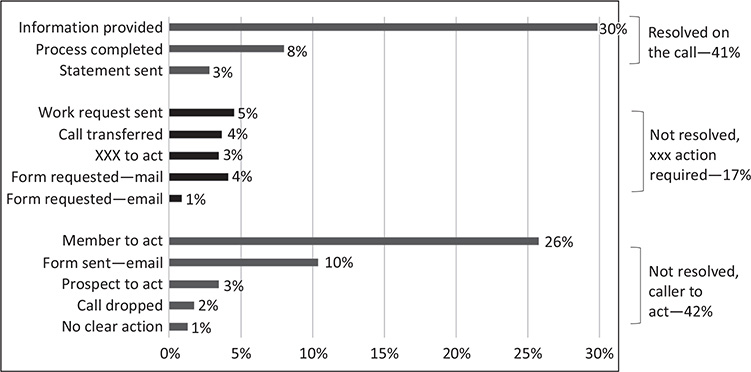
To get a grip on FCR and repeats, it’s useful to start by sampling contacts. It is relatively easy to ask an observer to assess whether the call or email was resolved and whether there were prior requests for help. This can be done by listening to see if customers mention prior contacts, or the analysis can assess prior history and analyze the actions that are needed at the end of a call or email. By separating solutions into buckets like “Customer to act,” “Workflow to initiate actions,” and “Agent to act,” it is possible to unpack resolution rates. For call observations, there can be 10 to 20 possible outcomes, of which some are resolved and some are not, as shown in figure 1.4.6
Quality Samples—Three for the Price of One
Many organizations use a QA team, team leaders, or third parties to assess their call or contact quality, and many outsource arrangements make this a key measurement for the contract. With a typical sample rate of 5 to 10 contacts per agent, per month, a contact center with 1,000 frontline agents might sample 5,000 to 10,000 calls each month. These samples are used to score the agents on compliance and other parts of the process. Since the call, email, or chat is being analyzed anyway, why not add an assessment of resolution and repeats? It seems obvious, but almost no one does that.
FIGURE 1.4. Example Resolution and Outcome Analysis
Manage Snowballs
Bill’s team at Amazon initiated a very sophisticated measurement technique, which they called Snowballs. The idea was that a repeat contact needs to be “melted” right away, or it will get bigger and become worse, creating a “snowball.” Assessments usually show repeat contacts to be 50% longer than initial contacts, and each subsequent contact tends to get worse—or snowball—as irate customers insist on escalation and resolution.
The idea behind Snowballs was that agents had to log any repeat contacts they took, and then Amazon’s CS team attributed the problem back to the person who didn’t resolve it the first time. This achieved four results:
■ Amazon could then measure each agent’s “net snowball rate” (generated versus resolved).
■ It focused agents on resolving both first-time and repeat contacts.
■ It provided feedback for training, process improvement, and quality.
■ It allowed Amazon to measure outsourced providers as well as in-house agents.
The only cost to this process was that agents had to log contacts as snowballs—a small price to pay for the benefits.
Later in the book, we’ll cover how to reduce the rate of repeat contacts and improve resolution.
Analytics to the Rescue
AI-based analytics can reveal repeat contacts automatically. Once the analytics can accurately report 25 to 50 reasons, it can also be trained to look for repeats of these contacts. This can create a much more accurate measurement because the analytics can look for the same contact reason in a defined period, making it clear to the organization that it is a repeat.
There are four further refinements that can be added to FCR analyses:
■ The period for a repeat can be tailored to the process. For example, some contacts might be related to a quarterly billing cycle. Therefore, if customers complain about a charge on the bill in month 1, they might not realize that they won’t see the charge fixed until the next billing cycle. In that case, the analytics would look for repeats one to three months later.
■ The analytics can look for related reasons for the same customer that may have been “spawned” by the first contact. For example, if a customer calls in month 1 because they believe they are on a plan different than they signed up for, then a month later, when the next bill arrives, they may call again and say, “My bill is wrong.” This is the first problem repeating in a different way.
■ The analytics can look for related contacts across channels. A chat request for an issue may lead to a call for the same thing if it isn’t resolved.
■ The analytics can start to report at the agent, product, and process levels and provide an overall view of repeats and resolutions.
FIGURE 1.5. Repeat Rates Mapped Against Contact Reasons
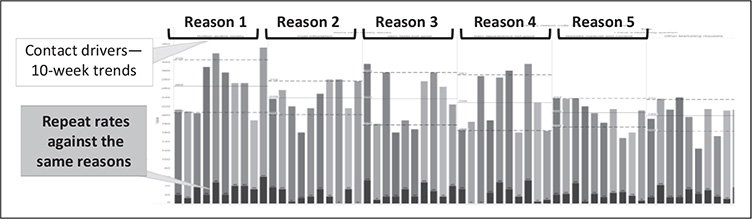
Some organizations have added repeat reporting to the same columns used to track contact reasons. The columns in figure 1.57 show the volume of contacts, and the sub-bars show the repeats for each reason.
We’ve summarized a very complex technique to identify repeat contacts and calculate FCR. This technique typically requires many workshops, analyses, and iterations to get the calculations correct; however, even using analytics to produce a simple “repeat by reason” code analysis, without sophisticated date ranges or multichannels, can produce solid insights.
Level 4: Assess the Customer Impacts of These Contacts
This final level in the Understand strategy rounds out an organization’s insight into the impacts on customers and revenue.
Determine What Score Best Defines Customer Experience
Organizations use many metrics to describe CX (customer experience). The most common examples are listed in table 1.3. Each one has a different purpose, benefit, and implication linked to contact reasons.
Each of these CX metrics provides different insights. Analytics techniques now enable organizations to link the data they have on reasons with these metrics; they also enable automation of some of the metrics. For example, rather than asking a customer about their effort (as many organizations do in surveys), the analysis tools should be able to calculate the effort and create a CES by combining the following:
TABLE 1.3. CX Metrics and Their Benefits, Implications
Customer Experience (CX) Metric | Benefits, Implications of Linking to Contact Reasons |
Net Promotor Score (NPS) and Customer Satisfaction | Proxies of advocacy and loyalty. May help indicate future revenue and how it varies by reason. |
Customer Lifetime Value (CLV) | Reveals if some contact reasons occur more with different customer segments and therefore impact higher- or lower-value customers. |
Customer Attrition or Churn | Linking to rates of attrition enables analysis of which contact reasons are attrition drivers and have a more direct revenue and cost impact. |
Complaint Rates | The extent to which these contact reasons lead to complaints. |
Customer Effort Score (CES) | Used to measure the total impact of this reason on customers and is a much better indication of the impacts on the customer. It gets the business thinking about cost to the customer rather than the company. |
Customer Process Analysis | This links reason codes to particular stages of the customer process, like joining or annual premium changes. It helps narrow the focus on which processes need to be reassessed. |
Subsequent Purchase Levels | Instead of focusing on scores and numbers, analyzes customers’ actual purchases after association with each contact reason and will predict how much irritation that reason causes. |
■ How long a customer may have taken to navigate menus or websites
■ Wait times
■ The contact duration
■ Hold times
■ The extent of repeat contacts
■ The percentage of related complaints
■ The extent of attempts to perform a task in multiple channels, such as in an app or chatbot
Linking these customer-pain metrics to reason codes can shape not only priorities but also the returns available after fixing the problem. This analysis can add a revenue dimension and provide a different level of analysis of which contact reasons are a priority. Associating measures like customer churn rates can turn the discussion from cost to revenue impacts. Where two contact reasons have similar costs, a customer metric will inform priorities and build a better business case. In some organizations, this can help move the focus from cost reduction to the benefits available from customer retention or greater advocacy. The other benefit of making a clearer linkage between contact reasons and these CX metrics is that contact reasons are often early warning signs of customers leaving or reducing their spend. For example, at one broadband provider, 50% of customers who called two or more times about problems with their connection later switched providers. It became very clear to this business that they had to manage those contacts better not only to prevent the problem from escalating but to prevent the loss of customers.
HINTS AND TIPS
Following are five useful lessons to learn about Understand.
Walk before You Can Run
One-off exercises to sample and unpack contact drivers get to action faster than three to six months of attempts to “boil the ocean.” In an organization with no understanding or analysis of the rate of contact and reasons, a sampling exercise can be done in weeks and then get the discussion going. A proper sample can highlight call reasons, FCR, and repeat rates and then flag priority areas. These simpler sampling exercises can also show the potential for investing more in techniques that will provide understanding on an ongoing basis.
Teach the Machine
Analytics companies will tell you that AI software will figure out contact reasons. While this can be true, the AI will figure it out faster and more accurately when you show it what to look for. Building variations of the top 25 to 50 reason codes, key words, and other related expressions will help to refine the analytics tool’s accuracy. Using manual sampling first can save several wasted iterations of AI analysis. In worst-case scenarios, AI may never get to the right level of detail, highlighting 1,000-plus reasons, which doesn’t really help.
Produce the Right Number of Reasons
Getting to the right number of customer contact reasons is hard but essential. With more than 50, the cost of each one does not look like it is worth tackling; fewer than 25, and they start to include too many root causes and too much detail, preventing the organization from understanding what’s happening. The 25-to-50 range is effective because it produces a reasonable concentration of costs and enough reasons to separate potential causes and owners.
Beware of Root Cause Seduction
Reason codes aren’t the same as root causes. When a customer states, “My bill is too high,” the root causes of that contact reason can be many and varied. It is tempting to try to get down to the root cause of each contact reason, but there is logic behind not doing that. First, the root cause may not be apparent; the customer may mention a cause but often does not. The cause may also not be clear to the customer-facing staff who handle the query. Asking staff to add root causes can create guesswork and waste time. For this reason, RCA (root cause analysis) should happen only once the reasons, volumes, and costs are clear. It may be important to distinguish among different reasons for something similar but only if the agent has to figure this out. For example, an agent who has to work out whether a customer hasn’t gotten an order because it is in the warehouse, out of stock, or with the shipping company is in a position to distinguish among those three.
Apply the Ownership Test
If a contact reason has multiple departments that could own solutions (e.g., billing and marketing), then it probably isn’t at the right level. It’s important to have only single owners. As a business constructs reasons, it’s worth considering whether there is a logical owner and, if there is more than one possible owner, deciding on how to break down and delegate that reason. There will always be situations where multiple departments have a role to play, because departments like IT and HR have functions that span many business processes. But wherever possible, it’s good to aim for reasons that can be owned by a single department with IT or HR in a secondary role. Doing so will be important for the next stage of the process.
SUMMARY
Understand is crucial if an organization wants to know whether it is causing or removing friction. The CPX gives an overall measure of the rate of contact and how easy an organization is to do business with. Trending this rate over time then shows whether an organization is getting better or worse. Getting insight into why contacts occur is hard to get right, but it creates the essential building blocks for deeper analysis and improvement. This insight also exposes issues in ways that help an organization focus on these problems and their solutions. It is also now possible to link all related costs to build a complete picture of the impact of problems and issues.
Organizations have talked about resolution and repeat rates for years, and many have used loose approximations that aren’t accurate. Now companies can measure these important indicators much more accurately, and these measures provide even more valuable information to drive real improvement. They can also provide multiple ways to analyze the effectiveness of people and processes. Modern analytical techniques now enable organizations to link data, such as churn or customer satisfaction rates, in ways that previously weren’t possible. This level of understanding equips an organization to assess how it can improve and what areas of friction to tackle.