
9
Implementing Continuous Integration
IoT and ML have brought about an explosion of intelligent connected devices that bring massive benefits to various sectors such as industrial, healthcare, and many others. However, with interconnectivity and intelligence comes a steep increase in the complexity of the software.
Factors such as security, over-the-air updates, and networking stacks are essential for connectivity. To enable ML, models may need to be refreshed multiple times a week to stay accurate. For rich OSs such as Linux or Windows, many of these complications are resolved at the OS level and abstracted from the application running on it. For embedded devices, this is typically not true, and that complexity is passed on to the software developer to sort out.
This step change in complexity for embedded devices is causing a major disruption to how embedded software is managed throughout its life cycle. A traditional embedded device, such as a washing machine from the 1990s, has its functionality frozen after manufacturing and installation. It is not connected to the internet and no further updates can be delivered. A smart embedded device, such as a washing machine from the 2020s, is connected to the internet and often receives updates to enhance functionality, performance, and security over time. This means modern software developers are not done with a project after its initial creation and must support that device software for months and years afterward.
The old, manual embedded software development flows are good enough for supporting traditional devices, but the new smart devices require a new, smart development flow. This chapter discusses that new flow, which is called continuous integration (CI). We will discuss the following:
- Understanding the value of CI
- Why embedded software CI can be challenging
- Examples of CI flows
Understanding the value of CI
CI is a best-practice framework for software development that aims to improve software quality while reducing development time and cost. It can best be described by contrasting it with the typical embedded software development flow, which we call desktop development.
In the desktop development situation, a team of software developers all works on the same code base at the same time, typically using GitHub or a private code repository. As each developer works, they send their modified code through their own non-standardized custom suite of tests with the hardware board on their desk, about once per day. This code is merged into a shared branch with their team. Developers then pull the shared branch back to their local environment to obtain changes from their team. At this point, the code may or may not be in a working state, and it is sometimes hard to identify the source of bugs that have been introduced by the interaction of different changes.
This flow may sound familiar to you, even if it doesn’t match your experiences exactly. It has been the most common way to develop embedded software for the past few decades, though it comes fraught with challenges. These include the following:
- Merge conflicts: Occur when two developers try to combine non-compatible code to the shared repository.
- Hard-to-fix bugs: Occur when recently committed code breaks the software in an unknown or complicated way.
- Duplicated efforts: Occur when commits are not done often – developers can solve the same problem and waste time.
- Inconsistent metrics: Occur when there is no evidence of code quality through robust test analysis.
- Near-release chaos: Occurs when everyone tries to commit their slightly incompatible code versions to the main branch, resulting in many problems.
- Production errors: Occur when bugs from development make it into the end product, causing a myriad of unfortunate side effects.
Implementing a CI flow can avoid or lessen the impact of these challenges. In the CI situation, a team of software developers still works on the same code base at the same time. However, each developer commits and merges small code changes to their code branch about every hour, not every day. On this commit, a CI process automatically starts building the full code base to run a standardized regression test suite. As the code passes each stage of testing, it can be pushed to checkpoint branches to automatically keep a trail of working code. After these tests, the changed code is automatically merged with the development branch. This ensures that this branch is always in a working state and up to date. Developers then pull this code back to their local environment and continue working.
This flow addresses the challenges listed earlier in the following ways:
- Merge conflicts: Due to the frequency of commits and pulls from the main branch, these conflicts are minor and simple to fix.
- Hard-to-fix bugs: Code changes are uploaded in small increments, making changes and revisions easier.
- Duplicated efforts: Frequent commits identify areas of overlapping efforts quickly.
- Inconsistent metrics: Metrics are automatically generated and recorded for every code commit.
- Near-release chaos: Everyone’s code base is compatible during the whole development process.
- Production errors: CI enforces frequent testing and an understanding of code coverage, helping to prevent these bugs.
In addition to avoiding these issues, having a robust CI flow leads to higher code quality and faster development time. It seems as though everyone should be doing it! Unfortunately, implementing CI flows for embedded software has historically been more difficult than CI flows for a website or a Windows, Linux, or macOS application. The next section discusses these challenges and what can be done to mitigate them.
Why embedded software CI can be challenging
Creating software gets harder when you develop on a platform different from the platform you deploy on. When developing a website that will be deployed on a Linux-based server, developing on a Linux machine makes it easier to validate software behavior, as development tests will match the production environment. You could use a Linux laptop or a virtual machine to replicate this environment locally. Further, it is easy to access rich OS machines en masse via cloud platforms that offer Linux, Windows, and macOS operating systems.
By contrast, we still develop embedded projects on laptops and PCs but deploy them onto totally different hardware. Developing a smart lightbulb powered by an Arm Cortex-M7 on a Windows laptop is challenging due to this mismatch of platforms. The mismatch requires cross-compilers and, the primary issue, dedicated testing hardware.
It is relatively trivial to spin up dozens or hundreds of Linux instances in the cloud that can run tests for a website under development. There is no problem accessing these platforms and cloud providers have made it easy to dynamically pay for what you need to scale effectively. This advantage does not extend to embedded software developers.
For individuals or very small teams developing software for an embedded device, it may be enough to have a few hardware boards lying around that can test software functionality every day or so. For most embedded software projects, however, the need to validate software through suites of regression tests in a CI flow on hardware is a major challenge.
The most common solution is a local board farm. This farm contains dozens or hundreds of development boards that can run a lot of tests in a reasonable time. Having this does enable CI development at scale, but comes with two large drawbacks:
- Maintenance: Keeping even dozens of boards in a working state and ready to test with is no small task. Boards can wear down after too many flashes, can malfunction, needing a physical reset to be pressed, or require large rooms to store them, which may require cooling. Moreover, even organizing that many boards becomes a challenge at scale.
- Cost: This setup and maintenance can get very expensive. Supporting software for years requires running tests and keeping older hardware around in addition to newer projects, making costs increase over time.
It is often a hard sell to implement a CI flow for embedded software with these significant problems, despite the added benefits. There is an alternative solution for embedded developers to see the advantages of server-based tests and that is with virtual hardware.
Replacing board farms with virtual farms
In Chapter 3, Selecting the Right Tools, we introduced an alternative platform for running embedded software: virtual platforms. We have been leveraging Arm Virtual Hardware (AVH) throughout this book and it is an excellent platform for implementing CI flows at scale. Because AVH runs in the cloud, it is simple to scale up and down.
An important caveat to this solution is that virtual platforms are limited by what they model. There are AVH systems that represent all Cortex-M CPUs, but they will not represent your exact hardware. Specific peripherals you are leveraging, such as Bluetooth, Ethernet, Wi-Fi, sensors, and displays will likely not be the same between the AVH system and your end device. This does not invalidate the advantages of using AVH for CI tests, but it does require an understanding of what software to test where.
Important note
Some AVH systems are starting to represent the software behavior of physical development boards almost exactly, including peripherals, displays, and communication. The Raspberry Pi 4 is modeled in this way. The scope of development boards available is limited at the moment but may become more extensive over time.
All tests are not made equal. We can split them into three different categories that differ in what the software test is trying to accomplish:
- Unit tests: Intended to test each individual software component in the smallest chunks possible. These often test individual functions in isolation to ensure they give the correct output with the right inputs. They immediately detect broken code in isolated areas and identifying errors at this level is much easier than in broader tests. They can number hundreds or thousands of tests (sometimes tens of thousands in massive software projects, such as for a self-driving car).
- Integration tests: Intended to validate that the interactions between components are working as expected. Errors can occur in communication between systems, functions, or code units, and these tests identify these problems. They can number dozens or hundreds of tests.
- System tests: Intended to verify that the complete software system is working as expected. They are also referred to as black-box testing, where the inner workings of the system are not evaluated, only the result. These are often used to ensure the system meets project requirements. Often a dozen or fewer of these tests are created.
Regression suites primarily consist of atomized unit tests, with integration tests and systems being far fewer in number. These unit tests validate the functionality of small chunks of code that often center around processing capabilities and don’t require the entire system to run effectively. This combination makes them the perfect candidate for running on virtual platforms, which are functionally accurate for the areas they represent. Integration tests, depending on what they cover, can be run either on virtual platforms or physical hardware. System tests should always be run on physical development platforms, or the end device if possible, to be as accurate as possible to the end system.
The most successful embedded CI flows will have a large number of virtual platforms running automated unit tests and a small number of hardware boards running automated integration and system tests. Call it a virtual farm and a board garden to lean into the visual metaphor even more:

Figure 9.1 – A large virtual farm and small hardware garden
Examples of CI flows
Now we will look at implementing three different types of CI flows, ranging from very simple to more advanced. As referenced in Chapter 3, Selecting the Right Tools, automated testing environments have a natural trade-off: simpler implementations often lead to less test replicability and setup longevity, and vice versa. The goal of showing these three examples is to reduce the barrier to implementing a quality CI flow for your specific project’s needs.
The three examples will be as follows:
- Simple test scripts
- In-house board farm setup
- A virtual farm with AVH
1 – Simple test scripts
To replicate the example in this section, you will be using the following:
|
Platform |
NXP LPC55S69-EVK |
|
Software |
hello world |
|
Environment |
Personal Computer |
|
Host OS |
Windows |
|
Compiler |
Arm Compiler for Embedded |
|
IDE |
Keil MDK-Community |
This example describes a flow useful for an individual developer looking to run a suite of builds and tests locally to a board sitting on their desk. The flow is not intended for large-scale projects but is a step up from no tests at all. It is lightweight and a good choice for quick prototypes or when starting a larger project.
The goal is to verify that after making some software changes, the code base still compiles and runs without error. We will use the hello world-provided software for the NXP LCP55S69-EVK board from the CMSIS-Pack in Keil MDK, which you can obtain the same way as the blinky example for the NXP board in Chapter 4, Booting to Main.
This Windows batch script has two commands. The first automatically builds the hello world project and sends the output to a file called BUILD_OUTPUT.txt, and the second automatically runs the hello world project and sends the output to a file called RUN_OUTPUT.txt. To put this in context, a developer could run this script after making interactive changes to their code and merging it with others to verify that nothing broke at a high level. It assumes you are in the same directory as the µVision project:
C:Keil_v5UV4UV4.exe -r .hello_world.uvprojx -o BUILD_OUTPUT.txt -j0
C:Keil_v5UV4UV4.exe -f .hello_world.uvprojx -o RUN_OUTPUT.txt -j0
These commands call the µVision IDE but run it in a headless mode without the GUI due to the -j0 option. The -r option specifies a rebuild, while -f is for flashing the board. When running with the NXP board plugged in, we get an output similar to the following in BUILD_OUTPUT.txt:
*** Using Compiler 'V6.18', folder: 'C:Keil_v5ARMARMCLANGBin'
Rebuild target 'hello_world debug'
compiling board.c...
...
compiling TransformFunctions.c...
linking...
Program Size: Code=6700 RO-data=1272 RW-data=2056 ZI-data=3172
"debughello_world.out" - 0 Error(s), 0 Warning(s).
Build Time Elapsed:  00:00:07
The following output is in RUN_OUTPUT.txt:
Load "debug\hello_world.out"
Info: LPC55xx connect script start
Info: APIDR: 0x002A0000
Info: DPIDR: 0x6BA02477
Info: LPC55xx connect script end
Info: AP0 DIS: 0
Erase Done.Programming Done.Verify OK.Flash Load finished at 17:23:30
Checking manually, we can see the build was successful with no errors or warnings, and the flashing was verified and successfully flashed the board. As an example of an error state, if we run the same script without the board plugged in, RUN_OUTPUT.txt looks as follows:
Load "debug\hello_world.out"
Internal DLL Error
Error: Flash Download failed  -  Target DLL has been cancelled
Flash Load finished at 17:19:42
This example does not explicitly test for any results, nor does it automatically read the output of these files to inform of an error, but both expansions are possible with more scripting. Implementing this simple local scripting is a low-overhead CI flow that really is just manual testing sped up. A proper CI flow is kicked off automatically on a developer code commit, which the next example will highlight.
2 – In-house board farm setup
To replicate the example in this section, you will be using the following:
|
Platform |
Server |
|
Software |
Dot product |
|
Environment |
Jenkins |
|
Host OS |
Linux |
|
Compiler |
GCC (for x86) |
|
IDE |
- |
This example describes a more robust CI flow, used at many companies today, of a central in-house server running a suite of regression tests on developer commits. Traditionally, this server is connected to a proper board farm, with dozens of boards connected and ready to be accessed. This example will feature the same setup but will swap the targets from boards to native host code testing, highlighting another style of regression testing in context.
The goal is to validate that after any developer commits to a certain code base, the software still builds and runs correctly, and gives the expected results. Upon committing to a specific code base, a Linux computer running the Jenkins CI controller will automatically detect this change and perform a build and run. To accomplish this, we need to initialize the tools in these steps:
- Installing Jenkins
- Publishing Jenkins
- Creating a GitHub webhook
- Creating a Jenkins pipeline
Installing Jenkins
The first step is to install Jenkins on an Ubuntu Linux machine. You can use an AWS or GCP instance if desired for this example – if you do so, then make sure to connect over VNC or forward the Jenkins port 8080 to configure Jenkins via a web browser. We are using a Linux laptop on our desk and we recommend the same if you plan to extend this example to connect to a physical hardware board later.
To install Jenkins, you can follow the instruction at this link to obtain the most recent Jenkins version using a few commands: https://pkg.jenkins.io/debian-stable/. After installation, navigate to your localhost port 8080 on any web browser: localhost:8080/. Follow the initial setup instructions. Unlock the software with a secret password in a file, select the Install suggested plugins button, and then set a username and password. This will fully install Jenkins, which will automatically start when restarting your computer, running as a service in the background.
Publishing Jenkins
We now need a way for a GitHub repository to notify Jenkins when a change has been made to trigger a build/run test script. In an active project in a company, there may be several differences in implementation here. The code base may be on a local Git repository connecting to an in-house CI controller machine, or a public GitHub repository connecting to AWS EC2 instances. This example will connect our Linux PC to a public GitHub repository over the internet, showcasing the functionality.
To do this, we will need to pipe our Jenkins service running on a local PC to a public GitHub repository. ngrok provides a simple way to accomplish this for testing purposes, as it is free for non-commercial use. First, download the ngrok package from this site: https://ngrok.com/download. Then, extract it from the terminal:
sudo tar xvzf ~/Downloads/ngrok-v3-stable-linux-amd64.tgz -C /usr/local/bin
Add an authtoken (which you can get during signup, ensuring you have a unique token):
ngrok config add-authtoken <token>
Then, start a tunnel on port 8080 for Jenkins:
ngrok http 8080
This will create a tunnel for your Jenkins service to be accessible over the internet. You will see a popup as follows:
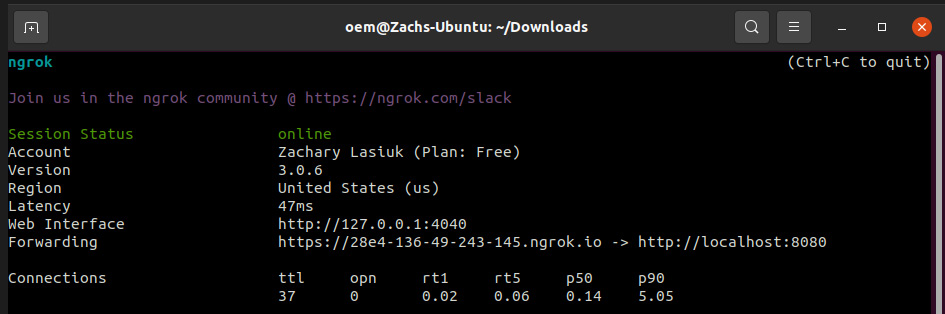
Figure 9.2 – The command line after starting ngrok
Navigating to the web address under Forwarding will connect to your Jenkins service. This is the URL we will provide to GitHub.
Important note
We only recommend keeping this open during your testing, not exposing your computer to the public internet for longer than trial prototyping. Proper security measures should be put in place in a production environment.
Creating a GitHub webhook
Next, we will create a webhook for a GitHub repository to notify Jenkins of any commit changes. To do this, see the following:
- Fork the repository for this book into your own account.
- Navigate to Settings | General | Webhooks to add a hook.
- Under Payload URL, enter the URL from the previous step with /github-webhook/ at the end. For this example, disable SSL verification (again, this is only recommended for brief prototyping).
- Trigger the webhook on Just the push event, which will notify Jenkins of any commit change to the repository.
- Finally, select Update webhook to finish:
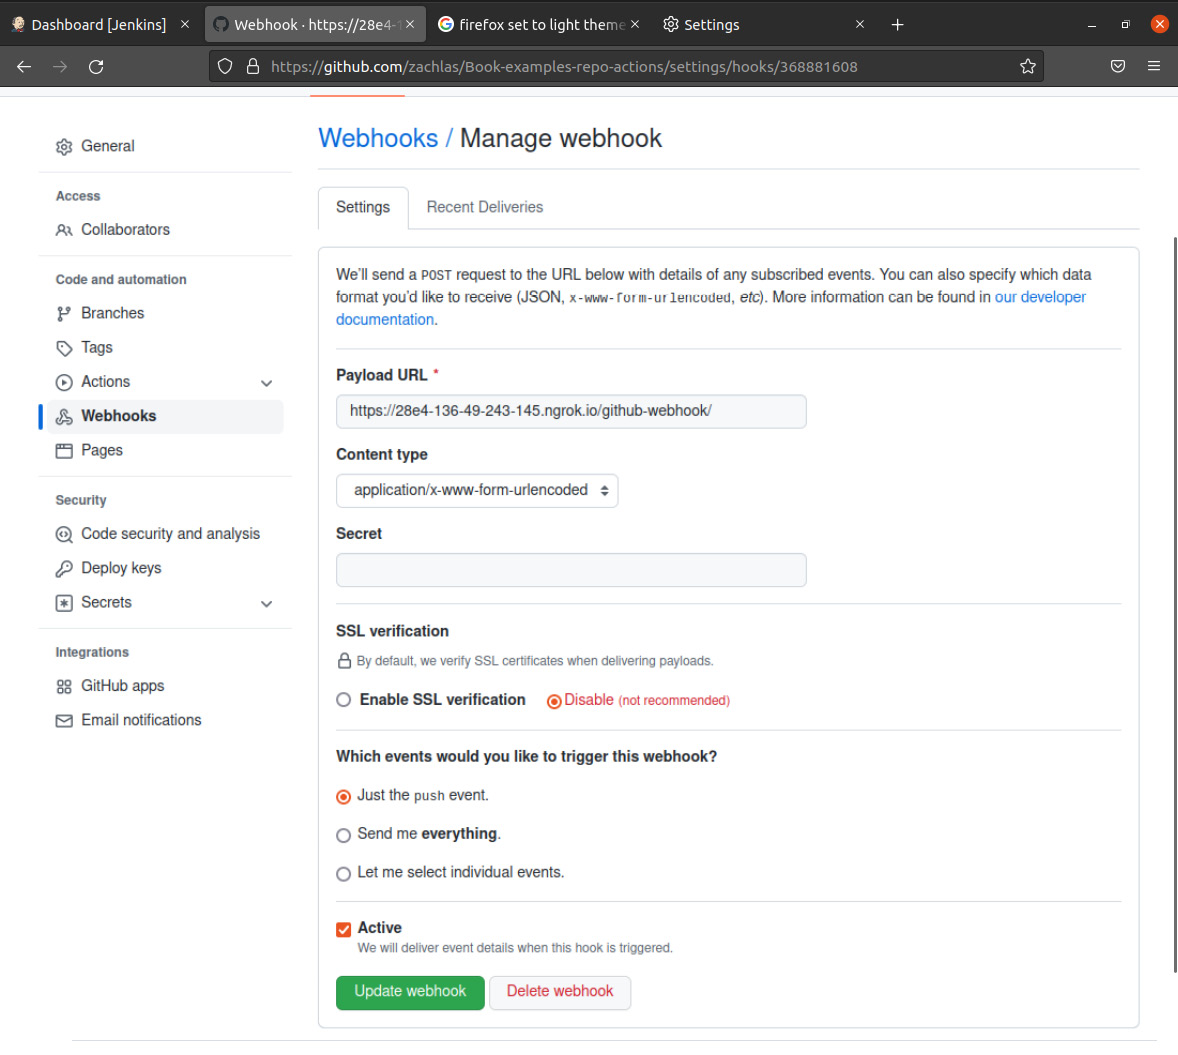
Figure 9.3 – Setting up a GitHub webhook
Your GitHub repository is now set to trigger a Jenkins job upon changes.
Creating a Jenkins pipeline
We will now tell Jenkins to listen to our GitHub repository in a specific testing pipeline and kick off some tests:
- Return to Jenkins on your Linux machine, and from the left-hand pane of the Jenkins dashboard, select New Item. Select Freestyle project from the list.
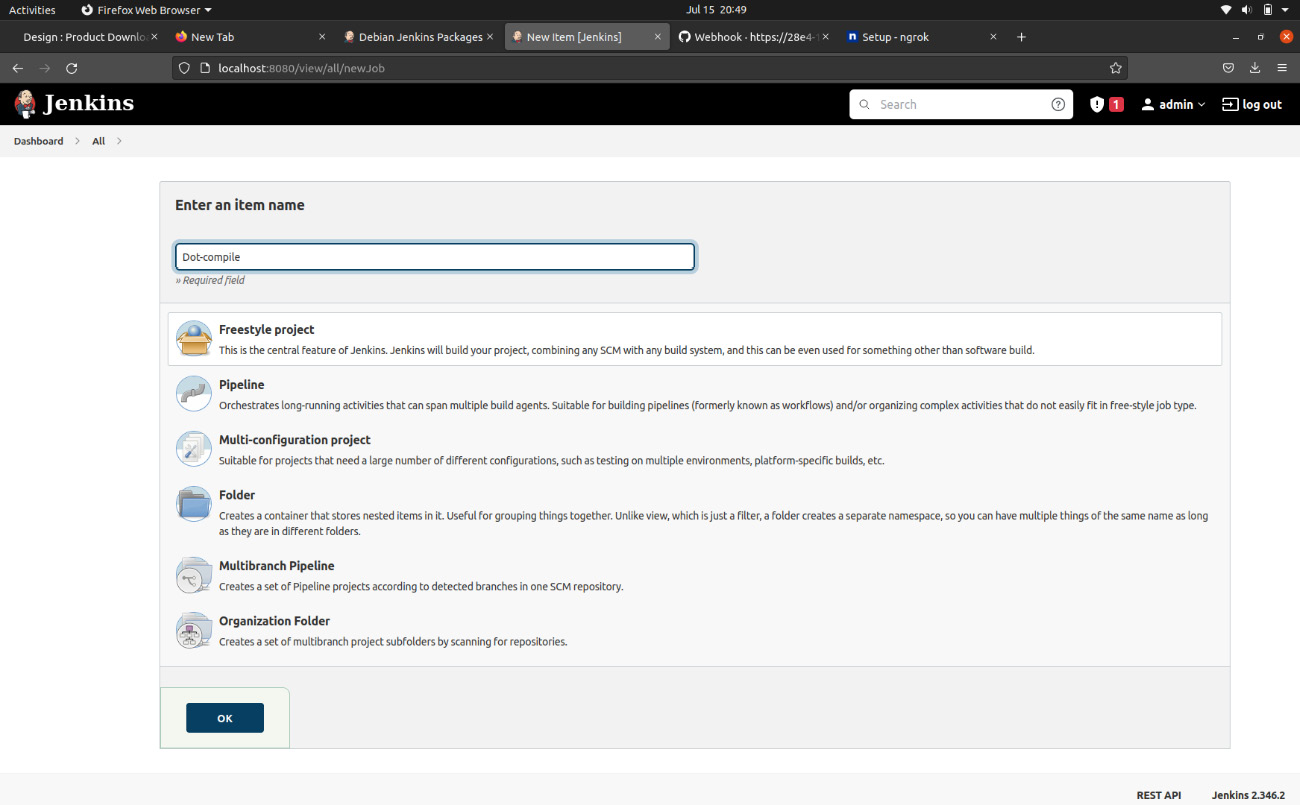
Figure 9.4 – Setting up a freestyle project in Jenkins
- Here, we name it Dot-compile, as we will be testing the build and running a simple dot product file used in a previous chapter.
- To set up the freestyle project correctly, provide any description first and head to the Source Code Management section. Here, you will need to provide a GitHub repository URL. To ensure a validated connection, you can leverage a GitHub personal access token. This token has replaced passwords for authenticating Git operations. To generate a new token, follow these instructions from the GitHub docs: https://docs.github.com/en/authentication/keeping-your-account-and-data-secure/creating-a-personal-access-token. Make sure to give your token full control of repository hooks for Jenkins to properly interact with GitHub.
- After this process, you will want the repository URL to look as follows:
https://<access token>@github.com/<userName>/<repository>.git
- Next, under Build Triggers, check the checkbox labeled GitHub hook trigger for GITScm polling. This will trigger this job on every code push event.
- Finally, under Build, we specify what commands Jenkins will run after being triggered. In this example, we give it two separate build events. The first is build, which navigates to the correct directory on the Linux machine where Jenkins automatically pulls the updated code, removes any previous build artifacts, and compiles a new dot-simple executable:
echo "Starting build…"
cd /var/lib/jenkins/workspace/Dot-compile/dot-simple
rm -f dot-simple
gcc dot-simple.c -o dot-simple
echo "Build complete."
The second event is really a run event that gives execution privileges to the generated file and runs it:
echo "running app…"
cd /var/lib/jenkins/workspace/Dot-compile/dot-simple
chmod +x dot-simple
./dot-simple
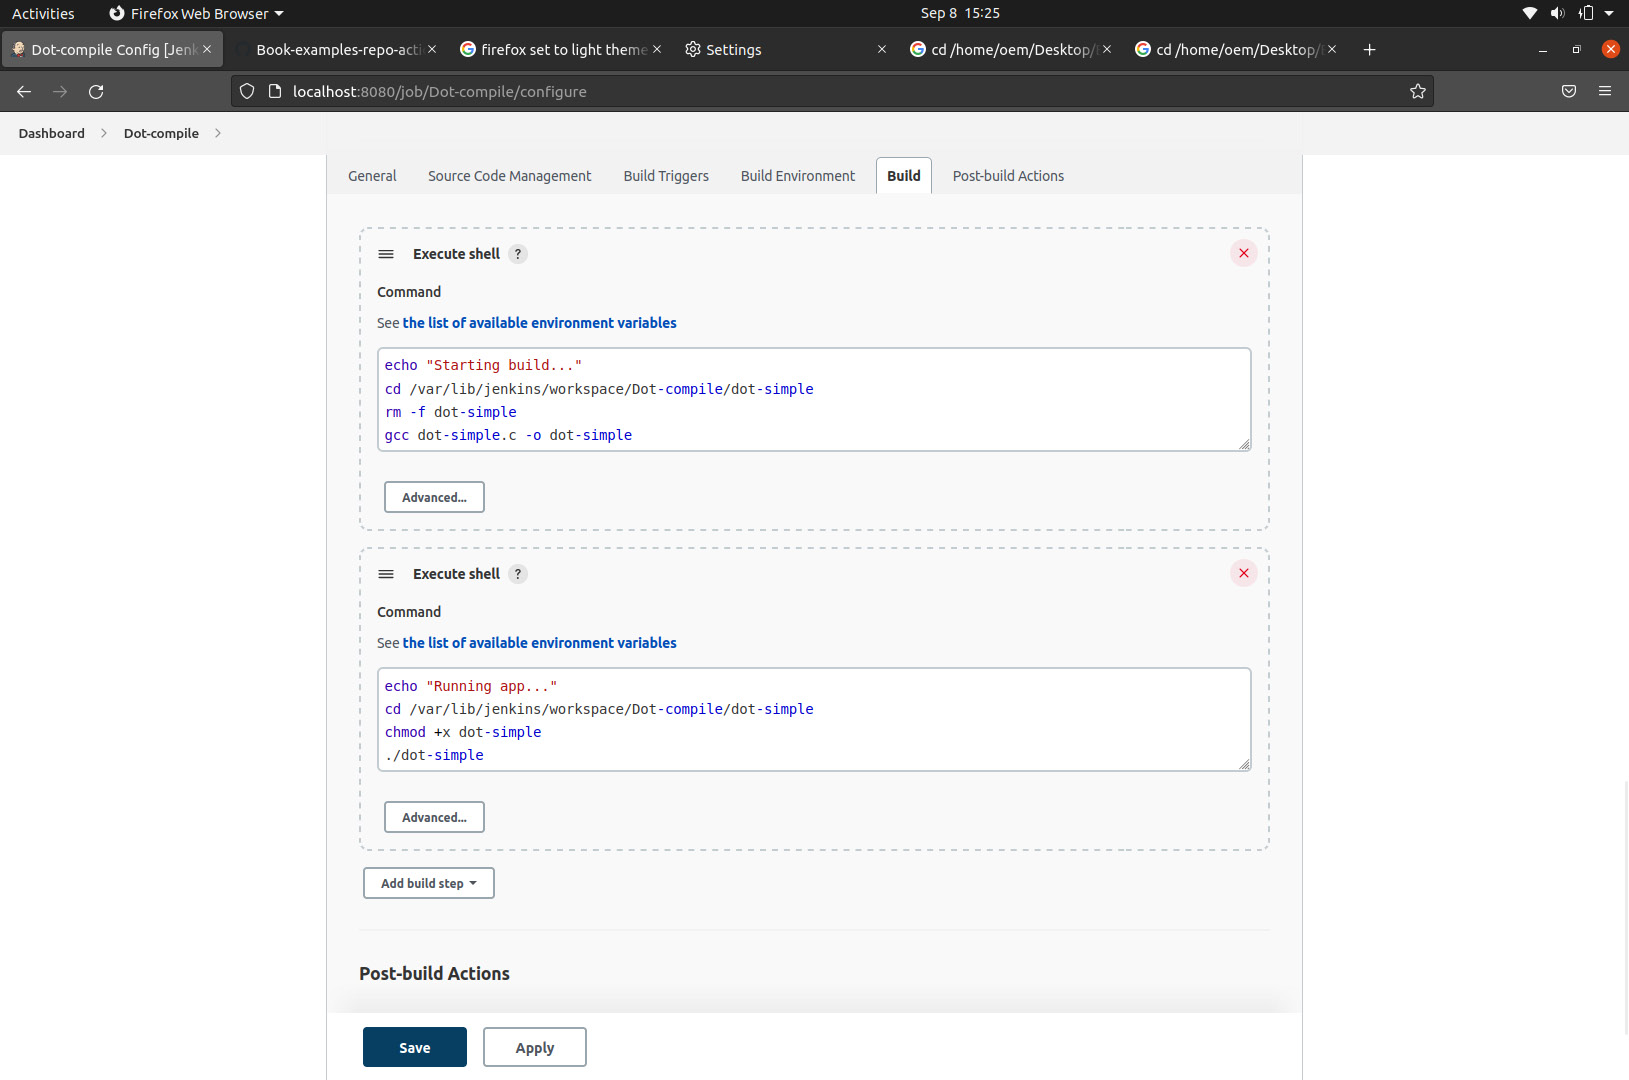
Figure 9.5 – Specifying the commands for the CI pipeline to execute
As mentioned previously, this example is running the dot-product algorithm natively on the Linux computer without the boot code specific to any Cortex-M hardware. These commands can be modified to build and run for the NXP board or Pico board.
- Lastly, in Post-Build Actions, you can specify an email address to be notified on each job event, which is helpful for staying up to date with automatic runs.
- Apply the changes and save the job to finish this setup.
You are now ready to test this out in practice.
Running your new CI pipeline
Now, try to push any change to the forked GitHub repository while keeping an eye on the bottom-left-hand side of your Jenkins Dot-compile job screen. Make sure you are viewing localhost:8080/job/Dot-compile/ to see the run happen in real time. After you commit to the GitHub repository, you should see a new build happening in real time. Upon clicking on that job, you should see the following output, indicating a successful build and run with the latest version of your code:

Figure 9.6 – The output of the CI pipeline
Important note
The newly updated GitHub repo is being downloaded to a specific location on the Linux PC to run builds and tests on. With this setup, you can make as many commits as you want to the repository. Other developers can as well – the same jobs will run every time.
While the overhead to set up this flow can be complex at first, the returning value from these tests can be excellent. Proper board farm setups run many tests in parallel on many connected boards, giving rapid feedback to developers if a code change has caused any issues and where those issues have arisen. CI flows can combine running tests on boards and the host machine – it depends on the specific needs of the software project. If running code on the host machine for proper development, a container system such as Docker is optimal to provide consistent results and system isolation.
Our recommendation for developers is to use the concepts of this board farm approach on a small scale for integration and system tests, in a small board garden. In parallel, scaling up unit tests on virtual platforms such as AVH can dramatically increase scalability. The next example will describe how to set up regression tests on AVH.
3 – A virtual farm with AVH
To replicate the example in this section, you will be using the following:
|
Platform |
Arm Virtual Hardware – Cortex-M7 |
|
Software |
AVH-AWS_MQTT_Demo |
|
Environment |
GitHub Actions |
|
Host OS |
Linux running on AWS AMI |
|
Compiler |
Arm Compiler for Embedded |
|
IDE |
- |
The virtual hardware CI flow is broadly recommended for scaling up software testing, specifically for smart device development. Smart devices require software development flows that allow engineers to make frequent secure software updates with minimized manual intervention. Cloud-based development practices can support this new era of intelligence at the edge. CI practices allow for the robust automation of software development and allow data scientists to independently fine-tune and update ML models without needing any manual integration of firmware. Especially important for ML updates is the concept of Continuous Delivery (CD), which extends CI from just validating software to deploying software automatically, keeping updated working code in production at all times.
With AVH, you can not only develop your software without having access to a board but can also run and scale the CI infrastructure in the cloud, with potentially several hundred virtual boards being launched in the cloud in seconds and all test suites running in parallel.
We will now look at how to set up a development workflow with cloud-based CI for testing an embedded application on AVH.
Understanding the GitHub Actions workflow
Similar to the previous example, a developer commits their code to a shared repository, which then triggers the execution of a CI pipeline. This example, instead of using Jenkins as the CI controller, uses GitHub Actions instead. This CI pipeline includes automated building and testing of the application on the AVH target that is running in an AWS AMI. It also includes posting the build and test results of your code to a GitHub Actions repository to make viewing the status simple:
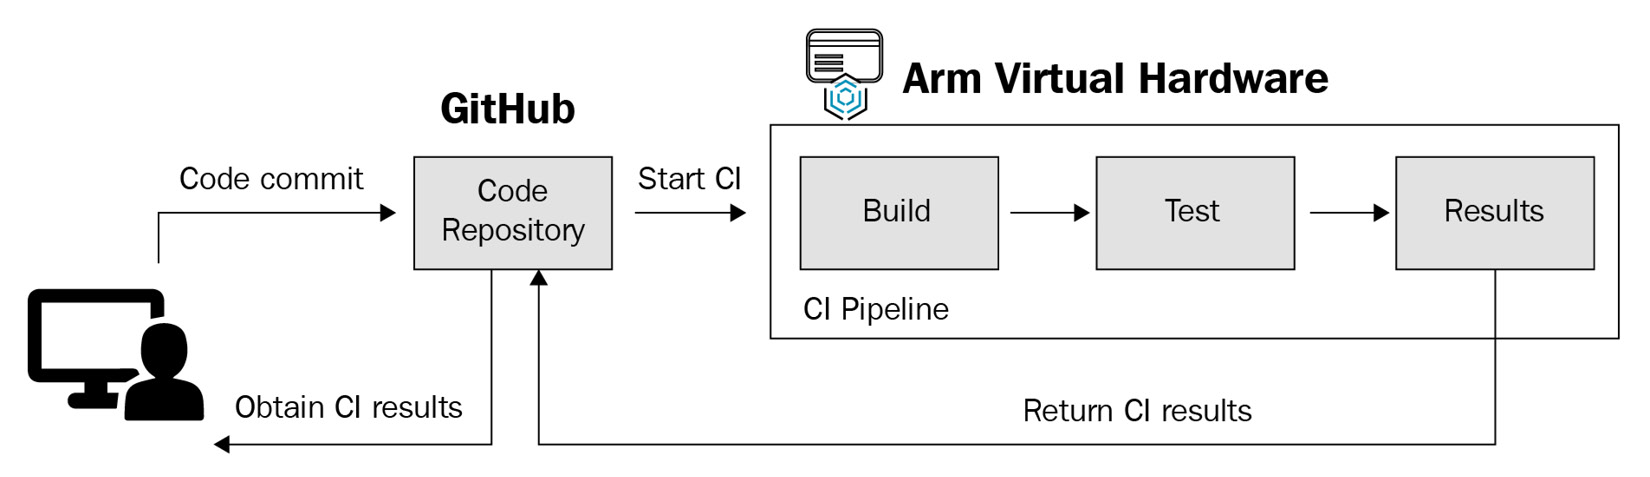
Figure 9.7 – A flow diagram of a GitHub Actions-enabled CI pipeline
In this example, we will leverage the AVH-adapted version of the AWS MQTT demo software project to detail the steps required for setting up a CI pipeline using GitHub Actions. The source code for this project is at https://github.com/ARM-software/AVH-AWS_MQTT_Demo. At a high level, this software project runs an IoT application on a Cortex-M7 AVH FVP and communicates to the AWS cloud services. While we are not going into the details of the application itself and rather focusing on steps to create a CI pipeline for it using GitHub Actions, you can read about the details of the application at https://arm-software.github.io/AVH/main/examples/html/aws_mqtt.html and https://docs.aws.amazon.com/freertos/latest/userguide/mqtt-demo-ma.html.
In contrast to the last section, where we initialized the Jenkins CI job in a GUI, GitHub Actions uses workflows that are defined in the .github/workflows directory of your repository to set up and execute the CI pipeline. These workflows are written in YAML and you can learn about them in complete detail at https://docs.github.com/en/actions/using-workflows/about-workflows.
The GitHub Actions workflow for this example can be found here: https://github.com/ARM-software/AVH-AWS_MQTT_Demo/blob/main/.github/workflows/cortex_m_virtual_hardware.yml.
We will walk through this workflow file and break down what each snippet of the workflow does. This is the first bit of code:
name: Cortex-M7 Arm Virtual Hardware

on:
  push:
  pull_request:
  workflow_dispatch:
Each workflow can be triggered by different events. The Cortex-M7 Arm Virtual workflow is triggered by either a push or pull request submitted into the code repository. This workflow can also be triggered manually either from the GitHub Actions GUI browser interface or using the API:
env:
  AWS_ACCESS_KEY_ID: ${{ secrets.AWS_ACCESS_KEY_ID }}
  AWS_SECRET_ACCESS_KEY: ${{ secrets.AWS_SECRET_ACCESS_KEY }}
  AWS_DEFAULT_REGION: ${{ secrets.AWS_DEFAULT_REGION }}
  AWS_S3_BUCKET_NAME: ${{ secrets.AWS_S3_BUCKET_NAME }}
  AWS_IAM_PROFILE: ${{ secrets.AWS_IAM_PROFILE }}
  AWS_SECURITY_GROUP_ID: ${{ secrets.AWS_SECURITY_GROUP_ID }}
  AWS_SUBNET_ID: ${{ secrets.AWS_SUBNET_ID }}
As this application is running on the AVH target in the AWS AMI, all the required AWS-sensitive credentials needed to start a new AMI instance must be provided as GitHub secrets. For the workflow to access these GitHub secrets, the preceding environment variables are set. If you are not already familiar with GitHub secrets and how to work with them, this document from GitHub (https://docs.github.com/en/actions/security-guides/encrypted-secrets) introduces the concept well:
jobs:
  cortex_m_generic:
    runs-on: ubuntu-latest

    name: Cortex-M7 Virtual Hardware Target
    steps:
    - name: Checkout
      uses: actions/checkout@v2

    - name: Set up Python 3.10
      uses: actions/setup-python@v2
      with:
        python-version: '3.10'
GitHub Actions workflows require a runner that executes the job and all the steps defined here. You can use either a GitHub-hosted runner or provide your own self-hosted runner for the jobs. Here, we are using a GitHub-hosted Ubuntu runner, which enables us to go completely hardware free – no need for in-house servers or board farms here. Standard GitHub Actions are then used to check out this repository, making it available in the runner’s workspace, and installing Python version 3:
- name: Install AVH Client for Python
      run: |
        pip install git+https://github.com/ARM-software/[email protected]
In the next step, we install something called the AVH Client. The AVH Client is essentially a Python module and it is used here to manage the connection to the AMI, well as for uploading, building, and running the application on the AMI:
- name: Prepare test suite
      env:
        MQTT_BROKER_ENDPOINT: ${{ secrets.MQTT_BROKER_ENDPOINT }}
        IOT_THING_NAME: ${{ secrets.IOT_THING_NAME }}
        CLIENT_CERTIFICATE_PEM: ${{ secrets.CLIENT_CERTIFICATE_PEM }}
        CLIENT_PRIVATE_KEY_PEM: ${{ secrets.CLIENT_PRIVATE_KEY_PEM }}
      run: |
        cd amazon-freertos/demos/include
        envsubst <aws_clientcredential.h.in >aws_clientcredential.h
        envsubst <aws_clientcredential_keys.h.in >aws_clientcredential_keys.h
There are certain connection and security parameters that need to be set for communication between the AWS IoT service and the application we run on the AMI. We get these connection parameters from the AWS IoT Core service that we described in the previous chapter. These parameters are saved as GitHub secrets for this repository’s Actions – as with the AWS credentials – and set as environment variables to be accessed by the workflow. Once they are made accessible, these settings are passed to the application by substituting through the environment variables:
- name: Run tests
      id: avh
      run: |
        avhclient -b aws execute --specfile avh.yml
Next, we run the AVH Client that we installed in the previous step. The AVH Client issues commands that get executed on the AVH AMI and runs the application under test. These commands are defined in the avh.yml file. Let’s inspect this file at https://github.com/ARM-software/AVH-AWS_MQTT_Demo/blob/main/avh.yml and dive into what is being executed with the AWS backend on the AVH AMI.
A deeper inspection of AVH.yml
First, the AVH.yml file issues the commands to set up the workspace on the EC2 instance with all the required application files from this repository. Next, Python is installed on this instance and build.py is executed to build and run the application on the Cortex-M7 FVP system. build.py issues the following command to build the AWS MQTT AVH application executable first:
/usr/bin/bash -c cbuild.sh --quiet AWS_MQTT_MutualAuth.VHT_MPS2_Cortex-M7.cprj
If the build step is successful, the image.axf application executable is created. Next, this image is run on the Cortex-M7 FVP simulation target shown by the following command:
/opt/VHT/VHT_MPS2_Cortex-M7 --stat --simlimit 850 -f vht_config.txt Objects/image.axf
The running AWS MQTT AVH application establishes an authenticated connection to the AWS MQTT broker. The application subscribes to MQTT topics and publishes messages that can be viewed on the AWS IoT MQTT client.
Finally, in the last step of the workflow, the build and simulation console output results of running this application are archived and uploaded as artifacts to the repository’s Action. The output is generated by the following commands:
- name: Archive results
      uses: actions/upload-artifact@v2
      with:
        name: results
        path: |
          aws_mqtt-cm7-*.zip
          console-out-*.log
        retention-days: 1
        if-no-files-found: error
      if: always()
The test results can optionally be published, as well as using another action to make the test results easier to view and debug failures. The artifacts can be inspected to debug any test result failures. The default behavior specifies that artifacts are saved for 90 days after a run but in our example, we store the artifacts for only a day to minimize storage space usage, as shown by retention-days: 1.
We went through a suite of steps as part of this CI pipeline to build, run, and upload test results from the AWS MQTT application example running on the M7-FVP in the AVH AMI. The following is a snapshot from the Actions tab of our GitHub repository, listing all of the steps in a job that were automatically taken as part of this workflow:
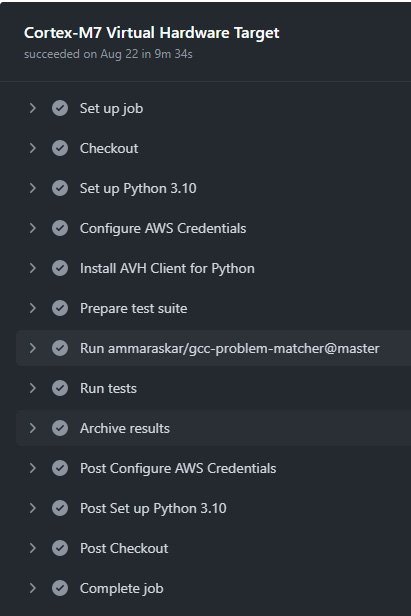
Figure 9.8 – The Actions tab of a successful GitHub Actions CI pipeline job
To summarize, by leveraging virtual hardware simulation models and applications running in the cloud and integrating them with robust CI pipelines, as in the one we outlined here, it has become much more feasible for software developers to easily test and validate their applications.
Summary
This chapter provided a broad set of resources for software developers looking to implement CI in Cortex-M-embedded projects. We discussed the values of utilizing automated testing first, noting how they outweigh the temporary drawbacks in terms of setup time. Then, we investigated how embedded developers, targeting custom hardware devices, have added constraints when setting up a CI pipeline in contrast with traditional website developers.
The last part of the chapter detailed three ways to implement automated testing with the identified constraints in mind. We started with a simple example suitable for individual and small projects: a straightforward script that automatically runs some builds and tests when executed. The second example represented the more traditional approach embedded software teams implement: large board farms connected to an on-prem server that runs a build and test suite on a code commit. The final example showcased the cutting-edge, scalable approach for effective embedded CI pipelines: large virtual farms for most tests with a small board garden for the few system-wide tests.
Make sure to select the level of CI complexity that makes sense for your code base and team size and you will avoid over-engineering or under-engineering a test flow. Whether you are on a small project personally creating your CI pipeline or a large team with a dedicated DevOps role, implementing a CI pipeline will increase your code quality and reduce development headaches.
There are many nuances in implementing your own CI pipeline, with plenty of opportunity for customization. The last chapter of this book will discuss the concept of code coverage, which adds significant visibility into code quality for all project stakeholders in real time.
The last chapter differs from the format of the other chapters in this book. It is split largely into two parts. It summarizes and adds assorted tips to the material presented thus far and then casts a view into the future to predict which embedded development skills will become more valuable in the years to come.
Further reading
- Integrating CI with Jenkins and Docker (note that the third part of the series does not exist and is effectively this book):
- https://community.arm.com/arm-community-blogs/b/tools-software-ides-blog/posts/implementing-embedded-continuous-integration-with-jenkins-and-docker-part-1
- https://community.arm.com/arm-community-blogs/b/tools-software-ides-blog/posts/implementing-embedded-continuous-integration-with-jenkins-and-docker-part-2
- The measurable value of using virtual farms over board farms: https://community.arm.com/arm-community-blogs/b/tools-software-ides-blog/posts/slash-unit-testing-time-in-embedded-software-regression-testing
- A comparison of unit, integration, and system tests: https://u-tor.com/topic/system-vs-integration
- An overview of AVH: https://www.arm.com/products/development-tools/simulation/virtual-hardware
- An overview of CD for embedded programmers (an old blog but a helpful introduction): https://www.cloudbees.com/blog/5-aspects-makes-continuous-delivery-embedded-different
- A detailed look at CD for ML models, known as MLOps: https://cloud.google.com/architecture/mlops-continuous-delivery-and-automation-pipelines-in-machine-learning