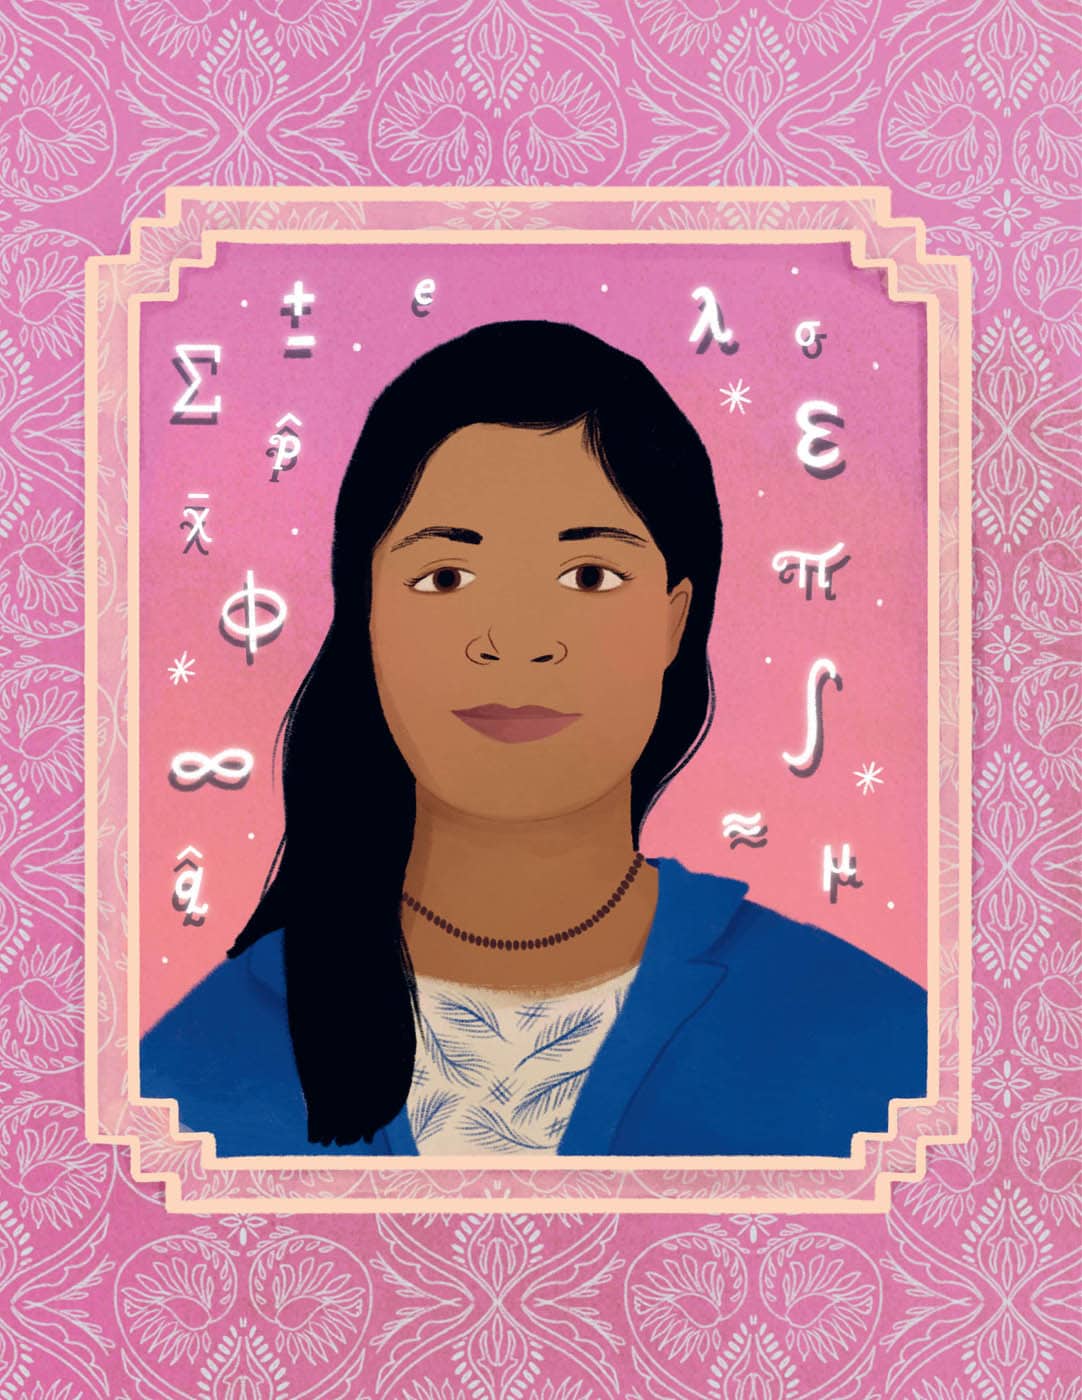
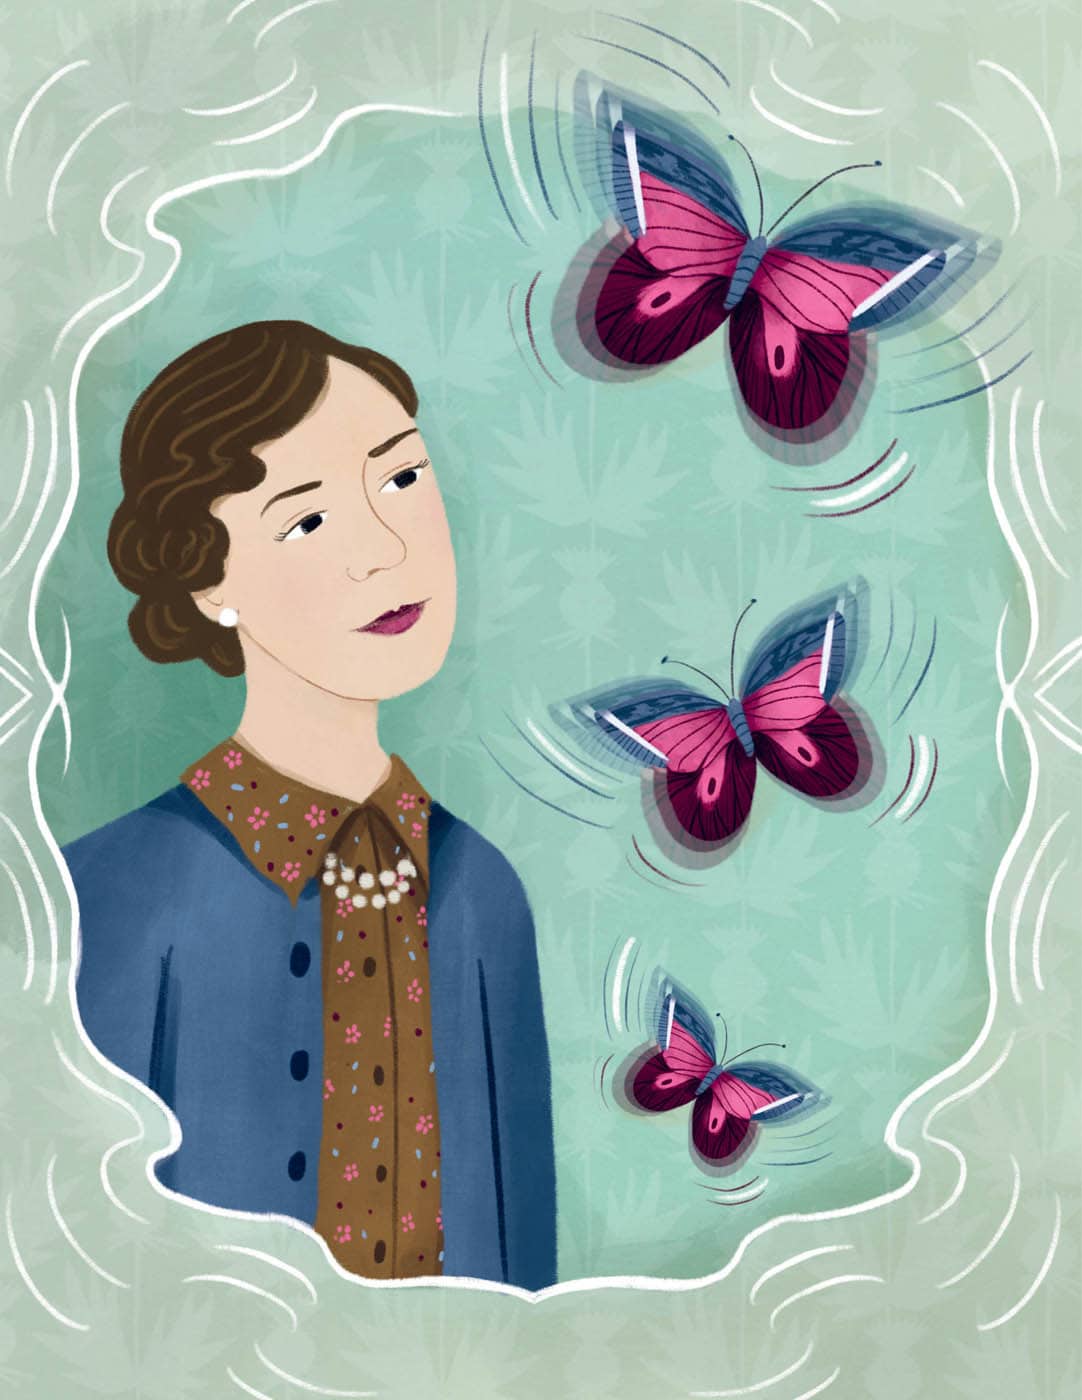
Gertrude Mary Cox
January 13, 1900 – October 17, 1978
FARM LIFE
Gertrude Mary Cox grew up on a farm in a small town in Iowa. During her childhood, she and her three siblings did many farm chores. Gertrude loved to make bread. She admired her mother, who taught her the values of her church. This led Gertrude to dream of becoming a deaconess—a church official—as an adult.
RELIGION TO STATISTICS
After high school, Gertrude studied to become a deaconess, but after a few years, she realized she wanted to go to college to study mathematics. At Iowa State College in Ames, Gertrude was interested in more than just math, and she took classes in several other areas, including psychology. To make money, she worked in the computing laboratory, doing statistics calculations by hand, and fell in love with statistics. Gertrude worked hard to get a master’s degree—her thesis was called A Statistical Investigation of a Teacher’s Ability as Indicated by the Success of His Students in Subsequent Courses.
GRADUATE SCHOOL
After earning her master’s degree, Gertrude moved to the University of California at Berkeley to get her PhD. While she was still studying for her PhD, George Snedecor offered her a job running the new Statistical Laboratory at Iowa State College. She decided to take the job instead of finishing her degree.
CONSIDER A WOMAN
Seven years later, in 1940, Frank Porter Graham, the president of North Carolina State College, was looking to create a department of experiment statistics. He asked Gertrude’s boss, George, for a list of people he thought would be good professors in the new department. When George created a list of five men, Gertrude asked why her name hadn’t been included. Although her question didn’t cause George to add her to his list, he made a point of telling Frank, “If you would consider a woman, I know of no one better qualified than Gertrude M. Cox.” This was how Gertrude got the job as head of the department. Her story is a good example of how asking for what you want might help you get it! In 1950, she wrote a book called Experiment Designs, which became the most referenced book in the field of statistics for many years.
BEING FIRST
Gertrude’s work as a celebrated mathematician helped break down many gender barriers. She was the first female professor at North Carolina State College and later became an editor of the journal Biometrics. Gertrude was a founding member and later the president of the Biometrics Society. She was also a fellow and president of the American Statistical Association and the first female member of the Institute of Mathematical Statistics. She even had the honor of being elected to the National Academy of Sciences!
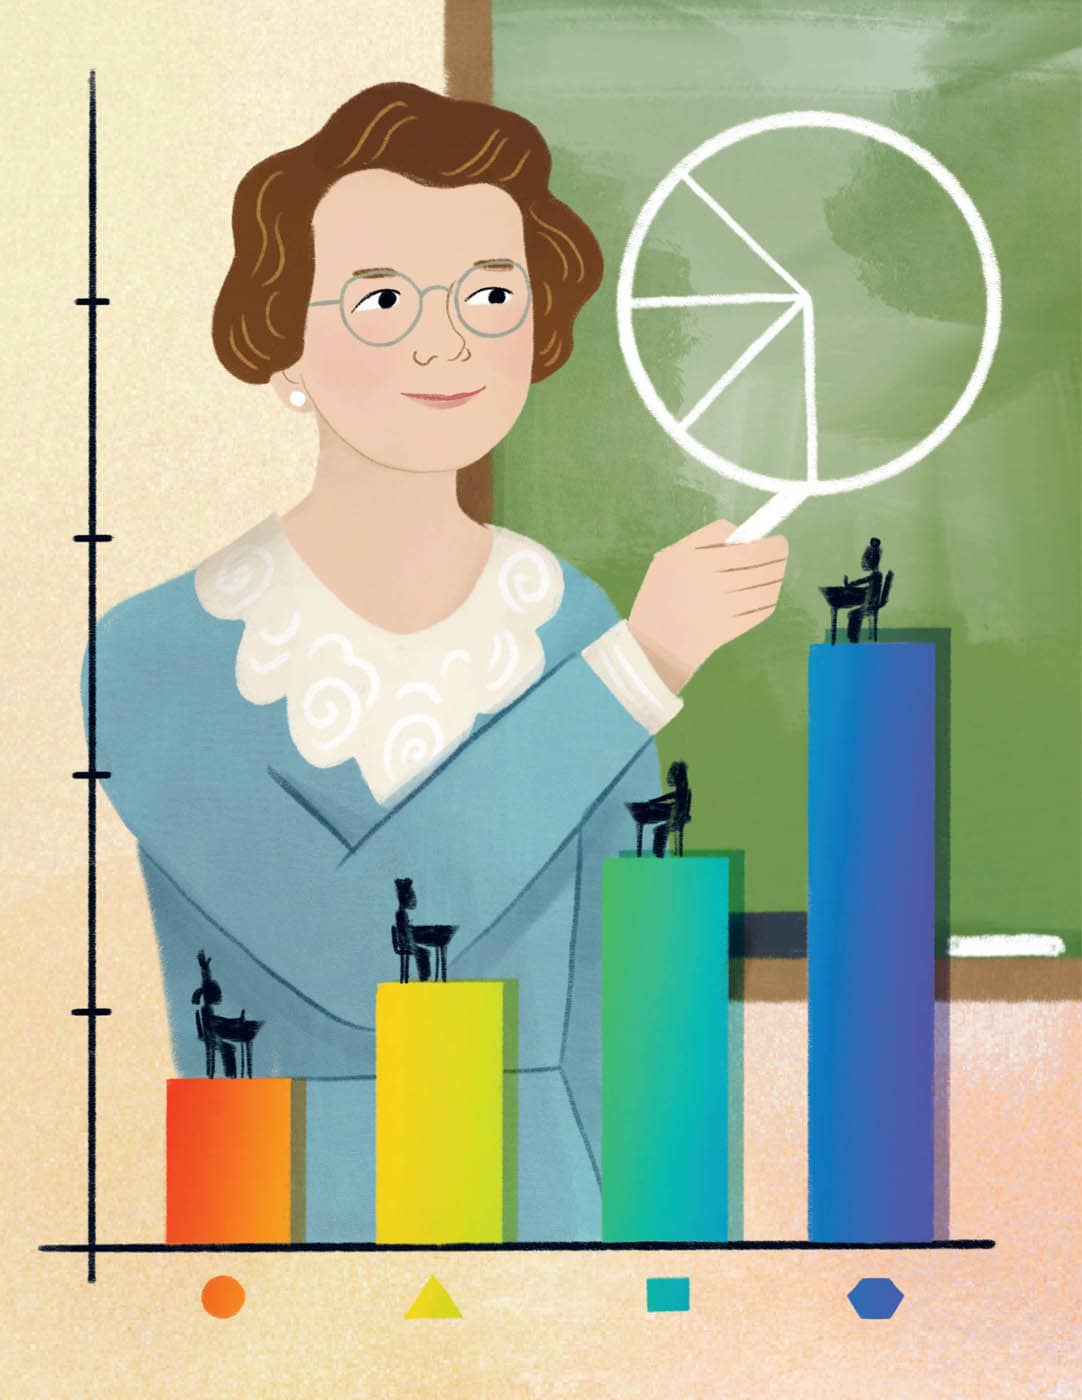
BARS, SHORT AND TALL
Gertrude Mary Cox was a great teacher who made it easy to understand statistics. In this activity, we’ll learn how to easily present statistics using a bar graph.
MATERIALS
- At least 25 square LEGO bricks or other modular building blocks in at least six different colors
- Paper
- Pencil
- Ruler or straightedge
- A six-sided die
NOTE: LEGO®, the LEGO logo, and the Brick and Knob configurations are trademarks of the LEGO Group, which does not sponsor, authorize, or endorse this book.
DIRECTIONS
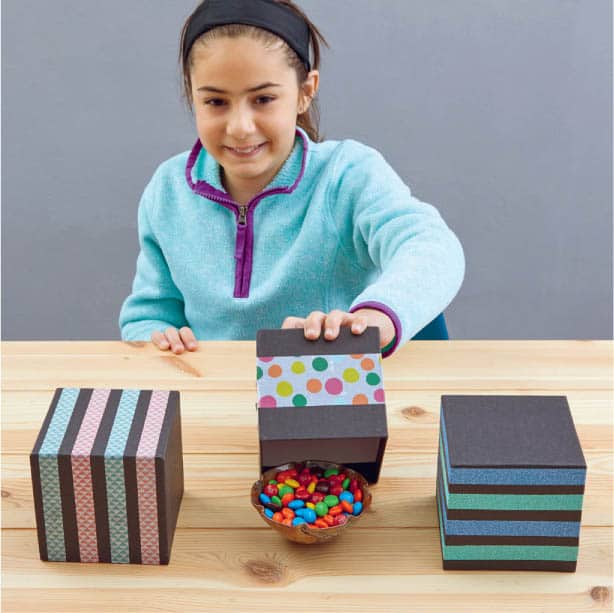
EXPERIMENT 1, COUNTING COLORS
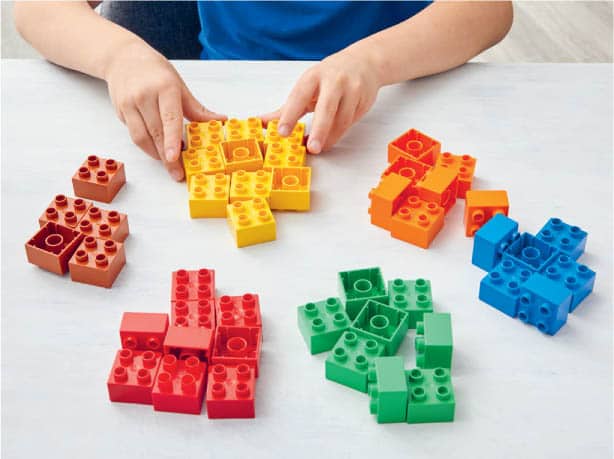
1 Find at least twenty-five square LEGO bricks or other modular building blocks. Make sure you have at least six different colors. Fig. 1.
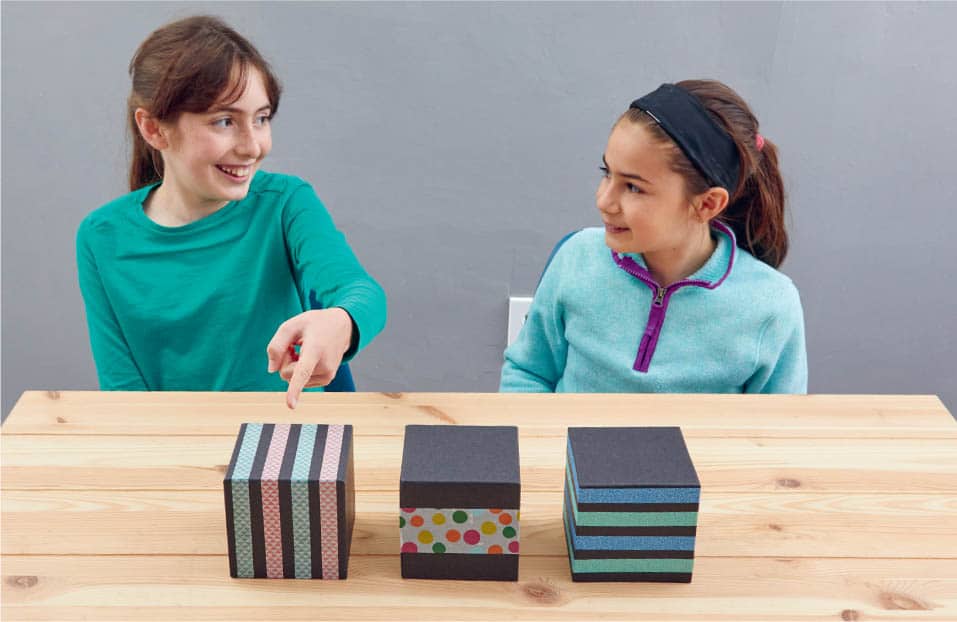
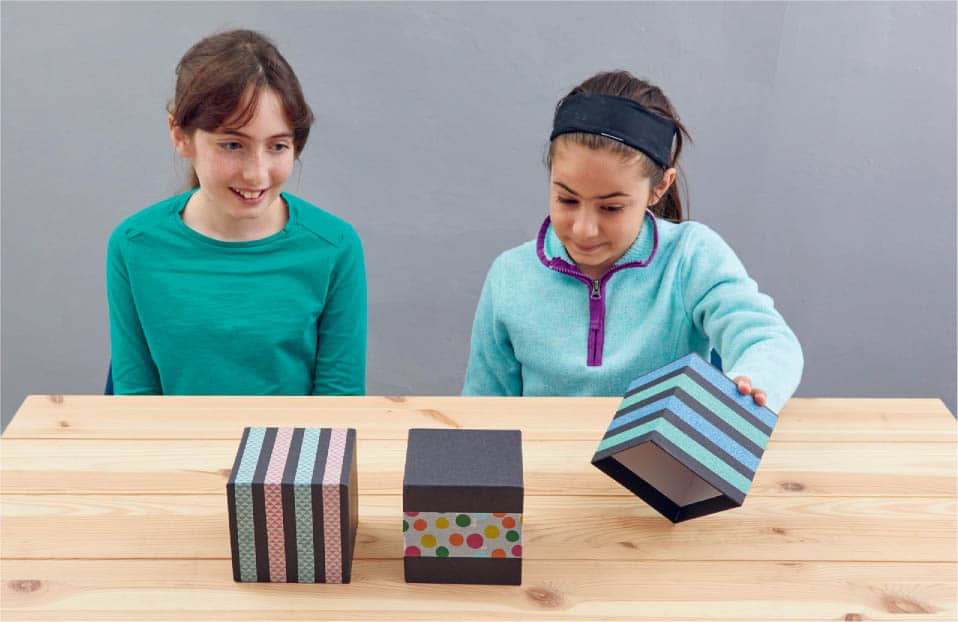
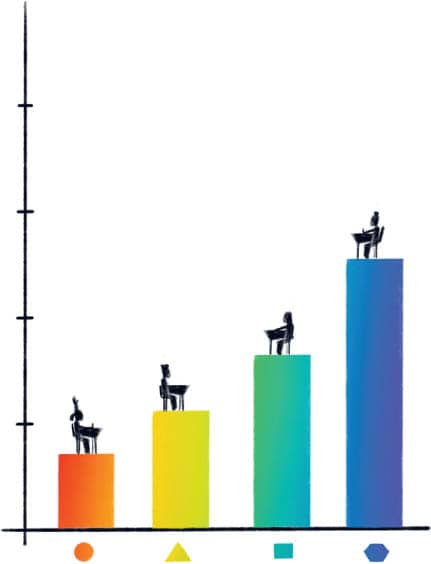
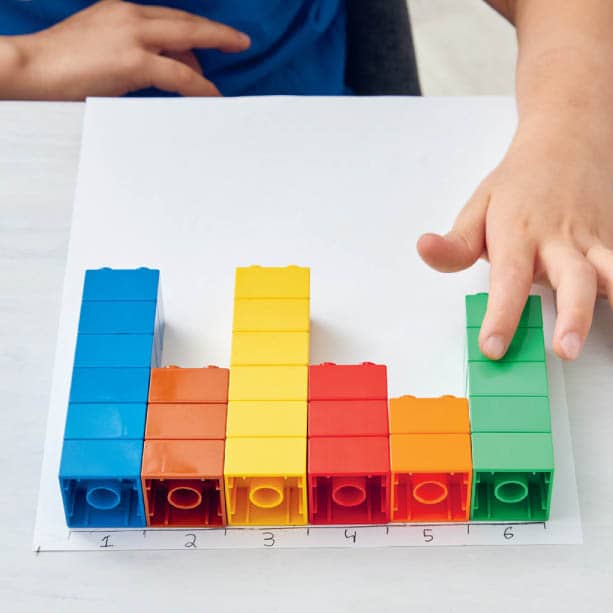
2 Stack all of the blocks of the same color into tall towers, like the bars in the graph of favorite colors from Ms. Coriander’s class.
3 Stand the towers up next to each other on a flat surface. Fig. 2.
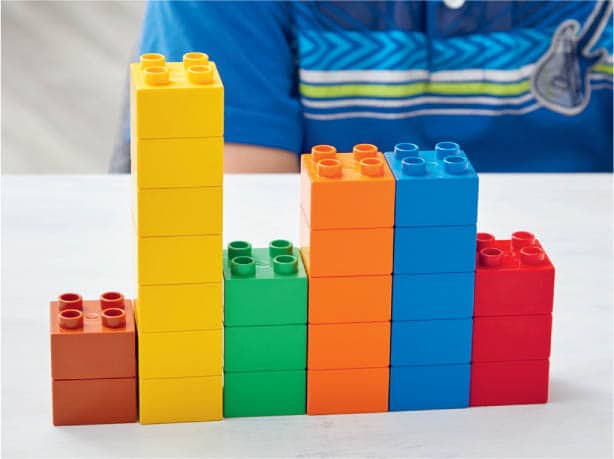
4 Your towers made a bar graph! Well done!
EXPERIMENT 2, COLLECTING DATA
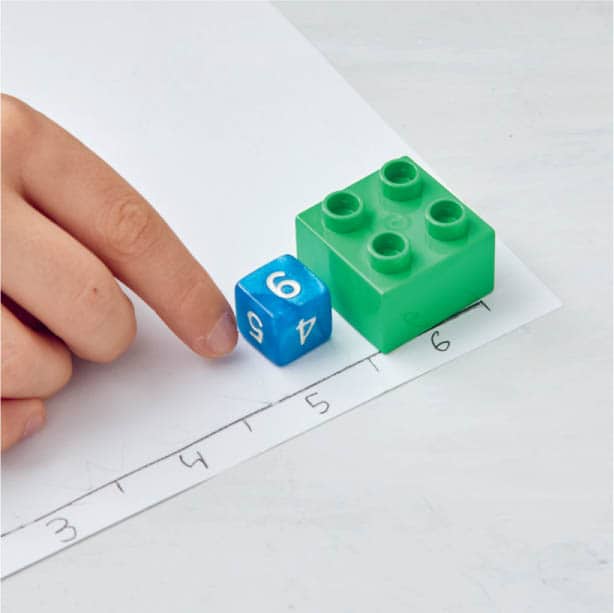
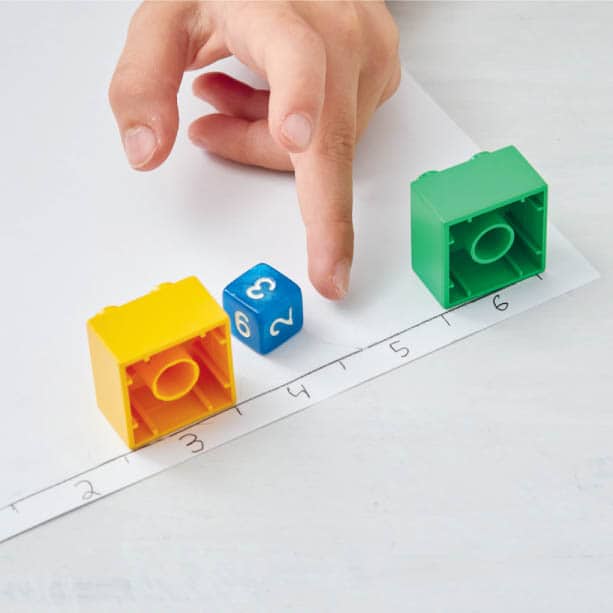
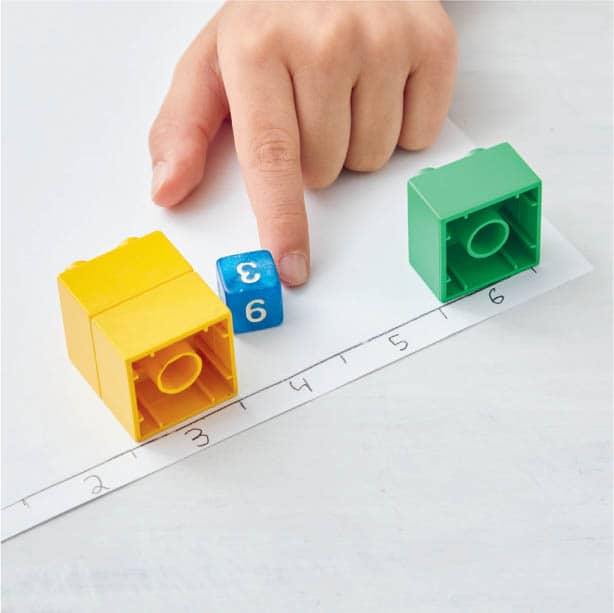
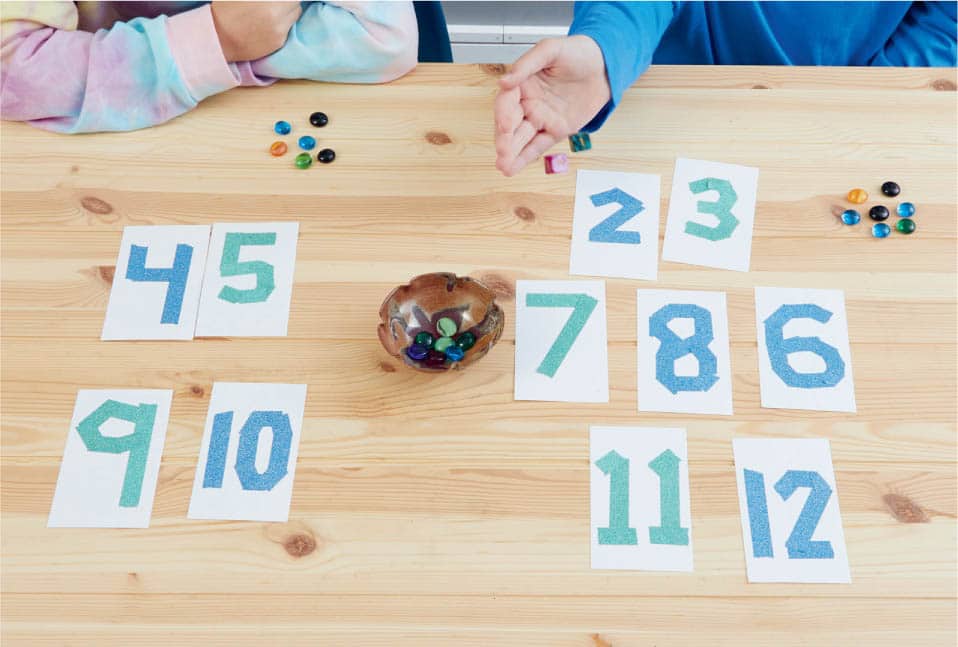
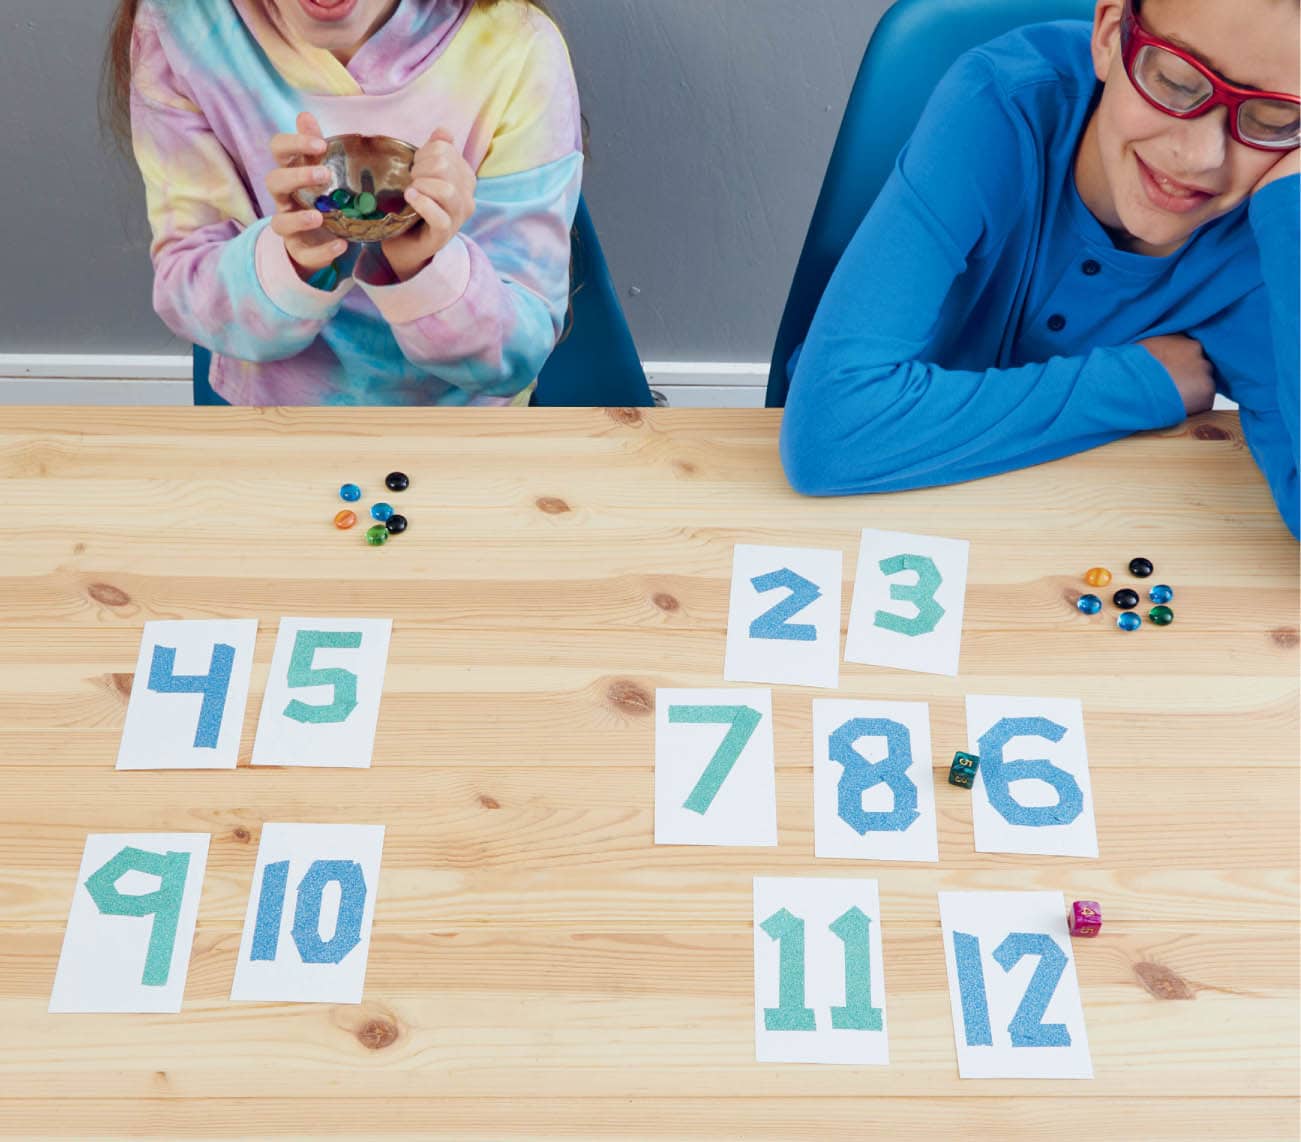
1 On a piece of paper, using a pencil and ruler, draw a straight line at the bottom with the numbers 1 to 6. It should look like this. Make sure there is enough space between the numbers for your blocks. Fig. 3.

2 Roll a die. When you roll a number, place a block on that number. If you roll a number more than once, put the new block on top of the stack already at that number to make one tall bar. Fig. 4 and Fig. 5 and Fig. 6 and Fig. 7.
- Try to keep all the blocks in each stack the same color.
- Try not to have two bars of the same color next to each other.
December 17, 1900 – April 3, 1998 As a young child, Mary Cartwright had a passion for history. However, during her final year before college, she discovered she was equally interested in studying math. Mary found she could do just as well in math as she had in history without having to spend time memorizing dates and events. So when she was accepted to Oxford University in England, she chose to study math. Mary worked extremely hard in college but didn’t do as well as she had hoped. Feeling discouraged, she almost gave up on math in favor of returning to history. In the end, she decided she was still having fun studying math and continued with it. Following graduation, she taught at a couple of girls’ schools before returning to Oxford to study for her doctorate. After earning her PhD in 1930, Mary received a fellowship to continue her research at Girton College, which is part of Cambridge University in England. While there, she attended lectures of J. E. Littlewood, who had been one of the examiners for her PhD defense. She solved an open problem he mentioned in a lecture with what is now known as Cartwright’s theorem. Later, she was asked to become a lecturer at Cambridge. She was promoted to director of Studies in Mathematics at Girton in 1936. In 1938, the Radio Research Board of the British Department of Scientific and Industrial Research published a set of questions that came out of their radio and radar work. Mary was interested but unfamiliar with the topic, so she approached Littlewood to collaborate on the new project. Together, they laid the foundations for a new branch of math called chaos theory and discovered what would later be called the “butterfly effect.” The butterfly effect is the idea that very small changes can have giant effects. It was given that name because of Ray Bradbury’s short story, A Sound of Thunder, in which a time traveler interacts with a butterfly in the past and changes the entire history of the world. Dr. Mary Cartwright was a huge inspiration to female scholars. When she was accepted into Oxford, she was one of only five women studying math there. Mary later became the first woman to serve on the Council of the Royal Society, the first woman to receive the Sylvester Medal, and the first female president of the London Mathematical Society. She was honored by the queen and named Dame Mary Cartwright, Dame Commander of the Order of the British Empire. She was also the first woman to receive the De Morgan Medal, the London Mathematical Society’s highest honor.
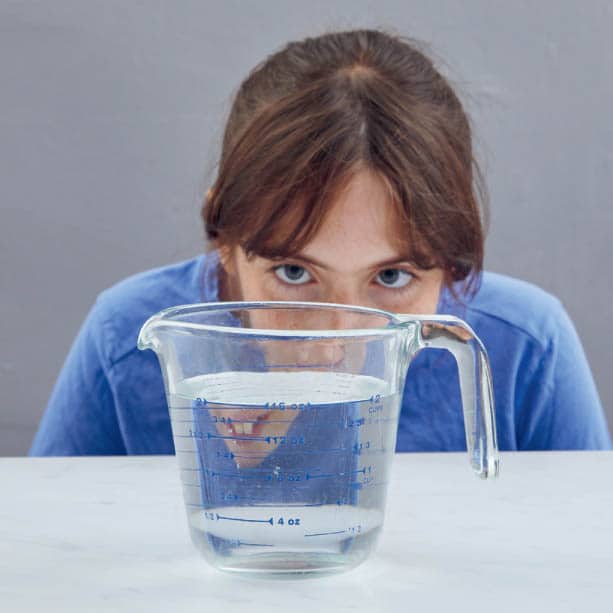
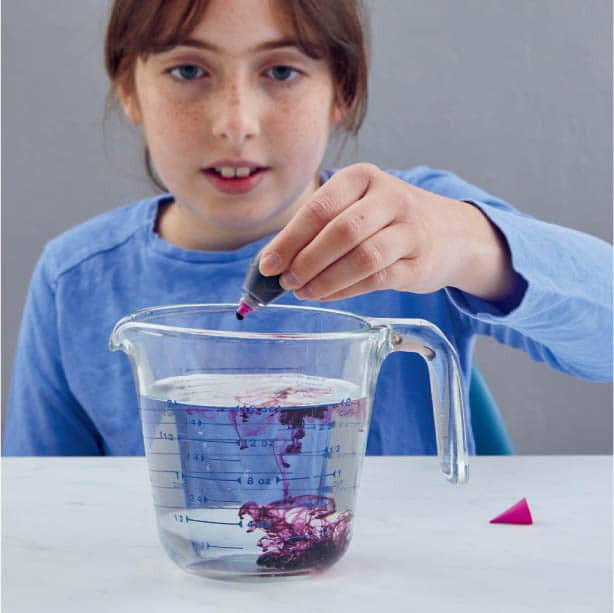
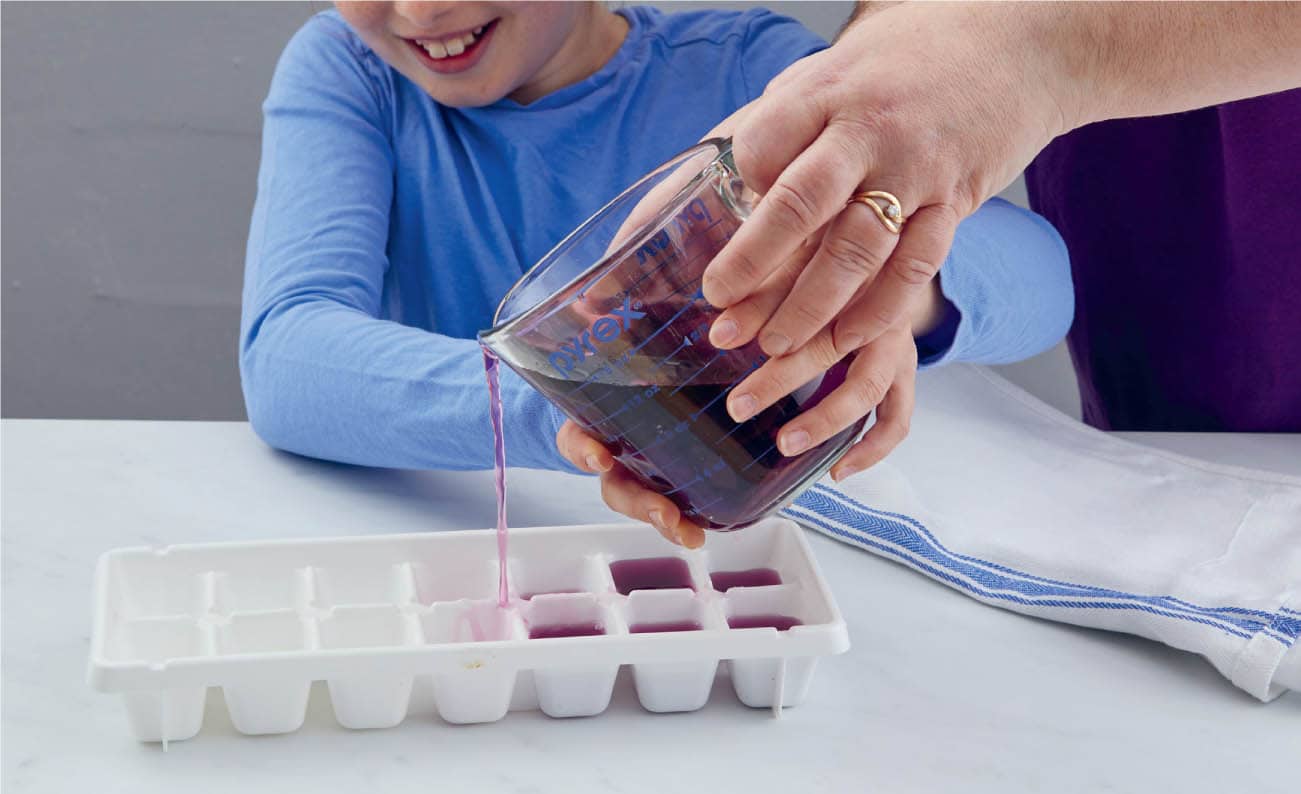
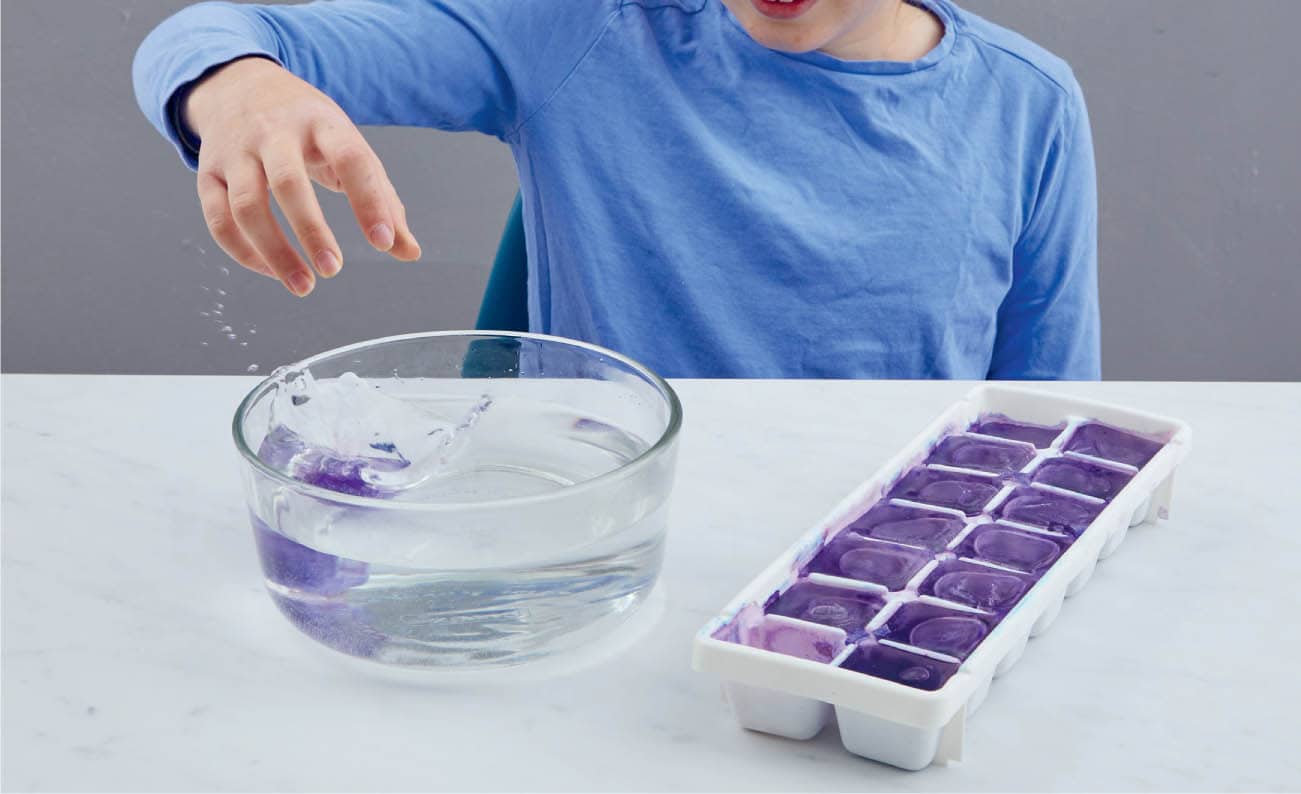
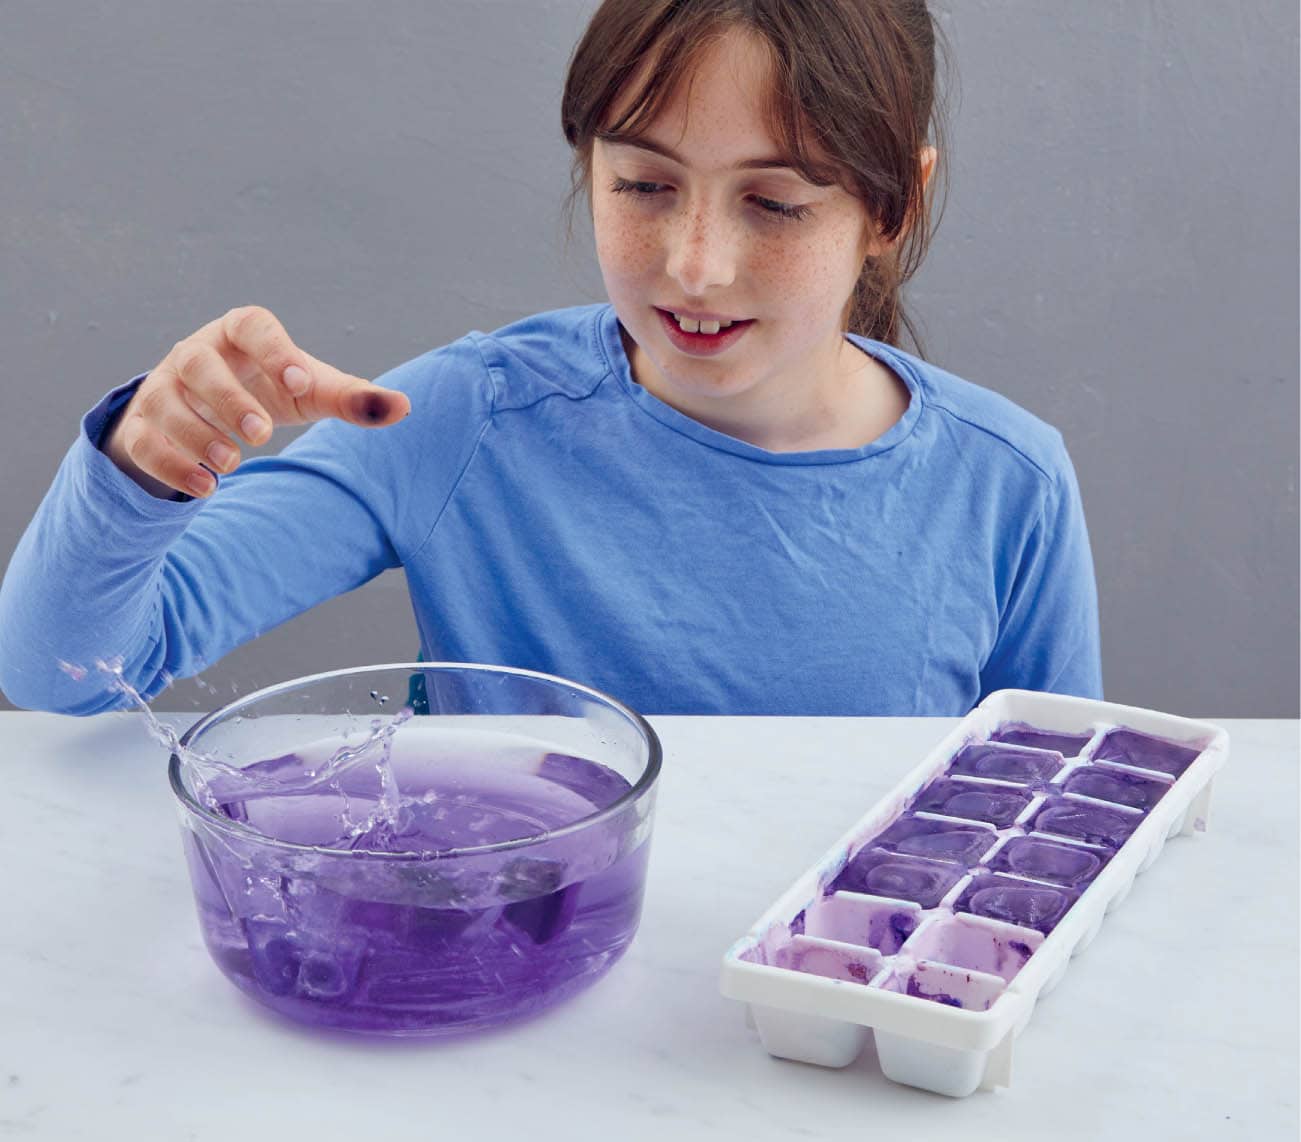
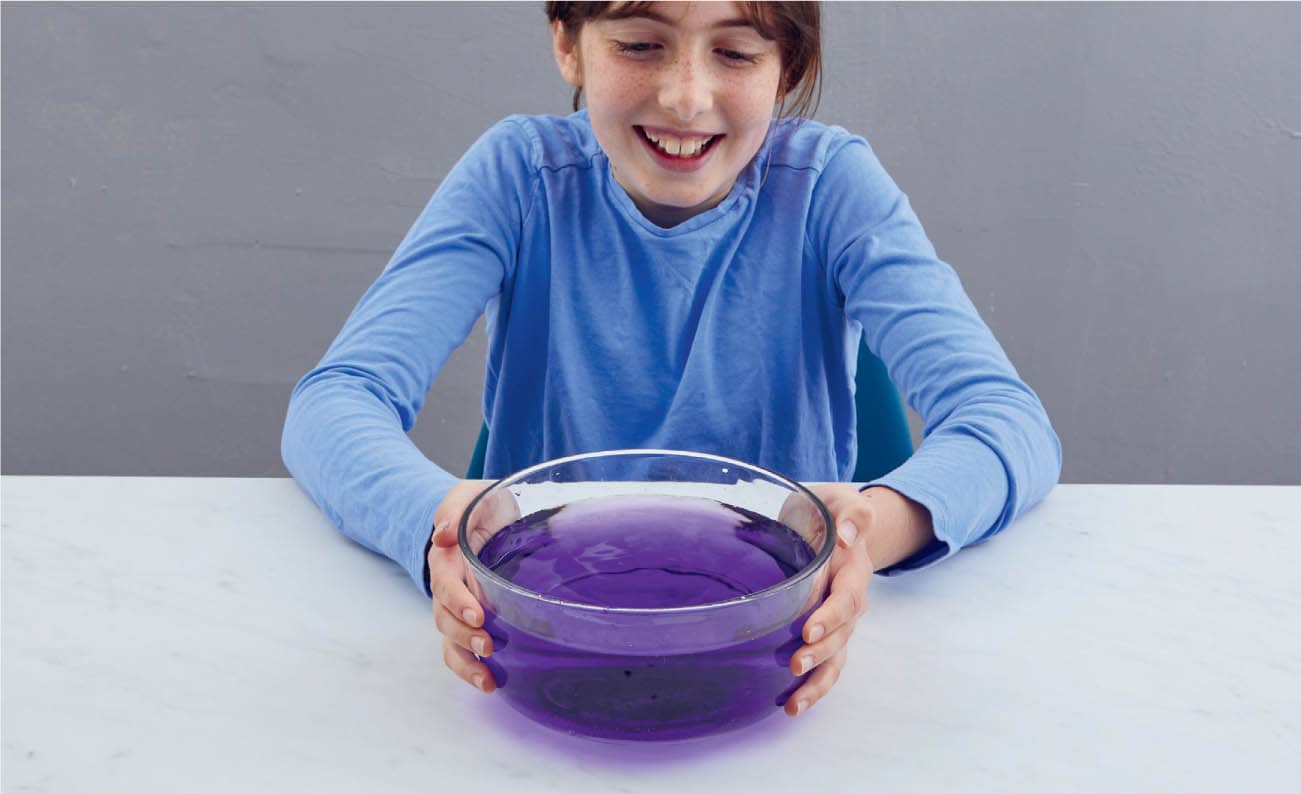
Mary Cartwright studied chaos theory and here we’ll do the same. In this activity, we will use water and food coloring to see what chaos theory looks like in action! 1 Measure out 2 cups (480 ml) of water into a container. Then add 3 to 6 drops of food coloring and mix it until the water is nice and dark. Fig. 1 and Fig. 2. 2 Carefully pour the colored water into the ice cube tray. Then put the tray in the freezer overnight. Fig. 3. 3 Once the water has completely frozen into ice, fill the large container with hot water. The water should not be hot enough to burn you. 4 Take three ice cubes and drop them into the water in one corner of the container. They should all be in the same spot and hugging the corner as closely as possible. Fig. 4. 5 Slowly, you should see the food coloring leave the ice and disperse throughout the water. After a few hours, the entire container should be the exact same color throughout. Fig. 5 and Fig. 6.Mary Cartwright
HISTORY OR MATH?
TO UNIVERSITY AND BACK AGAIN
THE “BUTTERFLY EFFECT”
BREAKING GENDER BARRIERS
ORGANIZED CHAOS
MATERIALS
DIRECTIONS

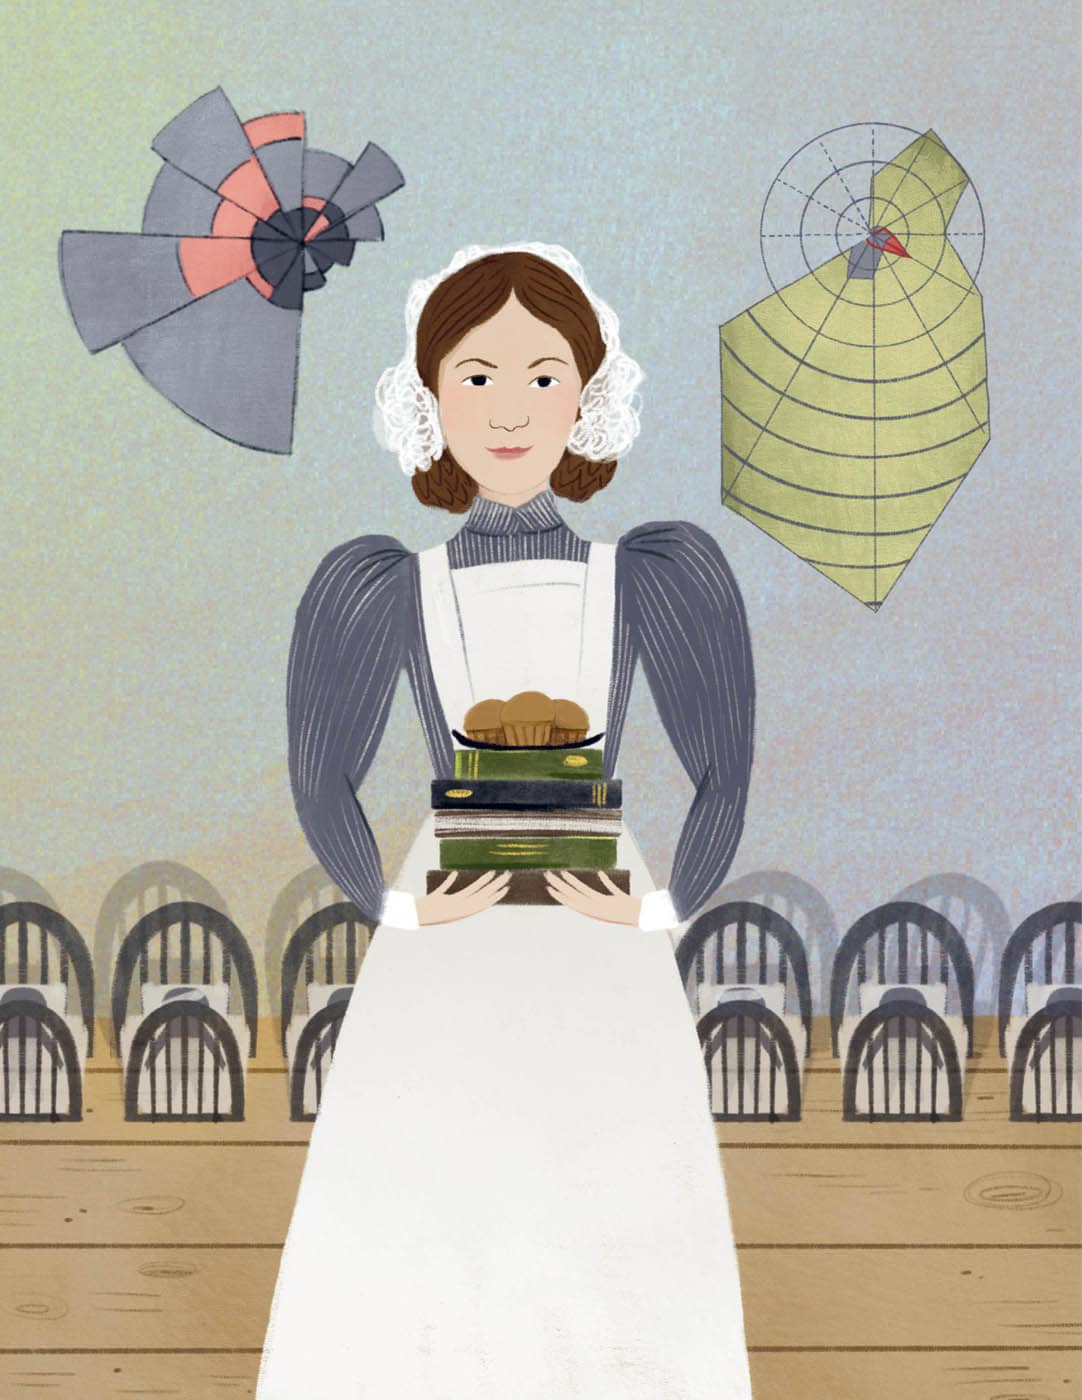
May 12, 1820 – August 13, 1910 Florence Nightingale was born to wealthy parents who were part of England’s elite social circles. However, Florence was not interested in climbing the social ladder. She wanted to help other people. By the time she was sixteen, Florence knew she wanted to be a nurse, but her parents were not supportive. Nursing was seen as a lower-class profession and Florence was expected to marry someone who would increase her family’s social standing. However, she knew that if she married, she would have to focus on family instead of nursing, so when a man she liked proposed, she turned him down to follow her dreams. After finishing nursing school, Florence went to work at Harley Street Nursing Home in London. She did so well that she was offered a job as superintendent at the Institute for the Care of Sick Gentlewomen in London. When Florence noticed how cholera spread easily due to unsanitary conditions, she changed the institute’s sanitation practices. It was hard work, but she succeeded, and far fewer people died as she fine-tuned her techniques. A year after the Crimean War started, England was failing to treat thousands of hurt and dying soldiers. Florence assembled a group of the first thirty-four female nurses to help the soldiers in Crimea. She greatly reduced the number of deaths in the hospital by implementing sanitary practices and by taking care of the soldiers’ other needs, including providing delicious food, books, and other improvements. Women of the time were frequently ignored, but Florence got people’s attention by using statistics to back up her ideas. She even invented a new way of presenting data, called Nightingale rose diagrams, which made the data easy to understand! These circular graphs represented repeating sequences, such as the months in a year, with a continuous line to show how data changed as time went on. The data was shown by how far the line was from the center. If the line was further from the center, that meant the numbers were larger than if the line was closer to the center. She made another version of the diagram where the area of a wedge in the diagram represents change in data. These easy-to-understand representations of how sanitary improvements decreased death rates helped her convince others to adopt her practices. Because she showed the world how persuasive statistics could be, Florence became the first female member of the Royal Statistical Society in England and an honorary member of the American Statistical Association. Her impact was so profound that she is often referred to as the creator of modern nursing. Her book, Notes on Nursing: What It Is and What It Is Not, is used to train nurses to this day. However, without her statistical ideas, she might not have been able to make her mark. Florence’s story is a wonderful example of how math can make a monumental difference—in this case, by saving countless lives.
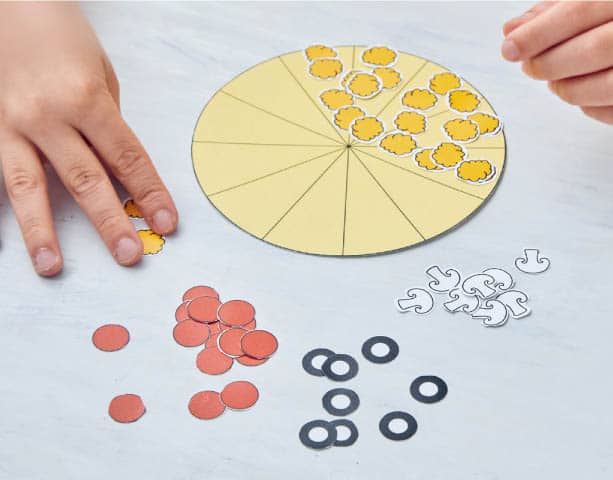
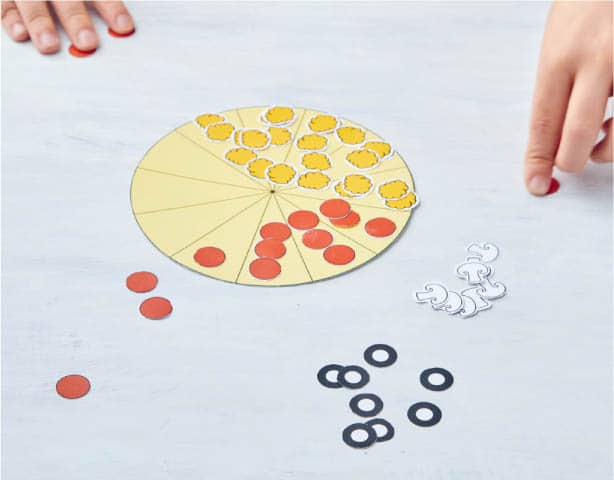
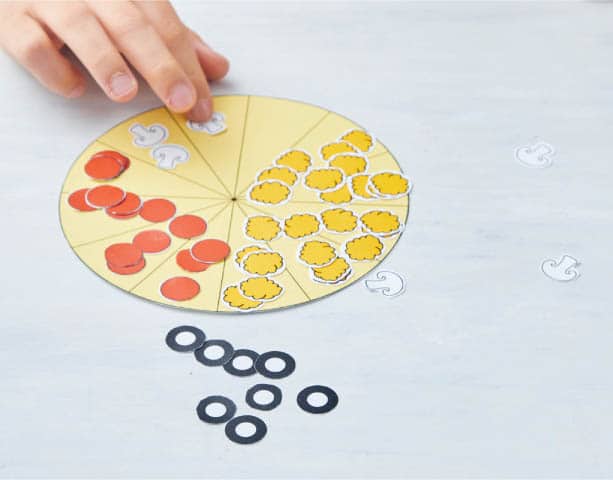
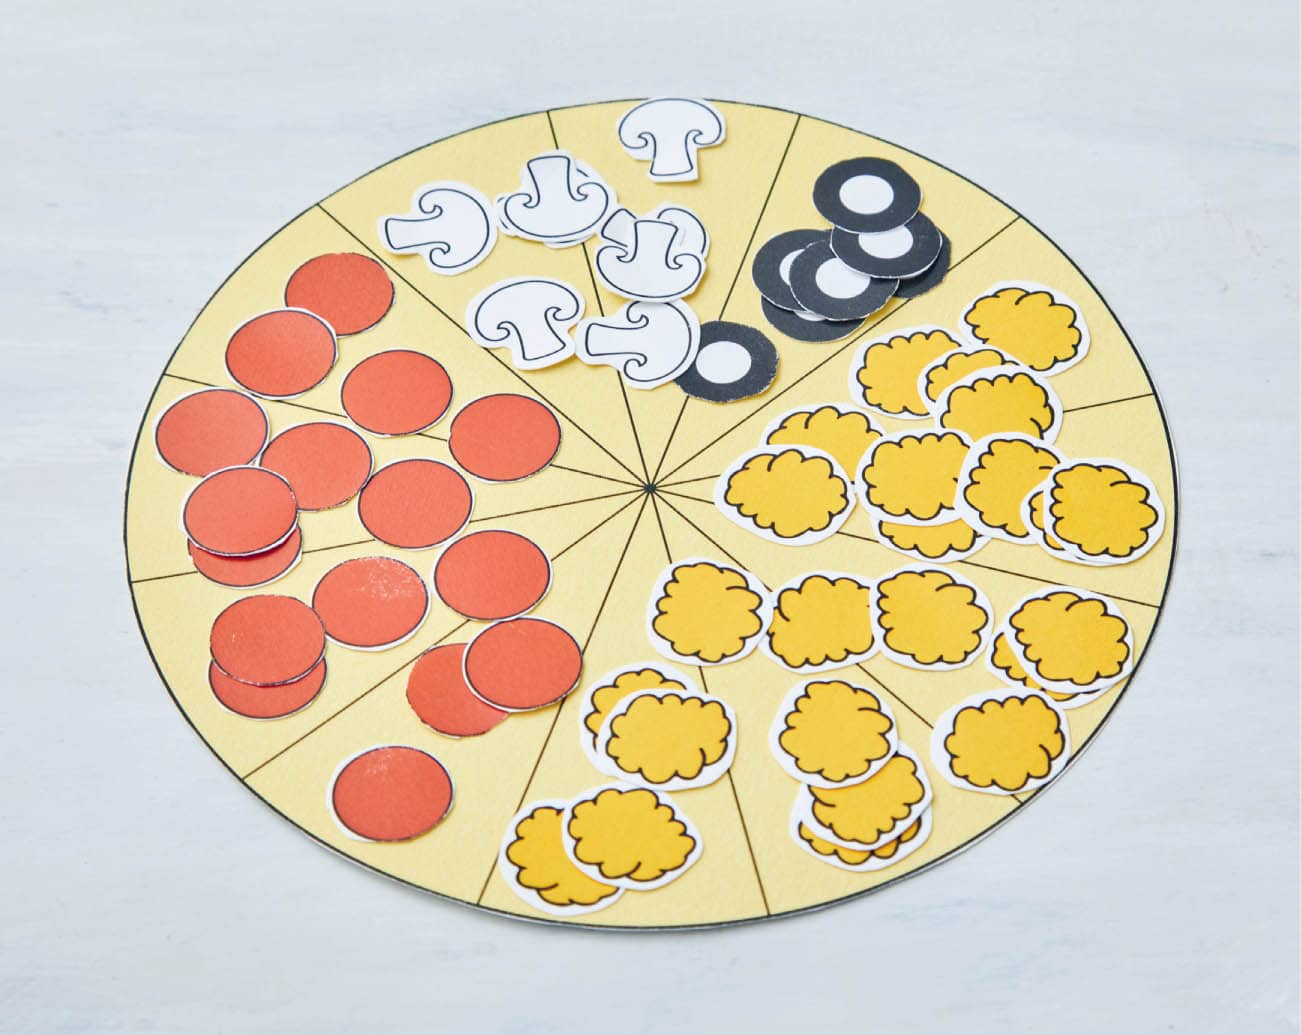
Florence Nightingale used diagrams on circles to present statistics in an easy-to-understand way. Here we will learn about another form of circular charts—pie charts! NOTE: We strongly recommend that you do the Bars, Short and Tall activity associated with the Gertrude Mary Cox biography before doing this project. We did a survey of twelve people and gathered the following data: 1 With scissors, cut out the pizza and toppings from the pullout in the back of the book. It can also be downloaded from www.mathlabforkids.com and https://quarto.com/files/MathForKids. 2 We will use our data to cover the pizza in toppings, representing the fraction of people who prefer each topping. Beginning with cheese, use the cheese clouds to cover 5/12 of the pizza. Five sections should be covered in cheese and the slices should be next to each other. Fig. 1. 3 Next, add pepperoni to the pizza. First, figure out how many twelfths you need to make one-third. Once you figure that out, cover that many slices in pepperoni. Fig. 2. 4 For mushrooms, calculate how many twelfths equal one-sixth. Then cover that many slices in mushrooms. Fig. 3. 5 Finally, for olives, cover one slice. Fig. 4. 6 Now your pizza should look like this. Fig. 5. 1 Take the toppings off your pizza pie chart so you can make another pie chart, but this time you collect the data! Ask your friends and family what their favorite pizza topping (out of cheese, pepperoni, mushrooms, and olives) is. Try to ask twelve people, but if you can’t, only ask six. 2 Write down how many people prefer each topping and place the toppings on the pizza for each person. If you only asked six people, cover two slices per person. NOTE: You may have zero people preferring one kind of topping. That is okay! Just don’t place that topping on the pizza.Florence Nightingale
HIGH-SOCIETY CHILDHOOD
FOLLOWING HER DREAMS
TREATING THE SICK
THE STATISTICS OF NURSING
LEGACY
PIZZA PIE CHARTS
MATERIALS
DIRECTIONS
EXPERIMENT 1
EXPERIMENT 2

April 24, 1919 – July 8, 2010 David Blackwell was brilliant, even as a child. He excelled so much in math that his teachers let him skip two grades in the subject, though it wasn’t until high school that his true love for math began. David was so good at school, in fact, that he started college when he was only sixteen and won a scholarship to attend the University of Illinois at Urbana-Champaign. He intended to become a teacher but kept taking math classes because he loved math so much. David ended up earning a master’s degree and a PhD by age twenty-two. Despite being a genius, his college experience was fairly normal. He even joined a fraternity! David continued his impressive streak by earning a Rosenwald Fellowship, which would allow him to continue mathematical research after his PhD at the Institute for Advanced Study at Princeton University. However, because he was African American, David was prevented from doing research or attending classes at Princeton. This infuriated him, so he left the institute. He faced further discrimination when he was not hired at the University of California, Berkeley. Berkeley statistician Jerzy Neyman wanted to hire David, but he didn’t get the job because the wife of the head of the mathematics department refused to allow a Black person into her house. Hoping to become a professor but worried his race would prevent him from doing so, David focused his job applications on historically Black colleges and universities. He made a name for himself at Howard University, becoming head of the mathematics department after working there for only three years. While David was working at Howard University, he met Meyer A. Gershick. Meyer introduced him to the field of statistics and David’s interest grew deeper as the two became friends. They studied game theory as well, applying it to the military and battlefields for the RAND Corporation. Together, they wrote and published Theory of Games and Statistical Decisions. David continued studying statistics on his own, combining it with his love of teaching to write Basic Statistics, one of the first textbooks on Bayesian statistics. He didn’t limit his research to statistics. He also studied the field of probability. While probability and statistics are related, they are not the same. Probability tries to figure out how likely things are to happen, whereas statistics tries to determine relationships based on data. Despite originally being turned down for a job at Berkeley due to his race, in 1954 Dr. David Blackwell was offered an opportunity to work there as a visiting professor. A year later, he became a full professor in Berkeley’s new statistics department and was made department chair the following year. In addition to being the first tenured African American faculty member at Berkeley, David continued breaking down racial barriers as the first African American inducted into the National Academy of Sciences. Over his career, David won numerous honors and awards and was an inspiration to other mathematicians.
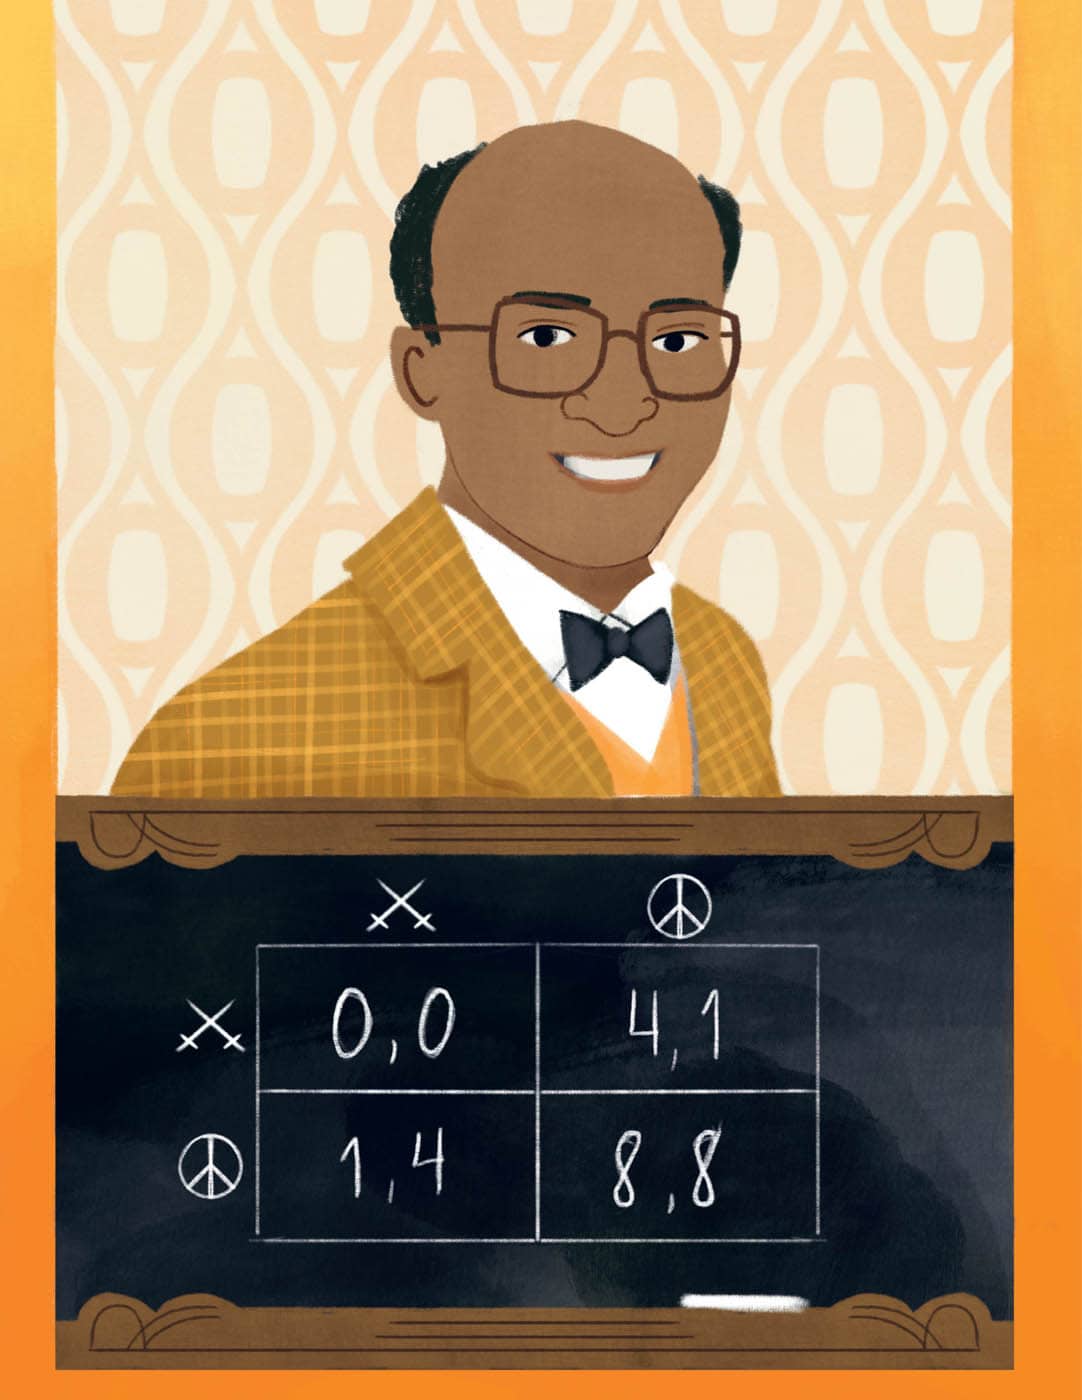
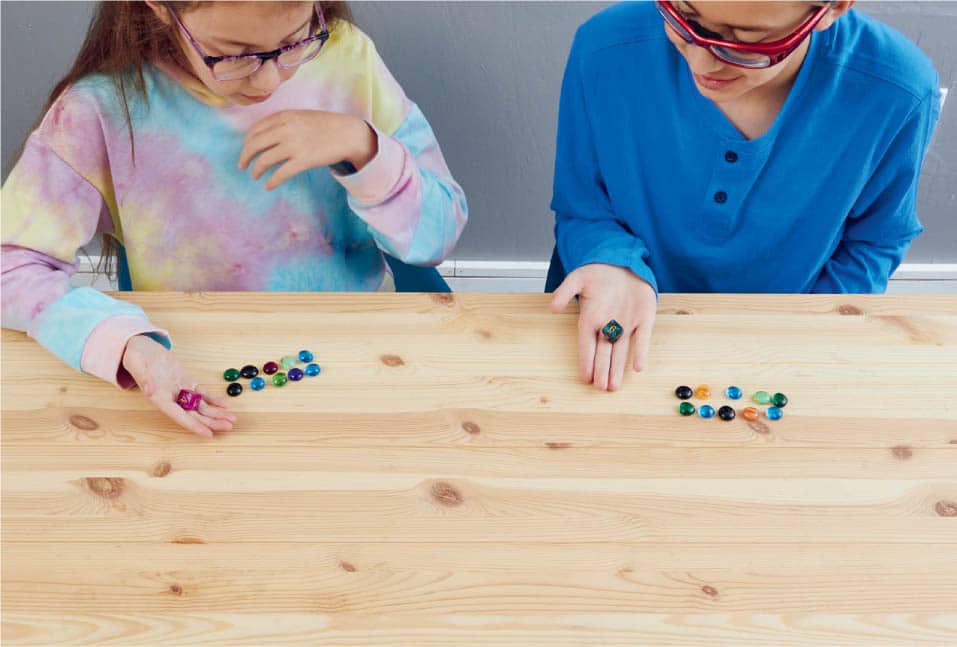
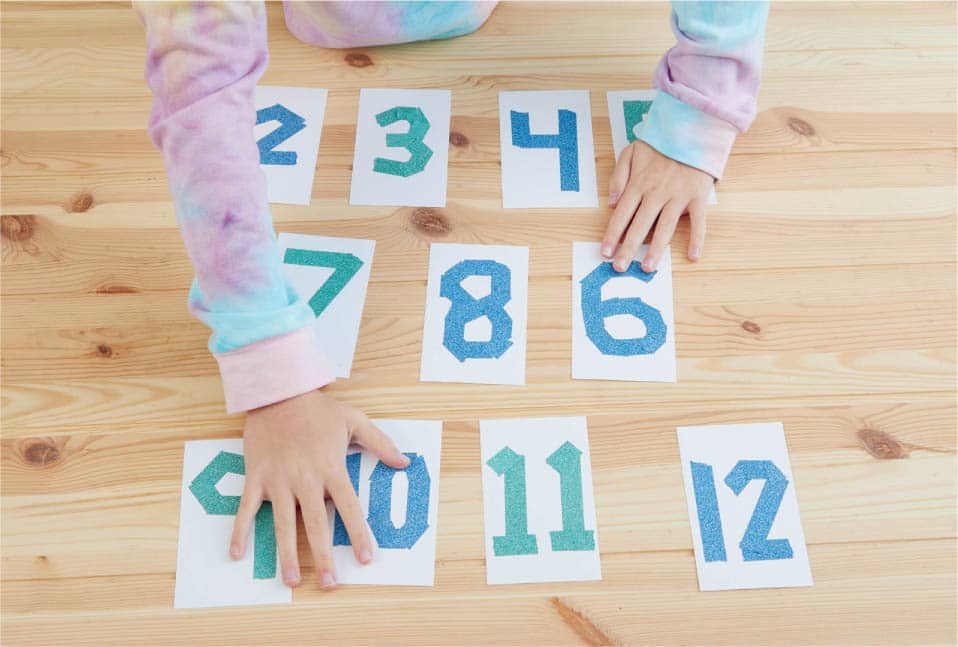
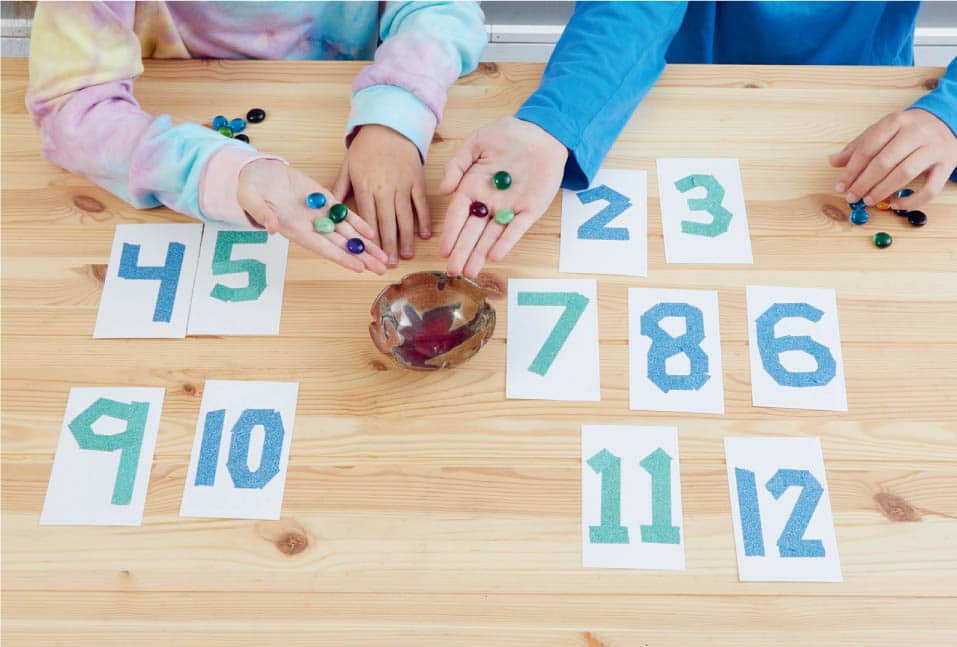
David Blackwell used probability and statistics to study games. We’re going to play a betting game and use probability to help us win as often as we can. 1 Players 1 and 2 both start with a die and an equal number of tokens, coins, or candies. (These are the “money” in the game.) Fig. 1. 2 Player 1 picks four numbers between 2 and 12. Fig. 2. 3 Players 1 and 2 make a bet on whether one of those numbers will turn up on the dice. Player 1 bets that one of their numbers will turn up, and Player 2 bets that they won’t. Each player places at least one of their tokens into the bowl. The bowl is called “the pot.” Fig. 3. 1 Players 1 and 2 roll their dice and find the sum of the face-up numbers. If the sum equals one of the numbers Player 1 chose, Player 1 takes the pot. If the sum is any of the other numbers, Player 2 gets the pot. Fig. 4 and Fig 5. 2 The players make new bets and continue to play until one person has all the money! Which player do you prefer to be, Player 1 or Player 2? Player 2 wins on a larger number of numbers, but if Player 1 picks their numbers in a smart way, could they have a better chance of winning. Once you think you have figured it out, move on to the Math in the Fun.David Blackwell
FAST EDUCATION
DISCRIMINATION SETBACKS
STATISTICAL STUDIES
BREAKING BARRIERS
ALWAYS BET ON MATH
MATERIALS
RULES OF THE GAME
DIRECTIONS
Born: 1958 Nalini Joshi was born in Myanmar (also known as Burma), where she lived while she was young. A decade after her father was forced to join the army, the family immigrated to Australia. Nalini recalls that they faced possible imprisonment if they ever returned to Myanmar. Even now, she has mixed feelings on visiting her old home. After moving to Australia, Nalini fell in love with books and science. Even before her career properly started, Nalini was so impressive that she earned the University Medal for her bachelor’s degree in applied mathematics from the University of Sydney in Australia. She then went to Princeton University in the United States for her PhD in applied and computational mathematics. Applied math uses mathematical ideas and approaches to solve problems in science, engineering, and other areas. It also creates and improves problem-solving methods in those areas. Nalini focuses on solving problems from the natural world using pure and applied math. Many of her papers have influenced physics and wireless communications. Nalini became the chair of applied mathematics at the University of Sydney in 2002, making her the first female math professor at the university. She has also been the director of the University of Sydney’s Centre for Mathematical Biology and head of their School of Mathematics and Statistics. Nalini has long been an advocate for gender equality. She cofounded and cochaired the Science in Australia Gender Equity (SAGE) program to improve gender equity in Australian higher education and research. She has given many talks discussing the lack of female representation in mathematics and STEM (science, technology, engineering, and math). Nalini says, “In addition to long-standing interests in mathematics research and education, I have a particular interest in increasing the participation of women and minority groups in science and mathematics.” Her efforts to further gender equality were celebrated when her portrait was hung alongside many other famous University of Sydney professors on International Women’s Day in 2017. Dr. Nalini Joshi ’s mathematical success and equity efforts have been honored in many ways. She was the first Australian to be elected vice president of the International Mathematical Union. She received the Eureka Prize for Outstanding Mentor of Young Researchers, was appointed an Officer of the Order of Australia, and has been president of the Australian Mathematical Society. Nalini also won the Australian Mathematical Society’s George Szekeres Medal for sustained outstanding contribution to the mathematical sciences. She used winning the Szekeres Medal as a teaching opportunity, noting, “When I went to check the list of past winners, I was surprised to see that I am the first person of color on the list.” Nalini firmly believes that math is not only beautiful, but also incredibly fun! She is quite active on Twitter, where she often posts about how beautiful math is. Once, she even tweeted, “Maths is in my heart.” She uses her media presence to further her fight for equality and promote a wider understanding of math for everyone.
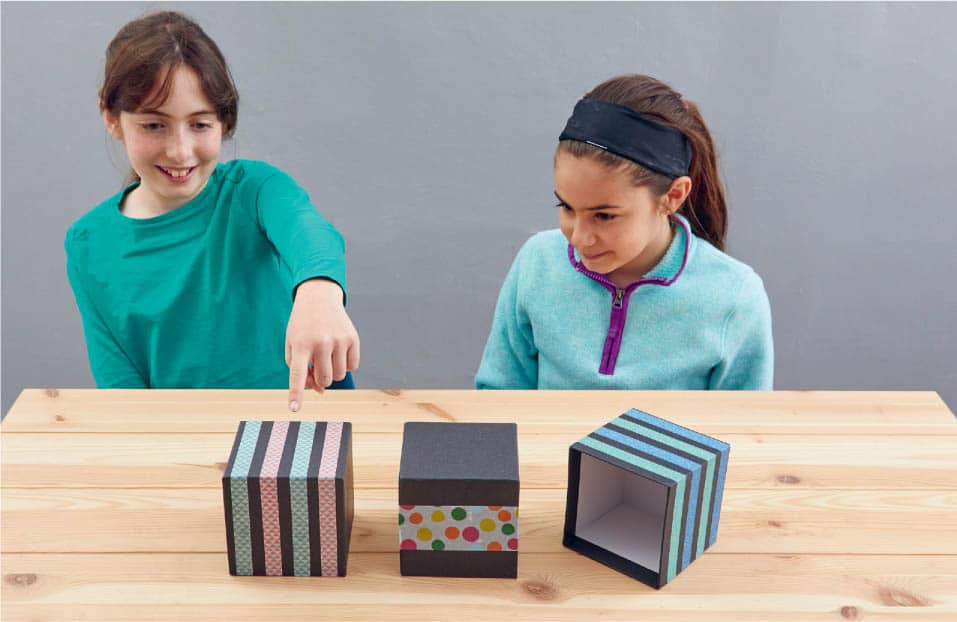
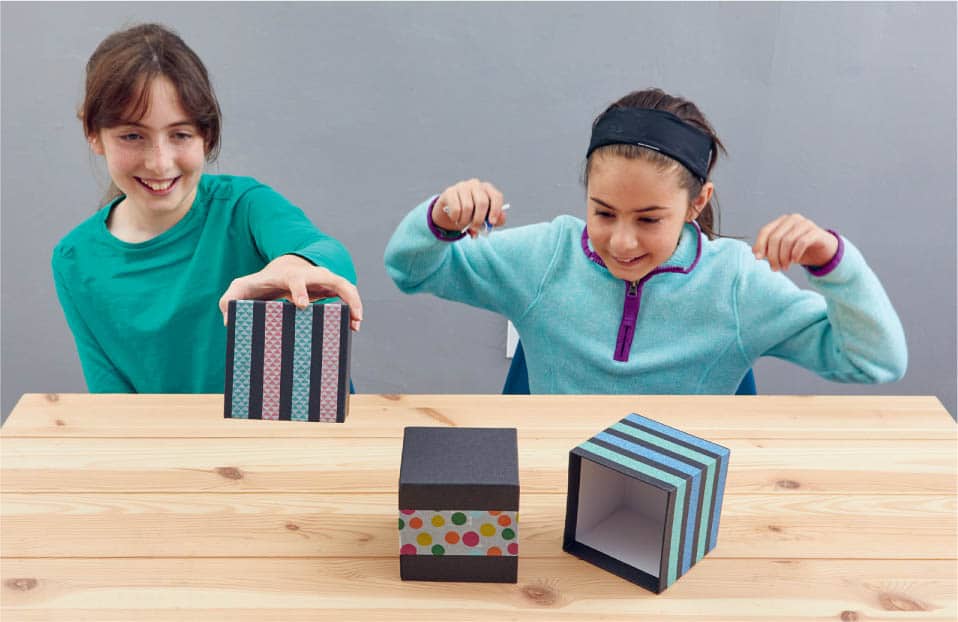
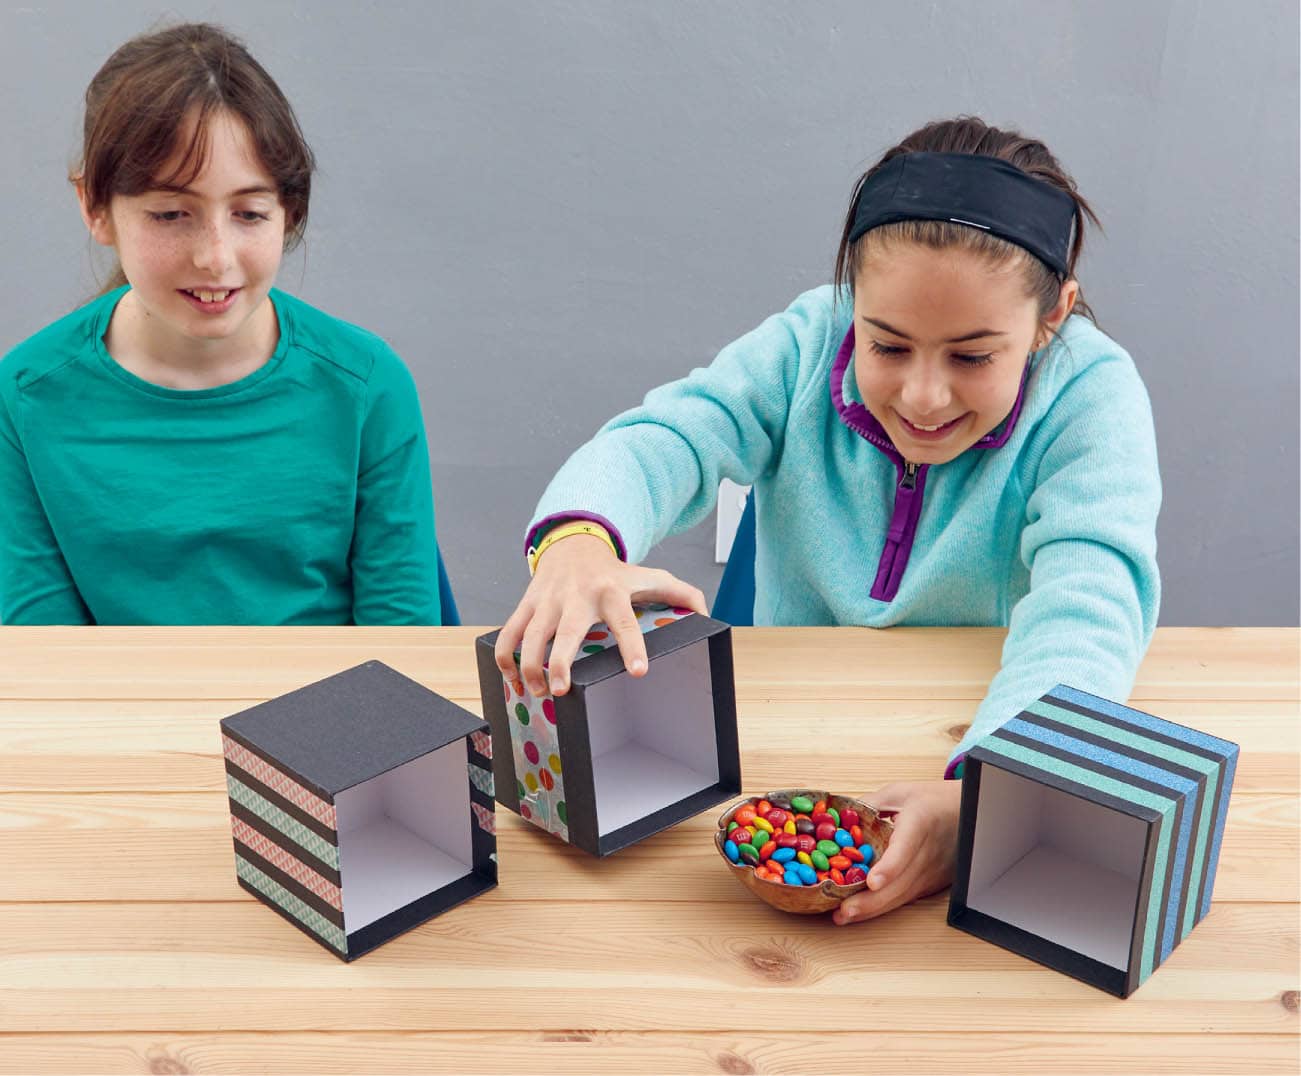
Nalini Joshi teaches applied mathematics. In this game, we’ll apply math, specifically probability and statistics, to give us the best chance of winning sweet treats! There are three boxes. Two of them are empty and one of them is filled with candy (or another prize). The problem is, you don’t know which box has the candy and which boxes are empty. Your friend tells you to pick one and you’ll get to keep whatever’s inside. You choose, but before you open the box, your friend opens one of the other boxes and it’s empty. Now your friend says you can change your mind and pick the other closed box if you want. Should you change boxes or stick with the one you originally chose? 1 Decide who is the host and who is the contestant. The contestant leaves the room. 2 While the contestant is in a different room, the host hides the prize completely inside one of the boxes and arranges them in a line. Fig. 1. 3 The host tells the contestant to come back into the room when they are done setting up the boxes. 4 The contestant picks a box that they think contains the prize. Fig. 2. 5 The host picks up a different box, one that does not have the prize under it, revealing that it is not the box with the prize. Fig. 3. 6 The contestant then decides whether they want to keep their choice of box or pick the box the host didn’t reveal. Fig. 4. 7 The contestant picks up the box they chose in the previous step. If they find the prize, they keep it! Fig. 5. 8 The winner gets the prize. Fig. 6.Nalini Joshi
GROWING UP IN MYANMAR
APPLIED MATH
SPEAKING UP FOR EQUALITY
RECOGNITION
LOVING MATH
THE THREE BOXES PROBLEM
MATERIALS
DIRECTIONS