
4 Customer Analysis
Many retailers no longer stock the same merchandise in all of their stores because they have realized that markets in different locations have different wants and needs. Macy’s department stores recently discovered that women in Phoenix and Salt Lake City did not care for off-the-shoulder dresses. It has been said that New York has a very strong preference for black iPod models while out west consumers prefer the silver models. If you send the same sales message to the president of a firm as you do with their line personnel, most likely one or the other will not be interested; presidents are looking for different features and benefits than other members of their company. If you are treating all segments of your markets the same, you may be making a mistake.
Different market segments usually have different profit potential. I am also a commercial real estate broker and I only seek listings for raw land exceeding 30–40 acres. I believe it doesn’t take any more effort or time to sell 40 acres as it does 1–5 and when I close on a sale, my income is in the high five figures.
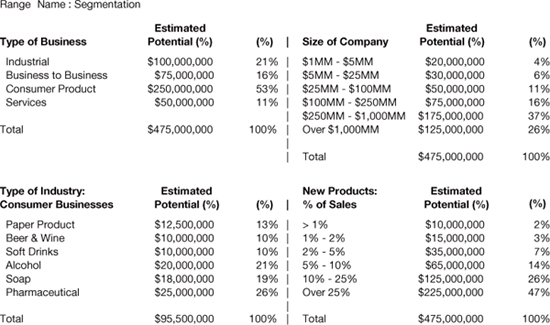
Usually the first step in analyzing the customer is segmenting the market. You could go after just one segment that you believe offers the greatest profit potential, as I do in real estate. If you go after the entire market, then you should plan for what I call obtaining “equal share of the high potential.” You should segment your market by listing the various companies or customers by their profit potential in descending order and then opposite their names insert your share of their business. If you are like several companies that have hired me as a consultant, you may have a larger share of those companies with lower profit potential. For example, your market share could be 20 percent, but you are getting 30–40 percent from the smaller potential companies and only 5–10 percent from the larger. If this is true, you should detail in your plan how you can get 20 percent from the large potential. If you achieve this goal, your profit will increase dramatically. Chapter 15, Maximizing High-Potential Accounts, discusses this concept in detail. Figure 4–1 shows the first case history from the computer software (CCUST.xls), which is one segmentation of the market. This hypothetical company sells computer software.
Final reminder to download the software from www.amacombooks.org/go/MarketingPlan4. The book is revving up, and you’ll want to take advantage of what the software has to offer.
Looking at the upper-left quadrant of Figure 4–1, you will notice that the greatest profit potential for this company is consumer product companies with sales over $250,000,000; in the bottom-right quadrant, we see that new product sales accounting for 10 percent or more of total sales offers them the best profit potential. These two matrices become a description of their main target. The remaining two segmentation matrixes show that there is not a great variance in the type of consumer products or size of company. Now, as mentioned before, each of the companies in these preferred segments should be listed relative to profit potential in descending order and the company’s market share listed opposite each one.
Figure 4–1 Customer segmentation analysis (CCUST; range name: Segmentation).
Now you should bring up downloaded Excel file CUST.xls, a facsimile of which is shown in Figure 4–2, and insert your own data for one or more markets. (Only insert data in the blue “active” cells; the others contain formulas and should not be touched.) You can change the headings of the various segments if you want. After you have selected the segments you should be in, then list each company or customer relative to profit potential in descending order and then opposite each company, insert your certain market share.
Yes, pretty daunting. Perhaps you want to tackle this after you have read the chapter all the way through (or perhaps after you have read the book all the way through).
After you have selected the most favorable segments, the next step is to determine the individuals involved in the buying decision. You may have a situation where there is only one buyer, but there are usually several people involved in the buying decision. A few companies I have worked with were presenting to line personnel for equipment used by line and were not making any headway. After completing some research, they discovered that as many as five other layers of the company were involved in the buying decision. Remember, when you call on a customer, he or she usually will not tell you that others can kill the sale.
Figure 4–3 presents the second part of the case history file and shows some job descriptions involved in this hypothetical purchase process.
Notice that in the Excel file we provided for you to work in, CUST.xls (see Figure 4–4), you have space to insert those who influence the purchase, those who actually make the purchase, and those who use what is purchased in your business. This doesn’t mean you should be spending marketing dollars on all these individuals equally. The main reason for this exercise is so you can rank them in importance in the next step, because you want to spend your dollars against those you rank at the top.
Figure 4–2 Your segmentation analysis (CUST; range name: Segmentation).
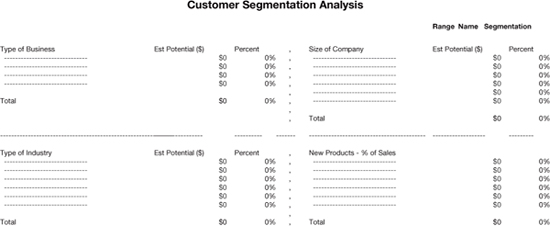
Figure 4–3 Purchase process (CCUST; range name: PurchaseProcess).
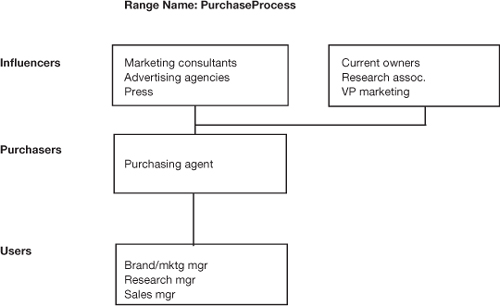
Figure 4–4 Your purchase process (CUST; range name: PurchaseProcess).
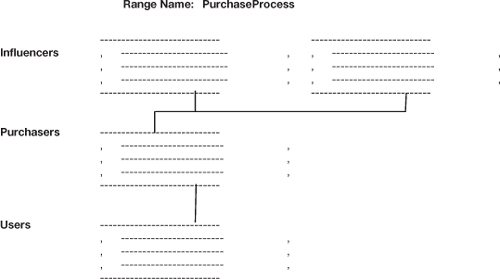
So go to your Excel file and insert the individuals involved in your purchase process in the file shown next.
Now the next step probably requires research and examination. The task is to rank the individuals you have identified in order of importance or impact on the purchase. This can be tricky. Some cereal manufacturers thought mom came first until they realized it was the kids. Birth control manufacturers thought the doctors prescribed what they thought was best. Wrong again. It took a female marketer to tell them that women were the ones that made the decision. Likewise, many automobile dealers lost sales when dealing with female customers because they didn’t think they would make a decision without their partner or husband.
Now the order in which you rank the decision makers will not be the same for all companies, but with experimentation you will see that those that are ranked at or near the top stay at the top and those at the bottom stay at the bottom. Figure 4–5, the third part of file Ccust, shows how we have ranked those whom we identified.
Figure 4–5 Purchase process priority (CCUST; range name: PurchPriority).
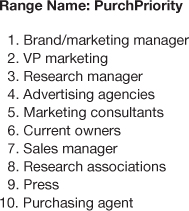
Notice for this hypothetical company purchasing our software there are ten individuals or job descriptions involved in the purchase process. When allocating marketing dollars for this company, you would first budget for the brand/marketing manager, then the VP of marketing, and keep going until you run out of money. As you will see later, in Chapter 9, The Advertising Plan, the messages or sales presentation should be different for each one.
Figure 4–6 shows the Excel file into which you can insert your own data. It is the third matrix presented in Cust.xls.
You want to determine what turns on each of these individuals in the purchase process. Remember, you are looking for the benefit of the product/service, not the feature (see Figure 4-7). You don’t buy a Cadillac or Lexus because of its gas mileage, appearance, or drivability. You buy it because when you own one, everybody thinks you are big shot. Temple University professor Bryant Simon states that the reason Starbucks is successful is because of the lifestyle we buy with the $3 cup of joe. He continues, “Starbucks became a Wall Street favorite by making its customers feel environmentally aware, upwardly mobile, connected and cool by welcoming us, by name, into their clean, urban-chic stores, and pumping hip music.”1
Figure 4–6 Your purchase process priority (CUST; range name: PurchPriority).
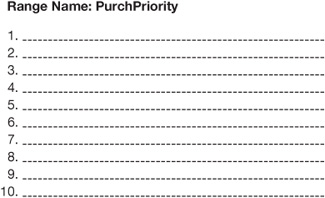
Figure 4–7 Benefits/features sought (CCUST; range name: BenSought).
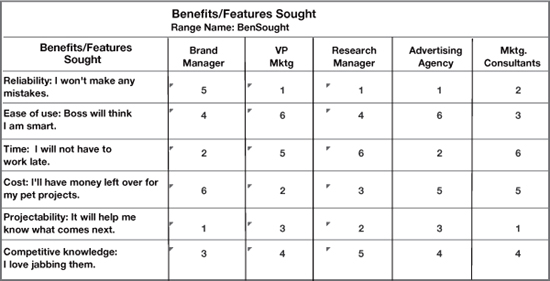
In this particular case, the brand manager is number one in the purchase process priority and the feature/benefit most important to her is the fact that the software allows her to project (“It will help me to know what comes next”). When talking to the VP of marketing, who is number two in the purchase process, the most significant benefit of this software will be reliability (“I won’t make any mistakes”). Look at each of the cells carefully.
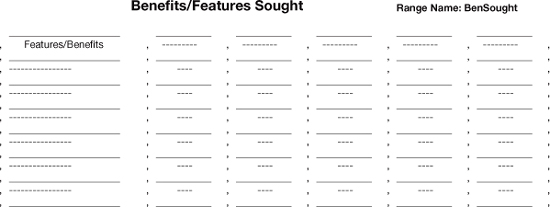
Now it is time for you to put in your own benefits/features in CUST.xls, and prioritize them for each of the individuals you need to influence (see Figure 4-8). First, you need to come up with various benefits for your product or service you believe the individuals in the purchase process are most interested in—and then you must rank them for each job title or customer classification.
The final step in this series is determining how well the benefits/features are delivered. Once again this will take some research, like a benchmark study (see Chapter 17, The Research Plan). The question is how well is your product/service delivering on the features/benefits desired by the people in your purchase process versus the competition. Let’s take a look at our hypothetical company.
Figure 4–8 Your benefits/features sought (CUST; range name BenSought).
In the scoring used here, a double plus means a competitive edge, and that they alone deliver this feature. A single plus means the company delivers on the feature, but so do others. A zero means they do not deliver, but it is not considered a big negative, and a minus means they do not deliver and it is considered a negative.
When you look at the chart in Figure 4–9, you see five choices facing a prospective buyer to whom you are trying to sell your tracking software. “Model” stands for your new software and “STM” is a competitive product. Test marketing is of course the most reliable way to get information about a product, and will allow you to make good projections, but is difficult, time-consuming, and expensive. “No test” means “do nothing at all” (and as you can see, this is a first-class ticket on the cheap-quick-and-easy train: double pluses there). And we all know about panels (better than nothing, but. . .). These then are the options facing the individuals on how to monitor their data, and how they rate them.
Figure 4–9 Benefits/features delivered (CCUST; range name: BenDelivered)
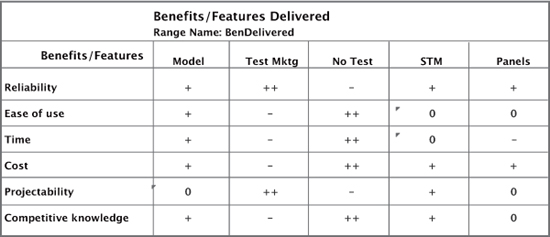
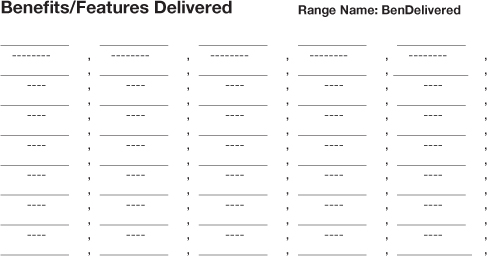
Our hypothetical company has a problem. Projectability, which is the number-one feature desired by the person at the top of the purchase process, the brand manager, only rates a zero. Reliability, sought by the number-two person in the buying decision, the VP of marketing, gets a plus, which is better than a zero, but does not give the company a competitive edge on this factor. Now take a look at your own company. Using the information that you developed for Figure 4–8, complete Figure 4–10 as best you can. You will almost surely need new research to complete the task.
Figure 4–10 Your benefits/features delivered (CUST; range name: BenDelivered).
Note
1. Luciana Chavez, “Professor gives Starbucks a roasting,” News and Observer, December 27, 2009; www.newsobserver.com/2009/12/27/254709/professor-gives-starbucks-a-roasting.html.