
3 Market Analysis
You have a wonderful idea. A better way to do something. You spend several months perfecting the concept, and then you do your launch. Sales are slow at the beginning, but after a few years, they pick up. However, you realize that you are still not making much of a profit. What’s the problem? It could be one or more of several market factors that determine whether you can make money in a specific market—regardless of the superiority of your operation. There are two questions you must ask yourself at the very beginning of the process:
1. Am I going into the right market?
2. Do I have the resources to become a market leader?
This chapter concerns an important element of that “right market” question: market profit potential. If you have what you believe is a brilliant new business concept and are going to devote your life to it for several years, you want to be sure you are going into a market that will reward you well if you finish near or at the top. That reward could be money or, if you are a nonprofit organization, it could be doing the most good.
Market profit potential refers to the conditions in a market that allow a business to make money if it can beat the competition. For example, a market that could be considered ideal relative to profit potential has the following characteristics:
![]() Large enough for you to obtain a good return, but not so large that you could not obtain a 30–50 percent market share.
Large enough for you to obtain a good return, but not so large that you could not obtain a 30–50 percent market share.
![]() The growth rate is between 5 and 25 percent per year.
The growth rate is between 5 and 25 percent per year.
![]() The stage of life cycle is either introductory or early growth.
The stage of life cycle is either introductory or early growth.
![]() There are few competitors and they are passive.
There are few competitors and they are passive.
![]() There are no adequate functional substitutions for the product or service, and the customers perceive the item as having high value to their business or personal life.
There are no adequate functional substitutions for the product or service, and the customers perceive the item as having high value to their business or personal life.
![]() Research and development (R&D), design engineering, manufacturing, operations, and marketing costs are relatively low.
Research and development (R&D), design engineering, manufacturing, operations, and marketing costs are relatively low.
![]() The market is not capital intensive and can be segmented.
The market is not capital intensive and can be segmented.
![]() The market is not seasonal or cyclical.
The market is not seasonal or cyclical.
![]() There is no regulatory exposure.
There is no regulatory exposure.
You will probably never find a market as ideal as the above description, but the closer you come, the greater will be your opportunity to make money. To assist you in a critique of your own proposed market, each of the desirable market characteristics is discussed in this chapter to help you determine whether your venture is really worth the effort.
The following characteristics determine the profit potential in a market:
1. Market size
2. Market growth
3. Competitive strength
5. Price sensitivity
• Functional substitution
• Perceived value
6. Market cost structure
• R&D costs
• Design engineering costs
• Manufacturing and operations costs
• Capital intensity
• Marketing costs
7. Market physical structure
• Segmentation
• Seasonality
• Cyclicality
• Regulatory exposure
You might want to keep a score card as you critique your market against the positive or negative effects of these factors, using Worksheet 3–1. You can photocopy it, or download it from the software and print yourself a copy. (Have you downloaded the software from www.amacombooks.org/go/ MarketingPlan4 yet and put it on your hard drive? If not, what are you waiting for?) Guidelines will be given at the end of the discussion of each factor about how you can use a scale of 1 to 10 (10 being the most favorable) to rate your market. However, any system that uses some type of pluses and minuses will suffice. At the end of this chapter you will be shown how to compile the ratings of each factor into a composite or overall rating of the market.
This use of numbers or the assignment of values to market characteristics is not an attempt to turn planning into a science like chemistry or physics. Market planning will never be a science because the relationship between cause and effect is not always the same in the business world. The purpose of this exercise is to make you think through each variable, one at a time so you don’t miss any major ones, and to help you to estimate the effect of each on your business. Hopefully, you will judge most of them correctly, but there probably will be some you misread. This uncertainty is what makes planning difficult. It is also the reason why planning is crucial. To be successful, you have to tie down as many variables as you can and keep scrutinizing the remaining ones. Otherwise, you are going down a blind alley.
Worksheet 3–1 Evaluating the profit potential of a market
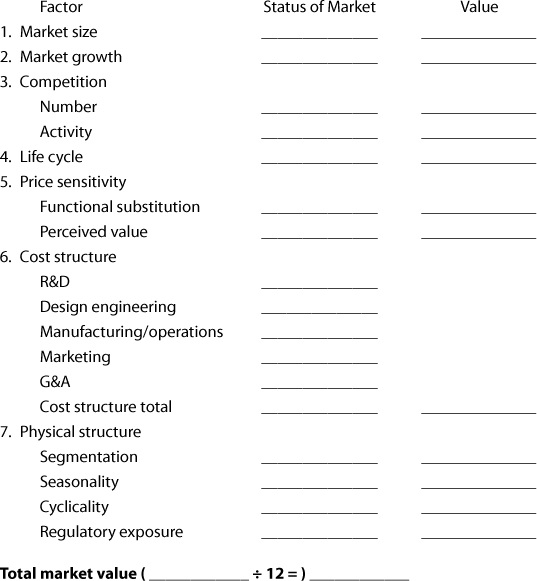
Some of you will not be able to do any scoring as you go through the chapter because you don’t know the status of these factors in your market. This may mean you will have to conduct research to obtain the raw data needed in the calculations. Or you may be able to score some factors for your market, but not others. In this case, just remember to divide your final results by the number of factors you actually scored. You may also want to read the whole book before beginning this exercise, so that you are familiar with the terminology and ramifications of the various market and business characteristics.
Market Size
Normally you have to become number one or two in share of total sales or revenues in your market or segment of the market to become profitable. If you estimate that the total size of the market in which you will be competing is $1,000,000, for example, and your sales estimate is $400,000, your share objective is 40 percent. If the market is much bigger, for example, $10,000,000, your share would only be 4 percent. In this situation, unless you withdrew to a smaller segment of the market, your presence would be so small that it would be difficult to become profitable.
Usually you need a share of between 30 and 50 percent to be number one or two in your market, unless you are in a fragmented market. (A fragmented market is one consisting of many companies, all with relatively small shares, such as restaurants and barber shops. It is clearly difficult to make money in fragmented markets, and we discuss this in some detail later in the section on competitive strength.)
As a normal market shakes out, or matures, there will be a leader with approximately a 40–50 percent share. The number-two player will have a share about two-thirds of the leader or a 25–35 percent share. The number-three player will have a share about two-thirds of the number-two player or a 15–25 percent share. Experience indicates that it is tough to make significant money if you are number three or lower on the totem pole.
According to the Strategic Planning Institute (pimsonline.com) in Cambridge, Massachusetts, there is a very high correlation between market share and return on investment (ROI). ROI is the rate of return on your investment. Based on the Institute’s analysis of their computer database of over 2,000 businesses, in most cases the higher the share, the higher the ROI. The main reason for this correlation is the experience curve, which also is discussed in the section on competitive strength.
To score the market size characteristic, you could take your estimated share objective and multiply it by 2 and then multiply the answer by 10. For example, if your goal is 35 percent, you multiply this percent by 2, giving you 70 percent, which is .70, then multiply .70 by 10 and you get 7 on a scale of 1 to 10. That’s a good score. (Or, if you don’t like all this mathematics, you could score this favorable situation with a plus sign.) However, you have to be sure your share objective is obtainable. For example, if your share objective is 35 percent and you estimate the total size of the market at $2,000,000, the volume of your sales would have to be $700,000. Maybe this volume level is unattainable for you. If it is, you would have to lower your share objective, bearing in mind what was previously said about the unprofitability of being third or lower in share. This would also lower the rating of how favorable the characteristic of market size is for you.
Conversely, $700,000 in sales may be too low an estimate of the popularity of your product or service. You could increase your share objective to 50 percent. (Going for more than half of the market is usually not profitable. You possibly could obtain a share above 50 percent, but the expenditures to get there usually can be invested more effectively in a different strategy.) A 50 percent share of $2,000,000 would give you revenues of $1,000,000—and a score of 10 (using the method above). Fantastic! However, is this enough to offset your costs? If not, you are probably going into a market that is too small. In this case, you may want to reexamine your whole concept.
Market Growth
Normally, you want to be in a growth market because it permits you to gain share even though the competition may be increasing in sales. For example, the market could be growing at the rate of 10 percent, but you are increasing your sales revenue at 15 percent. That means you are gaining share. At the same time, competition could be increasing their sales at the rate of 5 percent and be very happy, even though they are losing share. If they continue to let you gain share on them, you could eventually become so strong they could no longer compete. That was the story with American automobile manufacturers and their Japanese counterparts, although some of the American companies are now fighting their way back. It is also true with Hewlett-Packard and Dell, with Hewlett-Packard gaining share worldwide because Dell put out some defective products.
However, if you enter a market with little or no growth, the only way you can gain share is take business away from competition. Your competitors may not know when they are losing share, but they sure know when they are losing sales. This gets them very annoyed and they’ll come back and try to hit you over the head. Hard. After being pounded by Wal-Mart and Target, Sears has been fighting to rebound under the leadership of its chairman, Edward Lampert, who added Kmart to the mix and made many other store changes, but success so far has been elusive. One former executive now refers to the company as a hedge fund rather than a retailer, saying that management has diverted funds from maintenance and improvement of stores to nonretail financial investments.
Many people refer to Lambert as another Warren Buffett. He says he is not interested in total retail sales, just profit. Kmart has been profitable for the last three quarters and is sitting on $3 billion in cash. He has introduced four upmarket clothing lines and beefed up the electronics department. His plan for Sears is to leave malls and build big box standalone stores. Sears’ profit is tied to appliances and with housing down, sales have been weak. He did sell the $28 billion credit card line to obtain more investment income.
J.C. Penney has also been struggling with only $251 million profit in the last fiscal year, although they introduced the highly popular Ambrielle lingerie label and American Living brand by Ralph Lauren. The problem for Sears, Kmart, and J.C. Penney is Wal-Mart and Target. They lead with the discount store strategy and are now so big that it’s difficult for any other retailer to compete.
If you are entering a new market, you want to maximize share as fast as your company can prudently handle the increase in sales. You want to lock out competition by lowering your costs through the use of the experience curve. Drive your costs down as fast as possible; it then becomes difficult for competition to enter.
Attaching a numerical value to market growth cannot always be linear because extremely high growth could be a negative to many companies. You may not want to be in a market experiencing a high growth rate because of the huge negative cash flow you will experience. Therefore, I suggest that you assign the “ideal market growth rate” for your company a value of 10 and score your market accordingly. In this case, growth rates both above and below the ideal would have lower scores. For example, if your ideal is a 30 percent growth, one market growing at the rate of 15 percent and another growing at the rate of 45 percent would both receive a score of 5 or some type of mark between a plus and a minus.
Competitive Strength
This is one of the most important factors that determines whether you will enjoy profitability, and surprisingly, one that many entrepreneurs don’t even take into account. Actually, it’s the competition rather than the customer that determines your revenues, market share, and profit. If you get into a market with weak or passive competitors, your opportunity is practically unlimited. You will have to scratch every inch of the way, though, if you run into an Anheuser-Busch (Budweiser, Michelob, Busch), Procter & Gamble (Charmin, Crest, Ivory), Merck (pharmaceuticals), or Cisco (computer networking).
However, don’t be afraid of size alone. Witness IBM. Although one of the largest corporations in the world, it suffered tremendous setbacks in its personal computer business, which operated on such low margins that it was sold. However, in the long run it may have been smart because they are now concentrating on the high-margin consulting business.
Competitors with large market shares are the most dangerous to you when they take advantage of what is known as “the experience curve.” The experience curve reflects the fact that you can cut your unit costs the same percentage rate every time you double your output. You accomplish this cost savings through the use of the learning curve, economies of scale, and throwing your weight around. The learning curve is based on the premise that as workers keep doing a task over and over again, they can do it faster and more accurately. Economies of scale are available when you increase the size or number of your plants or stores. If you built a plant twice as big as your current one, it probably won’t cost twice as much to build or run. If you have to allocate your advertising over three stores, it will cost you more per store than if you could allocate the cost over twenty stores. Throwing your weight around refers to such activities as badgering your suppliers for lower costs because of the volume you buy from them and threatening the channels of distribution into handling your product or service and no others.
If a market is on an 85 percent experience curve, it means every time volume is doubled, costs will be 85 percent of what they were previously. Some industries, such as computer chips, have very steep experience curves. If a market enjoys a 50 percent experience curve rate, it means every time you double your volume, you cut your costs in half. You should estimate the experience rate that does or will exist in the market you are entering. If a competitor is much bigger than you, they have doubled their volume many times and, consequently, should have lower costs.
In Chapter 6, The Product/Service Plan, you will be shown not only how to estimate the experience curve rate for your market and competition but also how to take advantage of it to beat your competitors.
In general, a market with few competitors is usually preferred over one with many, even though it means they will have large shares. A market with few competitors, such as the oil industry, is easier to read than one with many, such as the restaurant business, which is referred to as fragmented. It is nearly impossible for any single restaurant to read the market.
Here’s why: Whenever you are contemplating the execution of a strategy, you should always ask yourself, “Will competition follow?” If your answer is “I believe so,” most likely the strategy will do you more harm than good. If you decide to cut your price and competition matches you, where are you? Worse off. If you double your marketing budget, and competition does the same, where are you? Worse off.
If you enter a market with just a few competitors rather than twenty or thirty, it is much easier to estimate how they will react to your strategies. In this situation, with a little homework, you could obtain a good fix on their business philosophy.
If you introduce a new product or service, will they immediately double their R&D to get into the market as soon as possible with a comparable item? Or are they relatively complacent with their current share? What will they do if you start to really make a splash? Will they still hold back? How long? Obviously, you would prefer your competition to contain a couple of Dictaphones or Sears rather than Costco and Apple.
In summary, you would like just a few competitors who are fat and happy. If you want to put a numerical rating on the competitive situation in your market, you should break it into two parts:
1. Number of competitors
2. Their anticipated aggressiveness
Regarding the number, having no competitors should rate a 10. If you have one, give it a 9, if two, give it an 8, etc. As for aggressiveness, you’ll have to use your own judgment. If you believe they will match anything you do, or if they are far down the experience curve and pushing it like crazy, give it a 0. If you believe they won’t pay much attention to you for a few years, give it a 5. If they look like General Motors, give it a 10. Although now they are getting better, during the past several years, GM was asleep at the switch. They did not go into small car development when gas was plentiful, and when the first gas crunch came in 1972, people switched to small cars, leaving GM out in the cold.
Stage of the Market Life Cycle
The market life cycle, which is based on the actions of your target audience, is divided into six stages:
1. Introductory or embryonic
2. Early growth
3. Late growth
4. Early maturity
5. Late maturity
6. Decline
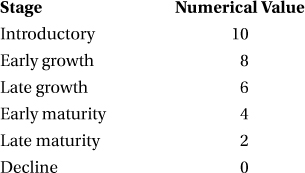
The introductory stage refers to a brand-new market, such as 3-D television sets. Early growth refers to the early stages of a market that is really booming, like social media and iTunes. Late growth is when the market is still experiencing growth, but not quite as fast as early growth; for example, computer software and standard cell phones. Early maturity refers to the period when the market has slowed down, and all products or services are beginning to be perceived by the customer as being basically alike. Department stores are examples. Late maturity is when the market starts to shrink in size (or has shrunk), such as newspapers and CDs. Decline refers to the ending stages of the market for products such as vacuum tubes and fluorescent lights. There is no set period of time for any of the stages. The cardiopulmonary pacemaker was in the introductory stage for thirty-five years. Computer hardware had been in growth for over forty years. The hula hoop went through all six stages in one year—twice. A market can generally be in one stage while a segment of the same market is in a different stage.
Personal computers in the United States are in late growth, but personal computer work stations that permit the use of advanced software such as computer-aided design (CAD) and computer-aided manufacturing (CAM) are probably in middle growth. Market stages can also be different depending on geographical location. Soft drinks are in maturity in the United States and Western Europe, but in growth in Eastern Europe, Russia, and Asia.
Entering the market during the introductory stage—that is, your product or service is the first or one of just a few in a new market—offers you the best long-term profit potential. You have few or no competitors and you have the opportunity to become strong before others realize you have a good thing and try to muscle into your market. Companies that start new markets usually end up being the market leader. However, you have to excel in R&D and have the financial resources to hang in there until you start making a satisfactory return, which normally is not until the later part of early growth.
Some companies, like IBM, wait until early growth to enter a market. By so doing, they save on R&D costs and are in a position to copy or improve on the best technology existing in the market. It also keeps them out of markets that never make it to the growth stage. The negatives of this strategy are that they have to play catch-up and they have to excel in manufacturing and operations and marketing. In the early 1980s, Japanese companies were not strong in R&D, but they excelled in manufacturing. They would take American technology, like the electronic transistor, and adapt it to a product like radios, creating a new product. Today, not only are they preeminent in manufacturing but in R&D as well.
If you are entering in early growth, you will need the expertise to build your sales force and maximize your distribution coverage. You will want to create awareness of your product or service first, and then go for customer loyalty. You want to convince customers that they should purchase your product or service regardless of competitive activity. This is referred to as “building a franchise,” and usually the best marketing tool to use is advertising. Consequently, total dollars spent on advertising by all participants in a market is the highest during the early growth stage.
If you are considering entering a market in late growth or early maturity, you can’t hit competition straight on because they are too strong. (If you have developed a product or service that is clearly superior to theirs, you are not hitting them straight on; you are starting a new market.) You have to find a segment or niche in the market that competition has overlooked or that is currently too small for them to get excited about. The Japanese got their start in the automobile market by manufacturing small cars, a segment many U.S. companies were not interested in because it delivered smaller profits. The U.S. car manufacturers also correctly thought the American public wasn’t interested in small cars. Then the oil shortage created higher gasoline prices, and the public demanded smaller, more economical cars. The Japanese were sitting there with the supply.
You can open a small service business such as a bank, photocopy center, or retail clothing store in markets that are in late growth or early maturity, and have the opportunity to become successful. However, you will have to offer the customer something they can’t get from your bigger competitors, such as better service. The problem is the more successful you become the greater the danger of competition stepping in on your turf. If you plan on your business growing, the critical factor is whether the bigger competitors can match what you do to attract your customers. If you start selling a product such as a VCR in a market in late growth or early maturity, you have to recognize that you will be operating from a cost disadvantage. In order to make money, you will have to convince the customer that there are good reasons to pay more for your product.
Entering a market that is in late maturity or decline means that you will be operating against a shrinking customer base and you will be up against competitors that will sell their product or service with little or no profit just to stay in business. This is a market that you want to stay away from, except in some unusual circumstances. One example of an unusual circumstance is the vacuum tube business. There are only two or three companies left, and they are getting a good financial return because they bought their competitor’s most efficient plants for a fraction of what they were worth and closed down their own plants, which were obsolete.
If you want to attach a numerical score to a market based on the stage of the life cycle, you could use the following:
Price Sensitivity
A market may be very sensitive to price increases or decreases, very insensitive, or somewhere in between. In a market that is very sensitive to price, a price increase of 10 percent would result in a decrease in volume greater than 10 percent. Conversely, a price cut of 10 percent would result in an increase in volume exceeding 10 percent. In an insensitive market, a 10 percent price cut results in a volume increase of less than 10 percent, and, conversely, a 10 percent price increase causes a volume decrease of less than 10 percent. Most entrepreneurs want a market that is relatively insensitive to price because, obviously, it offers a greater profit potential.
There are two major factors that can make a market relatively insensitive to price. One factor is that the buyer perceives the market to have products or services with no viable functional substitute. Medicine and waste management are good examples of this; there are no satisfactory substitutes for the products and services in these markets. When you are ill, you have to see a doctor. If the law states you have to dispose of your waste in a certain manner, you will do so, or get fined or go to jail. Unfortunately, this situation is not true for most markets, like restaurants, air travel, snow blowers, and artificial logs. You can eat at home or travel by car; you can shovel your own walk and cut down your own tree.
The other factor influencing price sensitivity is the perceived value of the products or services offered in the market. Logically, you don’t really need alcohol, perfume, and designer jeans, but you think you do. In purchasing, perception is fact. It’s not what’s offered that counts; it’s what you believe it offers. Therefore, if you believe exotic perfume will make you more popular, the price is secondary. How strong is the perceived value of garbage cans? You may need garbage cans more than perfume, but the customer will pay a 100 percent markup on the perfume and then shop five stores for the cheapest garbage can. To put a grade on price sensitivity in your proposed market, estimate or critique each of the two factors above, add the scores, and divide by two. Markets with no adequate substitute would receive a 10 and products/services with a high perceived value a 10 also. Where there are many substitutes, or the products/services don’t have a high perceived value, the market would receive 0.
Market Cost Structure
The cost of doing business in some markets is considerably higher than in others. Many markets demand high R&D expenditures; others incur high engineering, manufacturing, or operations cost; there are those with high marketing expenditures; and several have more than one of the above negatives. The perfect market for you would be one where all of the above factors are below average in costs as a percent of sales.
A market that requires high R&D and subsequent new product or service introductions will hurt your profitability short term, and it will hurt long term if you have a low market share. One of my clients, a West Coast frozen soup manufacturer, discovered that they had been losing money for years by selling their soup to airlines. The airlines insisted on a constant stream of new types of soup. The manufacturer had never treated this group of customers as an individual market; when they pulled a separate profit and loss statement, they realized that it was an unprofitable venture.
Although having high R&D costs and needing constant innovation is a negative situation, you could build a successful company by using R&D to develop new products and services for new markets. This is the story of 3M. 3M, best known to the general public as the manufacturer of Scotch Tape and Post-it notes, introduces more new products each year for new markets than any other company in the world, and its success rate is at least equal to the best. The key to success is whether your R&D expenses will result in new revenues. If you are in a market where your new product/service just replaces an existing product or service, then R&D will account for a large percentage of costs and have a negative effect on your bottom line.
Ideally, you also want to stay away from markets with high manufacturing or operations costs. These markets usually require extensive capital investments, which means you need extremely high profits to earn a decent ROI. If your investment is $300,000, you need $60,000 in profit to earn 20 percent on your money; if your investment is only $150,000, a $60,000 profit would result in a 40 percent return.
Markets requiring large monetary investments are referred to as “capital intensive.” Capital-intensive industries deliver low ROI unless the large investments produce an increase in productivity, which has positive effect on ROI.
If possible, stay away from markets that demand large investments, which, in addition to plant and equipment, could include excessive amounts of slow-paying accounts receivable and large inventory, long and expensive leases, and extensive supervisory personnel. It is true that large investments act as an entrance barrier to keep other competitors from coming in; on the other hand, they may not want to even if they could.
Although markets with high marketing costs are not considered capital intensive, markets with this characteristic can have a severe negative impact on profit potential. Marketing costs include selling, promotion, distribution, packaging, customer relations, and market research. When you combine high capital intensity and high marketing costs, you are really asking for rough sledding. If you don’t obtain a major share of the market fast, you probably won’t make it. Witness the airline business, which requires large investments for planes and gates and also has large advertising budgets.
Most markets for industrial products, which are usually capital intensive, typically do not require extensive marketing budgets. Therefore, if you are considering introducing an industrial product and you believe extensive marketing will be needed, it should raise a red flag. If you are considering a product or service for a consumer market, the reverse is true. Usually the marketing commitment is large, but the cost for producing the product or service is low. Some of you would probably faint if you knew the actual cost of producing some of the products you buy, like toothpaste, soap, beer, and pills for your headache and upset stomach.
Service markets normally have relatively higher costs for producing the service than consumer product markets because more labor is involved, but some enjoy high gross margins (revenues minus the cost of producing the service). Banks are a prime example of this: It doesn’t cost a bank much to borrow money at 4 percent and then loan it to you at 6 percent interest. That enables them to allocate large sums to marketing. The only reason banks have gotten into trouble recently is that they became greedy and failed to realize that the value of real estate could not continually increase. In addition, they have done such a poor job of spending their marketing dollars that the number one reason for selecting a bank is still its location.
Prescription drug manufacturers have both low manufacturing and low marketing expenses, but they claim justification for their expansive operating margins (revenues minus manufacturing, marketing, and administration expense) due to their high R&D costs. A prescription that you purchase for $100 probably cost $1.00 to manufacture. However, that drug probably took ten to twenty years to develop and receive Federal Drug Administration (FDA) approval.
In summary, what you want is a market that has relatively low costs, as a percent of sales, in the four major costs centers: R&D, design engineering, manufacturing/operations, and marketing. If one cost center is above average, then, ideally, the other three should be below average. If you get yourself into a market where these costs are low, and through good management you are able to keep your own costs below the market average, your reward will be much greater than if you start off in a market where these factors leave little room to maneuver. If your market demands high marketing costs, you might develop more bang for your buck, but it will still be difficult to drastically lower the expenditure as a percent of sales.
If you want to assign a numerical score to these cost centers or factors, Figure 3–1 shows approximate ranges. General and administrative (G&A) expenses have been added so the sum equals total operating expenses, and they have been kept at an arbitrary 5 percent of sales for simplicity.
Add the percentages and calculate your estimate of your market’s operating profit. If you approach 10 percent, which is the average for the country, give this market cost structure factor a value of 5 (a plus). Any number over 15 percent deserves a 10 (a double plus). Any negative number equates to 0 (a minus). Score numbers in between accordingly. If the score is 3 or less, you should reconsider your concept.
Figure 3–1 Approximate ranges of various costs as a percent of sales and resulting operating profit.
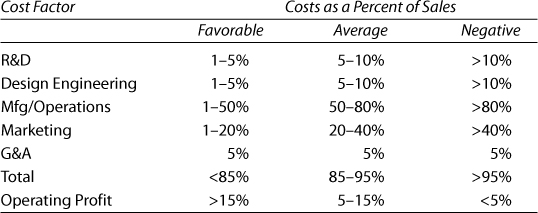
Because the above represents an average of all markets, the ranges and assigned values are a matter of judgment and should only be used as a guide. To score your own market, assign percentages for each of the factors based on your critique of the market—or based on your estimate if this is a new market.
Remember, however, that this is only an estimate of market operating income, and does not necessary mean that you will match it. What you are looking for are markets that have the opportunity of making a good return. If you have greater resources than the competition, you probably can exceed the market average. But if you don’t, or competition is more aggressive than you, your operating margin probably will be much lower.
Market Physical Structure
Four factors are included in this definition of market physical structure. They are:
1. Availability of segmentation
2. Seasonality
3. Cyclicality
4. Regulatory exposure
Two other factors that could have been described as physical characteristics are size and growth, but they were treated earlier in this chapter as separate entities.
What you are looking for are markets that have the potential for segmentation and have no seasonality, cyclicality, or regulatory exposure. In 1969 Philip Morris purchased Miller Brewing, and the strategic plan they developed for the brand called for market leadership in ten years. They almost made it. From sixth place and a 4 percent market share, they were number two with an 18 percent share eight years later and closing in on the market leader, Anheuser-Busch, which was first with a 21 percent share. Then, in 1974, August Busch III obtained control of the family business from his father, and he took the company from a 21 percent share to over 40 percent in less than ten years by successful execution of the segmentation strategy. In the early seventies, the primary brand for Anheuser-Busch was Budweiser. Today they have Budweiser Light, Michelob, Michelob Light, Busch, Budweiser Dry, and a host of other brands.
Some markets that have not been successfully segmented are gasoline, airlines, food retailing, and banking. This is because either the market does not allow segmentation or the players have been unsuccessful in executing the strategy. Gasoline, airlines, and food retailing are probably examples of the former, and banking is an example of the latter. The question for you to ask is: “Can the market be segmented successfully?” You enter the market with one product or service and obtain a 20 percent market share. You then introduce a second line. Your original line goes down to a 15 percent share, but your new line adds a 10 percent share. Now you have 25 percent share versus your original 20 percent. And so on.
A seasonal market means that some months during the year your revenues will be much lower than others. Examples are ice cream, greeting cards, skiing, flowers, and toys. If you have to carry high fixed costs throughout the year, this type of situation can be a big negative. In the skiing market of the eastern states, excellent snow conditions during the Christmas holidays and spring school break are essential; without them the best you can do for the year is break even.
If you do get involved with a seasonal market, you can flatten the revenue curve of your company by adding another business that is countercyclical, like summer activities at your ski resort. However, it has proven financially unsound to try to flatten the curve of a seasonal business. You will sell more ice cream in the winter if you increase your marketing expenditures during this time and decrease it during the high-volume summer months, but based on case histories of many seasonal businesses, you will make less money for the year. Normally, to maximize profit in a seasonal business, you want to promote the hardest during the high-volume months.
A cyclical market is one in which you enjoy a few years of high volume and then a few years of low volume. Examples are paper and forest products, metals and mining, construction, and aerospace. Once again, the critical factor in this type of market is control of fixed costs. In the paper business, when good times come, the companies expand their capacity by building new plants. When the downturn follows, they are left with excess capacity and suffer severe financial conditions. They have been doing this for the last fifty years. You would think they would learn from the past.
Like seasonality and cyclicality, you want to stay away from markets with high regulatory exposure unless you can handle these restrictive conditions effectively. Examples of markets with high regulatory exposure are pharmaceuticals, biotechnology, medical supplies, oil exploration, mining, and pollution control. You may say “Merck (pharmaceuticals) has made tons of money,” and “I wish I had bought stock in Waste Management (pollution control).” It is true that these two companies are winners, but for every Merck and Waste Management, there are hundreds of companies that failed. Examples include companies that had a superior drug, a revolutionary gene technology, a machine that facilitated better medical diagnostics, a seismograph that located oil, and an environmentally protective means to discard waste. Their major problem was that they could not hold out long enough to obtain federal or state approval.
A Connecticut company offers an ultra-high-frequency jet ventilating machine for use in respiratory care that has proven advantages over existing mechanical ventilators. It took years to perfect the technology. Then empirical confirmation was obtained by using the machine on animals. After this successful step, the company now has to convince doctors in many different hospitals to use the machine on their patients. All this activity before approval by the FDA and before any revenues whatsoever. The company has already gone through many stages of refinancing, and it appears that they possibly can no longer make it on their own.
If you want to put a numerical value on your market using these four factors concerning the market physical structure, use your judgment to score each one on a scale of 0 to 10, add them up, and divide by 4. For segmentation, if your market is easy to segment, like beer, give it a 10; if it appears difficult, like airlines, it warrants a 0. For seasonality, if revenues are basically equal during the twelve months, score 10; if more than 80 percent comes within a single quarter, it deserves a 0, and if 80 percent comes within six months, score it with a 5. For cyclicality, if sales are level through the years, excluding normal growth or decline, score 10; if volume drops more than 25 percent for one or more years and then regains its previous level, post a 0. For regulatory exposure, if the market requires no governmental approval, give it a 10; if it is similar to the drug industries, give it a 0.
Total Market
I pulled together a composite chart (see Figure 3–2) of how to score the individual factors that we looked at above.
We have analyzed a hypothetical market in Figure 3–3, using the numbers from our composite in Figure 3–2, and assigned values as follows: a number falling in the positive column will be given a value between 8 and 10, in the neutral between 3 and 7, and in the negative between 0 and 3.
Figure 3–2 Various conditions of market characteristics and how they affect market profit potential.
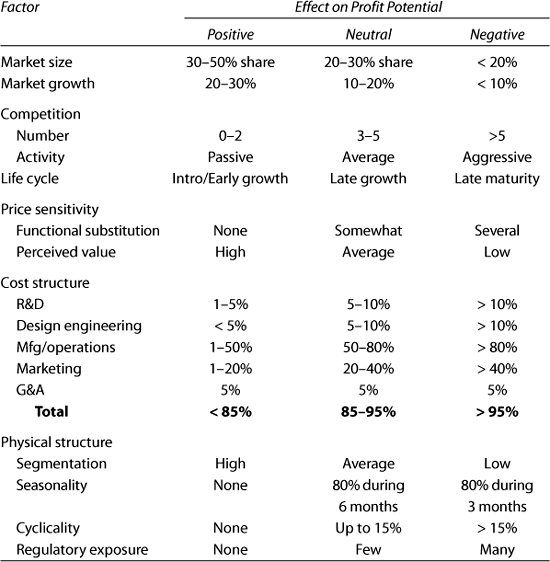
Figure 3–3 Evaluating a hypothetical market on its profit potential.
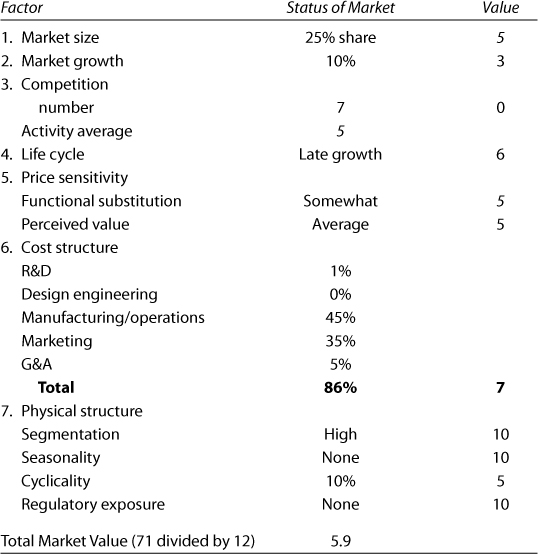
Let’s see what we have here. Figure 3–3 represents an example of a market with average profit potential. It is in late growth, growing at the rate of only 10 percent, and has seven competitors still active, but with only average aggressiveness. The products/services have only average values on functional substitution and perceived value, which is common for a market in late growth. The market operating income level of 14 percent is good, but with only a 25 percent share objective, the entrepreneur probably wouldn’t enjoy this high a margin. The physical structure scores well, but with all the above negatives, the value for the market is only 5.9. Possibly, the entrepreneur should have entered the market earlier in the life cycle when there was faster growth, fewer competitors, and a greater opportunity to obtain a larger market share.
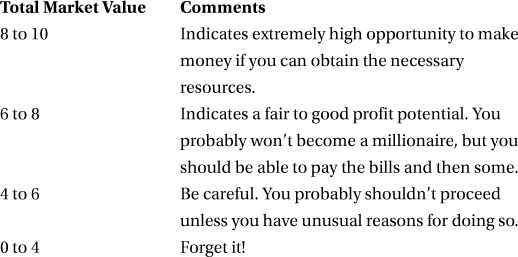
So, what is the upshot of all this work? How should you interpret the market value score of 5.9 that we generated in Figure 3–3? Should you proceed? Kill the project? The chart below is a useful tool:
Now see what you can do with the analysis you made of your own market potential using Worksheet 3–1. If you actually filled in numbers as you worked your way through the chapter, check it against Figure 3–2 and modify what needs correcting. Then add it up (again?), divide by the number of factors you were able to analyze, and see if it’s a go.
If you gave up on filling it in as you went along, now might be a good time to go back and see what you can do with all this information.