13 The Sales Plan: Future Sales
The computer files discussed in this chapter can be used for the introduction of a new product or service or an existing business to help you determine your sales forecasts, market share, and profit and loss.
In our case history file, CSALES.xls, you will see data relative to such factors as what percent of the potential buyers will become aware of what is being sold, future coverage area or distribution goals, sales closure rate, etc. By manipulating this data, you can see what effect each variable can have on the outcomes: sales, market share, profit, etc. And you will get a feel for how the model works.
If you were setting out to design this type of model, you would insert your objectives of the business at the bottom of the model and then add all the intangibles that influence these objectives at the top of the model. You would then add formulas between the intangibles and the objectives relative to how the intangibles influence the objectives.
This has already been done for you in this model. It is ready for you to insert your estimates and see what effect it has on your objectives. You can ask yourself, “What if sales closure rate increases x percent? What effect would it have on sales?” To answer this question, you insert the new closure rate and then scroll down to the objective to see the results. You keep altering your estimates until you reach the objectives you are seeking.
Then, in your marketing plan (see Worksheet 13–1 at the end of this chapter), you state how you are going to obtain the estimate you inserted for each intangible and if your marketing plan execution is successful, you should obtain the level of objectives shown in the model.
The amounts or levels you insert for the various intangibles are estimates on your part. The more research you have on this subject, the more reliable the model. But even if you don’t have all this research, inserting a “best estimate” on your part should give you a better idea of where you are going than just flying by the seat of your pants.
There are two parts to the model. The case history (CSALES.xlw) presents a hypothetical situation, with numbers or values already inserted. You can change any of the estimates to see what effect it has on the objectives. As with all Excel files, the numbers in blue are modifiable estimates; the numbers in black are formulas. The case history shows three years or thirty-six months of activity, although in your own model you can insert data for just one or two years if you desire. After you are through experimenting with the case history, you can bring up your file, SALES.xlw, and insert your estimates in the cells with blue lines
This model is divided into six ranges and has ten charts.
The six matrixes are:
1. Trial transactions (range name: Trial)
2. Repeat purchases (range name: Repeat)
3. Unit and dollar volume (range name: Volume)
4. Share of market (range name: Share)
5. Profit and loss (range name: Profit)
6. Market pricing and value (range name: Pricing)
The ten charts are:
1. Awareness and distribution
2. Trial
3. New triers and total repeat
4. Costs
5. Unit market share
6. Dollar market share
7. First-year sales and profit
8. Second-year sales and profit
9. Third-year sales and profit
10. Yearly sales and profit
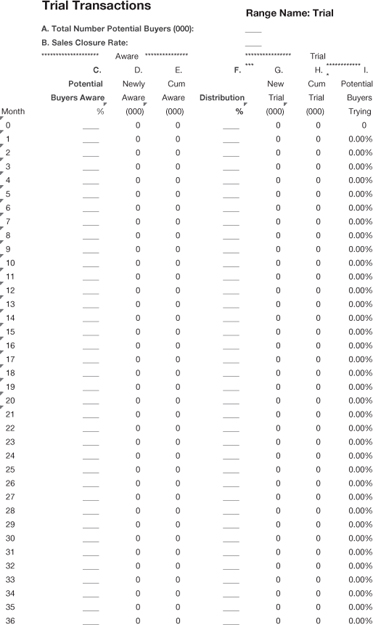
Let’s work our way through these matrixes, starting with Trial Transactions (see Figure 13–1). This matrix calculates the number of customers who will try or buy what you are selling for the first time. It consists of nine factors (A through I) that are either your estimate or a formula.
Let’s look at each of the variables involved.
A. Total number of potential buyers represents the total size of the market in which you operate. It would consist of your customers plus competitors’ customers plus all individuals or companies that are in the market to buy what you sell but have not yet bought from either you or your competitors. This is a variable you do not control, but it is a variable because the size of a market varies from one market to the next. This number can only be an estimate, but you should acquire as much data as you can to help you in your estimate because this gives you an idea of the total potential sales in your market and helps determine your market share. It does not represent the dollars; rather, it is the number of potential purchasers.
Figure 13–1 Trial transactions (CSALES; range name: Trial).
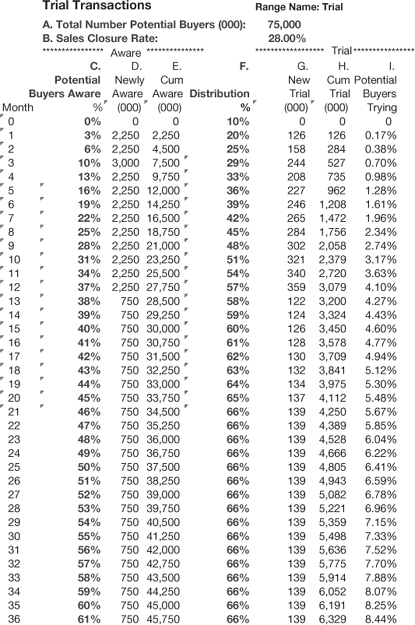
B. Sales closure rate represents your estimate of what percent of the potential buyers who become aware of you will try your service or buy what you have to sell for the first time. Put down the best estimate you can make and then check your number as you roll out your marketing plan.
C. Potential buyers aware represents your estimate of what percent of the potential buyers will become aware of your business each month after you start executing your marketing plan through the use of sales teams, advertising, sales promotion, public relations, etc.
D. Newly aware is a formula that gives you the number of individuals or companies that become aware of you each month. It is based on C. Potential buyers aware times A. Total number of potential buyers.
E. Cumulative aware is a formula and is the cumulative total of D. Newly aware.
F. Distribution is your estimate of what percent of the total potential buyers can conveniently buy from you if they so desire. If you have sales people who cover 60 percent of the territory, then you have 60 percent distribution. If you have three stores and 80 percent of the potential buyers can conveniently come to one of your stores, you have 80 percent distribution. If you sell via the Internet, then the number of clicks to your site should be added to your coverage (see Chapter 16, The Internet Plan).
G. New trial or first purchases is a formula consisting of C. Potential buyers aware times B. Sales closure rate times F. Distribution.
H. Cumulative trial is a formula and is the cumulative total of G. New trial.
I. Potential buyers trying is a formula of G. New trial divided by A. Total number of potential buyers.
Figure 13–2 is a chart in the Excel file that illustrates the relationship between awareness and distribution.
After you complete this range in your own matrix (SALES.xlw; see Figure 13–11), you will have an estimate of the number of new customers.
Now, let’s move on to repeat purchases.
The matrix shown in Figure 13–3 calculates the number of customers that will buy your product/service more than once. It consists of eleven factors (J through T) that are either your estimate or a formula. They are:
J. Average repeat purchase cycle is your estimate of the amount of time that a customer is out of the market after they buy from you or a competitor. If you sell haircuts, it may be thirty days. If you sell computers, it may by two or three years.
Figure 13–2 Awareness and distribution (CSALES; chart name: Awareness & Distribution).
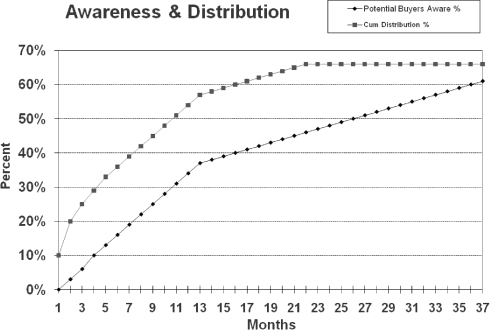
Figure 13–3 Repeat purchases (CSALES; range name: Repeat).
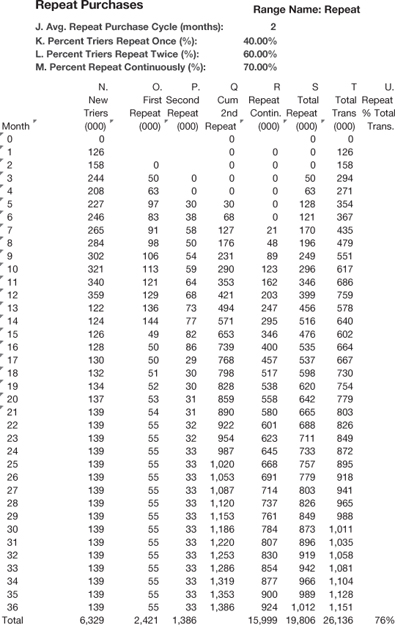
K. Percent triers repeat once is your estimate of the percent of the buyers who try you or make a first purchase from you that will repeat the purchase within the time frame you inserted in J above.
L. Percent triers repeat twice is your estimate of the percent of buyers who repeated one purchase that you estimate will repeat a second time within the time frame you inserted in J above.
M. Percent triers repeat continuously is your estimate of the percent of buyers who repeated their purchase from you twice that will continue to be loyal customers.
N. New triers is a formula that picks up the numbers from G. New trial described above.
O. First repeat is a formula that multiplies K. Percent triers repeat once by N. New triers and deposits the number in this column one or more months later based on J. Average repeat purchase cycle.
P. Second repeat is a formula that multiplies P. Second repeat by K. Percent triers repeat once and deposits the number in this column one or more months later based on J. Average repeat purchase cycle.
Q. Cumulative second repeat is a formula that is needed to calculate R. Repeat continuously.
R. Repeat continuously is a formula that multiplies M. Percent triers repeat continuously by Q. Cumulative second repeat and deposits the number one or more months later based on J. Average repeat purchase cycle.
S. Total repeats is a formula that adds columns O. First repeat, P. Second repeat, and R. Repeat continuously.
T. Total transactions is a formula that adds N. New triers and S. Total repeats.
U. Repeat % total transactions is a formula that divides S. Total repeats by T. Total transactions.
Figure 13–4 is a graph representing New Triers and Total Repeats.
After you complete range Repeat in your own file, SALES.xlw, you will have an estimate on the total number of sales transactions (column T). Range Trial calculates the number of trial sales transactions and range Repeat picks up the numbers from range Trial and adds the number of repeats. The result is total sales transactions.
The next range converts transactions into unit and dollar volume.
The matrix depicted in Figure 13–5 takes the number of transactions from range Repeat and multiplies it by the estimated average number of products/services or items purchased for each sale to arrive at the unit volume. After the unit volume is calculated, this number is multiplied by the estimated dollar value per sale to arrive at total dollar volume.
Figure 13–4 New Triers and Total Repeats (CSALES; chart name: New Triers & Total Repeats).
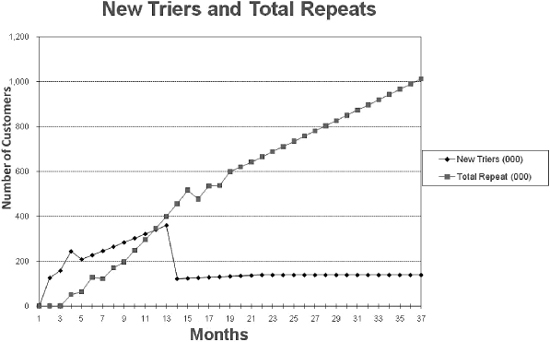
Figure 13–5 Unit and dollar volume (CSALES; range name: Volume).
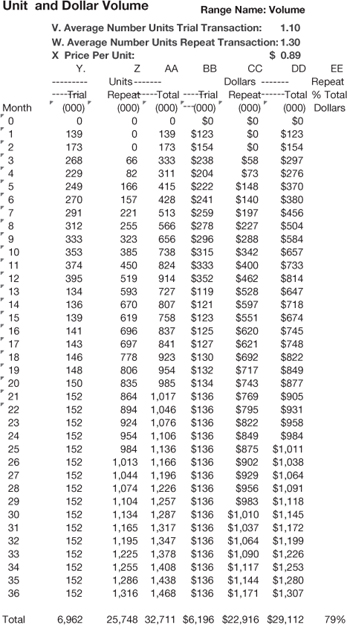
This range consists of ten factors that are either your estimate or a formula (V through EE). They are:
V. Average number units trial transaction is an estimate of the average number of items a new customer will purchase at one time.
W. Average number units repeat transaction is an estimate of the average number of items a repeat customer will purchase at one time. This may be the same as V. above or you may believe a repeat customer will purchase more units because he/she is now more familiar with your product/service.
X. Price per unit is the selling price per unit or item.
Y. Units trial is a formula that multiplies N. New triers by V. Average number units trial transaction to arrive at volume in units for new customers.
Z. Units repeat is a formula that multiplies S. Total repeats by W. Average number units repeat transaction to arrive at volume in units for repeat customers.
AA. Total units is a formula that adds Y. Units trial and Z. Units repeat to arrive at total volume in units.
BB. Dollars trial is a formula that multiplies Y. Units trial by X. Price per unit to arrive at dollar sales from new customers.
CC. Dollar repeat is a formula that multiplies Z. Units repeat by X. Price per unit to arrive at dollar sales from repeat customers.
DD. Dollars total is a formula that adds BB. Dollars trial and CC. Dollars repeat to arrive at total dollar sales.
EE. Repeat percent of total dollars is a formula that divides CC. Dollars repeat by DD. Total dollars.
After you complete this range in SALES.xlw, you have your estimate on total unit and dollar volume. Isn’t this a better way to arrive at your sales goals than just estimating a 5 to 10 percent increase for next year? Once sales goals have been established, the next range, range Share (see Figure 13–6), calculates share of market.
Range Share takes the unit and dollar volume estimates from range Volume and calculates share of market. Share of market is perhaps only an estimate, but it’s an important factor. If you are not watching your share, you could be increasing your sales but a competitor could be increasing their sales faster and be gaining share on you. That competitor(s) could then eventually become so big that you could no longer compete with them.
Range Share consists of five factors (FF through JJ) that are either your estimate or a formula. They are:
FF. Average market selling price is an estimate of the price per unit. It could be the same as X. Price per unit unless you sell to middlemen or the trade. Even so, you want to use the price to the end user to calculate share.
GG. Total market in units is an estimate of the total market size in units. This would consist of your sales plus all competitor sales plus all other potential customers for the product/service you and your competitors sell.
HH. Total market in dollars is an estimate of the total size of the market as GG. Total market in units, but now you are dealing in dollars.
Figure 13–6 Share of market (CSALES; range name: Share).
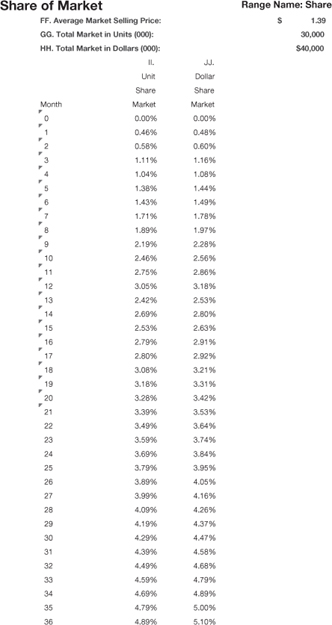
II. Unit share of market is a formula that calculates unit market share and is arrived at by dividing AA. Total units (unit sales) by GG. Total market in units.
JJ. Dollar share of market is a formula that calculates the dollar market share and is arrived at by multiplying AA. Total units times FF. Average selling price and dividing the total by HH. Total market in Dollars.
Figure 13–7 represents JJ. Dollar share of market as a graph. Guess this company has been doing something right.
Now that we have the estimated share of market in units and dollars, we will go on to the next to last range in the model, range Profit, to calculate a profit and loss statement (see Figure 13-8).
Range Profit uses the dollar sales from DD. Total dollars in range Volume along with costs to calculate profit and loss.
Figure 13–7 Dollar share of market (CSALES; chart name: Dollar Market Share).
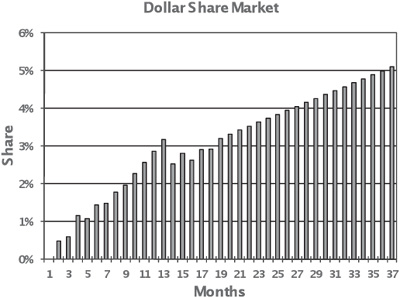
Figure 13–8 Profit and loss (CSALES; range name: Profit).
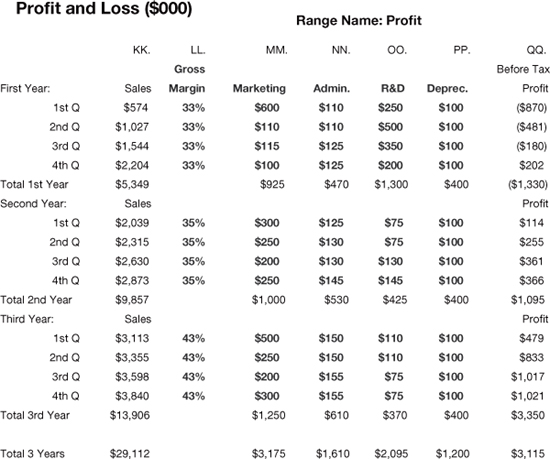
This range consists of seven factors (KK through QQ) that are either estimates or a formula. They are:
KK. Sales is a formula that picks up the sales figures from DD. Total dollars.
LL. Gross margin is an estimate of what percent of total sales dollars remain after cost of goods is subtracted.
MM. Marketing reflects estimated marketing costs, which consists of sales, advertising, sales promotion, public relations, customer service, and market research.
NN. Administration reflects estimated operating costs such as accounting, telephones, rent, office supplies, employer social security payments, receptionist, taxes, insurance, etc.
OO. Other costs could represent R&D, depreciation, bad debts, interest, etc.
PP. Other costs represent a second entry spot for other costs. (If you need a third column for other costs in your file, SALES.xlw, you can add it, but be sure to move the formula in QQ. to its new spot, and incorporate the new category of other costs.)
QQ. Profit before taxes is a formula that picks up KK. Sales and multiplies it by LL. Gross Margin and then subtracts costs such as MM. Marketing, NN. Administration, OO. Other costs, and PP. Other costs. The result is profit before taxes.
Figure 13–9 is a bar graph of the expenses over a three-year period that we saw in Figure 13–8. You can see that some remain relatively constant, and others (R&D and marketing) are quite variable.
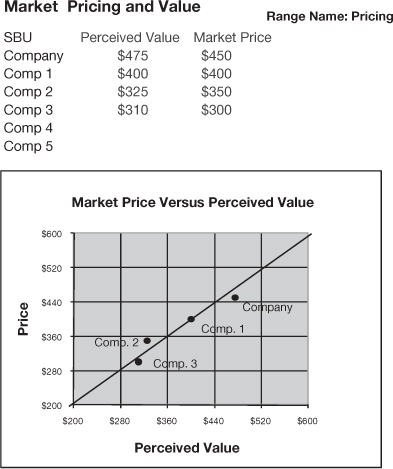
The last matrix in the sales module is on pricing. Figure 13–10 shows some prices and perceived values of SBU’s product and the products of various competitors, as rated by prospective customers.
If you look at the chart at the bottom of Figure 13–10 you’ll see that we’ve bisected the field with a diagonal line. You always want your price to be below the diagonal. In other words, you want the perceived value of your product or service to be higher than the actual price. The reason that the Toyota Camry is such a hot seller is that people think its perceived value is greater than its actual cost. Imported beer costs more than domestic, but it sells because the buyer believes its taste is far superior to a domestic beer such as Budweiser. That is the ideal situation—that your perceived value is greater than your price.
Figure 13–9 Business costs (CSALES; chart name: Costs).
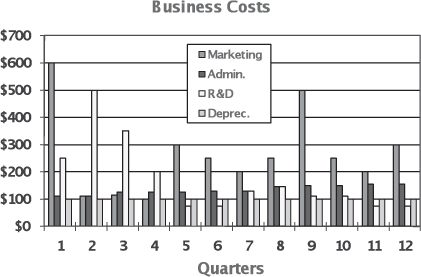
Figure 13–10 Market pricing and value (CSALES; range name: Pricing).
New Products/Services
When you launch a new product or service, there are some important things to keep in mind at all times. Some of them may be represented in the software (monitoring of your goals, for example), but most of them are a function of your own internal marketing and team-building skills. Note I say “internal.” If you don’t have everyone aware, on-board, even enthusiastic, your product launch will suffer. In particular, the goals of the launch must be known by all—and “all” means employees from all aspects of marketing: sales, marketing, customer service (yes, customer service, as we explain in Chapter 14), even accounting and finance.
Figure 13-11 is a facsimile of your first matrix for sales forecasting. Insert your estimates into the downloaded file (SALES.xlw; range name: Trial) and then take a look at your resulting objectives such as sales, profit, etc. If you don’t see what you like, keep inserting different estimates until you get the objectives you want. Remember, however, you have to be able to achieve the estimates that you insert.
I believe the sales closure rate is the most important measurement in your sales plan so I am including a checklist of pointers for increasing your closure rate. You may want to share this with all your sales presenters.
Remember, sales is a part of marketing.
![]() Have a good ten-second opener.
Have a good ten-second opener.
![]() Emphasize what the product or service will do for the customer.
Emphasize what the product or service will do for the customer.
![]() Cover all important selling points on every call.
Cover all important selling points on every call.
Figure 13–11 Your trial transactions (SALES; range name: Trial).
![]() Proceed logically from one point to another.
Proceed logically from one point to another.
![]() Anticipate objections and include answers to them in your presentation.
Anticipate objections and include answers to them in your presentation.
![]() Use visuals to make a point.
Use visuals to make a point.
![]() Get the customer into the act.
Get the customer into the act.
![]() Say “you,” not “we.”
Say “you,” not “we.”
![]() Check your progress selling each benefit by asking questions.
Check your progress selling each benefit by asking questions.
![]() Arouse curiosity.
Arouse curiosity.
![]() How you handle your product, visual, or sales tool is as important as what you say. Be sure to handle them with respect.
How you handle your product, visual, or sales tool is as important as what you say. Be sure to handle them with respect.
![]() Use a sixty-second close.
Use a sixty-second close.
![]() Ask for the order.
Ask for the order.
When I was a young boy I sold magazines door to door. I would ask the person who opened the door whether they would like a copy of Colliers, Companion, or American. I was not very successful. Then my father, who was in sales training, changed my opener and told me to bring my dog with me. This was in Minnesota, where it always snows. My new opener, while standing on the door step, with snow coming down and my dog by my side, was, “Would you like an evening’s enjoyment?” (Remember, this was long before Netflix, or even a TV in every home.) I soon became one of the most successful magazine carriers in the state.
So many companies keep talking about the features of their product or service. If I were selling computers, I would not just stand there next to the prospect while she glanced at the various models. I would have the machines operable and ask the prospect to bring up Word and type herself a message and go to the spreadsheet and type in some numbers. You want to get the person directly involved with what you are selling, and then segue into more technical material.
If you anticipate some objections, like premium pricing, bring the factor up before your prospect does. For example, with Apple’s computers, you will have fewer viruses than with a PC, so you won’t lose your stuff, and better graphics that will make your presentations the best in the office. If you board dogs and are premium priced, tell the prospect that his dog will not miss him as much because he will enjoy being in a bigger cage and will have the fun of playing with other dogs several times a day.
When you are at the end of your presentation, you don’t want the prospect to say I will think about it. Get her into the act. On your close, always give her a choice of two or more options. Which model, A or B, do you believe will give you the greatest increase in your office productivity? Or which deductable, $500 or $1,000, fits in best with your economic projections?
Objectives and Strategies
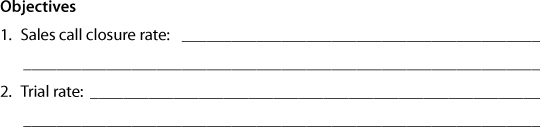
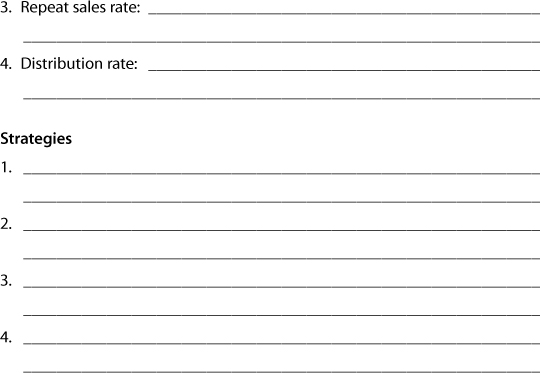
Following is a worksheet for your sales plan with some suggested topics. You can photocopy this or print out a copy from your downloaded Worksheets folder.
Worksheet 13–1 Sales Plan: Objectives and strategies