By the late 1990s, every company of significant size in the United States was considering how the Internet would affect their business. So many wondered how to partake of the online gravy train or worried that the gravy train would roll over them and leave them in the virtual dust.
O.C. Tanner was a little different. A get-rich IPO and dotcom exit strategy was not an option. Rather, utilizing this emerging technology to better serve our clients was essential. Beginning in late 1999 and all through the following year, we studied our business seeking to leverage the potential presented by the Internet. In January 2001, while still in the midst of changing our IT infrastructure (as discussed in the next chapter), we launched a dot-com only business. Initially called Entrada, it is today known as recognition@work. It is a performance recognition business which has expanded steadily and revenues grew more than 30 percent in 2008.
Briefly, here's how the business works. People at a participating company can, using the Web, nominate a colleague to be recognized for notable performance. An online wizard helps the nominator determine the level of award that is appropriate for the performance being recognized. A manager at the company, who is authorized to do so, approves the award. Once approved, the nominator learns of the approval via the Internet. The nominator then, via the Internet, prints out a certificate that cites the high-performing employee. He then conducts a small ceremony at the company's facilities where the employee is recognized in front of his or her peers.
The recipient receives the certificate which contains an access code. He goes online and, using the code, gets access to the recognition@work range of awards that have been approved for his or her level of achievement. The recipient chooses the desired recognition award, which is then shipped to his home or office. This business provides, via the Internet, an efficient and effective way for companies to appreciate employees who have performed with distinction. Research on the power of recognition to engage employees coupled with a positive correlation with greater financial performance is reported and explained in The Carrot Principle by Chester Elton and Adrian Gostick (New York: Free Press, 2007).
Companies are reaching out to assess their recognition effectiveness and determine its impact on manager relevance and employee engagement. OC Tanner's suite of solutions includes best practice research, books, publications, speaking, training, and awards celebrating service milestones and performance.
Tanner's value resides in customer intimate solutions that enable clients to achieve their objectives by powering appreciation to communicate what matters most to them. When recognition becomes embedded in a company's culture, measurable results begin to emerge.
Our assignment was to create a new offering. Because this project involved building an internet-based performance recognition business from scratch, the One-Page Project Manager (OPPM) I used is more complicated than the typical one. Quite honestly, this is not an OPPM for the novice. If you've never created and used an OPPM, don't make this your first. It is better that you use a simpler OPPM for one or two projects before wading into the waters of using this tool for creating a new IT business. Alternatively, given that this book is written for IT professionals and given that the OPPM is substantially easier to use than other tools you are accustomed to—go for it!
The standard OPPM takes up the bottom half of the form. This is the template we have discussed throughout this book (and also in my first book, The One-Page Project Manager, Hoboken, NJ: Wiley, 2006). We discuss some unique variations applicable to IT projects at the end of this chapter.
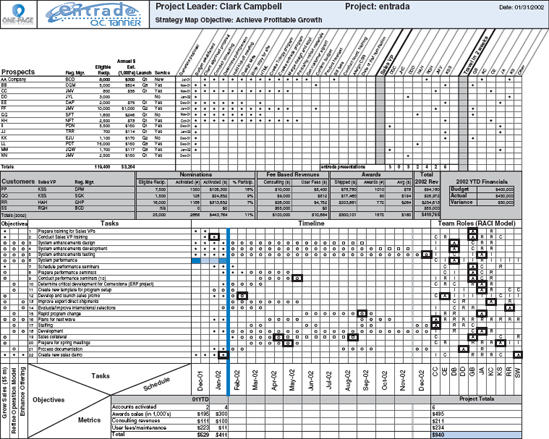
However, the upper half of the tool is unique to this project (Figure 5.1). You can see at the bottom left - hand corner that the subobjectives are to grow sales (the initial goal was $ 5 million), refine our operation (which meant having the operation and the underlying system work well), and enhance our offering (which meant adding system functionality, together with giving recipients more award choices).
Copyright O.C. Tanner 2008. To customize this document, download it to your hard drive from the following web site: www.onepageprojectmanager.com. The document can be opened, edited, and printed using Microsoft Excel or another popular spreadsheet application.
This form really addresses two issues: the launching and the running of a business.
I recommend you go to www.onepageprojectmanager.com, download this form, and print it using a color printer. You will find it easier to match the following explanations if you don't have to keep referring back to Figure 5.1, and the form will be larger and in color.
Near the bottom right of the form, you will see a group of columns each with the initials of the 10 people who made up our project team.
Rather than the real names, the initials are shown throughout these examples in order to protect confidentiality. Complete names of people and companies were clearly shown in the forms actually used.
The top half of the form has two main sections: Prospects and Customers. The activities in the top half of the OPPM were designed to take a prospect and migrate them into an ordering customer, and then take current customers and follow nominations, awards selected, and various components of services revenue.
Under Prospects in the upper left-hand corner of the tool, we list the Prospect, the O.C. Tanner Regional Manager who is handling the account, Eligible Recipients (the number of employees at the prospect who would be eligible to participate in this awards recognition program—this represents the size of our market at this particular prospect), Annual $ Est. (the estimated dollar amount of business the prospect may offer to O.C. Tanner), Launch (the quarter we expect to launch them as a new customer of recognition@work), and Service (whether they are currently a service award client). Note that at the bottom of Eligible Recip. and Annual $ Est. are totals. The first, under Eligible Recip., is the total number of eligible employees (our total market, in effect) if all of these prospects become customers. The other total, under Annual $ Est., is the total amount of potential business we could win if all of these prospects become customers.
In the section directly to the right of the one we just discussed, the first column is titled, Generate proposal. This refers to the date the proposal was given to the prospect. The remaining columns are pretty much self-explanatory, with a few exceptions. The column labeled HTML refers to whether we have written HTML software code for the client. Create Trilogy program is whether we have programmed the client into the Trilogy software program, which handles orders and pricing. The column labeled Assign CSR, refers to whether we have assigned a client service representative to the prospect.
The next section to the right, Sales Vice Presidents, identifies which of our sales vice presidents (they work in different geographic areas of the country) has been assigned to this prospect. The final section to the right, Travel in 2 weeks, identifies which team member will be traveling to the prospect within the next in two weeks.
The sections below the ones just discussed are shaded and labeled Customers. These are companies that were once prospects but have become current customers. The initials to the left identifies the customer and the sales vice president and Regional Manager responsible for that customer. As we discussed before, with the OPPM, we attach a name to the various tasks, which is a constant reminder and motivator. One of the powerful qualities of the OPPM is how clearly it spells out and aligns ownership—who owns and is responsible for what.
Let's first follow the development of a prospective client. Consider prospect EE going from left to right we see that the Regional Manager is DAP. There are 2000 eligible award recipients and potential award revenue of $75,000. They plan a first quarter launch and are a current service award customer. Continuing to the right, the proposal was generated on December 1. The seven dark circles correspond with the 18 tasks necessary to complete prior to becoming a customer and placing their first nomination. On the right, you note that KSS is the sales vice president in whose region this prospect resides and that JA will be traveling to visit with this prospect in the next two weeks.
Running along the bottom of the prospect section, you see that the pipeline of potential clients sums to 119,400 eligible recipients and $ 3.2 million in revenue.
The Entrada presentations line gives some indication of how aggressively each sales vice president is pushing this new business. KSS, with 6 presentations in his area, is significantly more successful than JHC at 0. Also you see with a glance at the top right where each of your team is traveling in the next two weeks.
Let's look at customer PP and follow its analysis across the OPPM. It is managed by Sales vice president KSS, and handled by Regional Manager DFM. This client has 7,500 employees eligible to receive a recognition award as seen in the column titled Eligible Recip. The next column, Activated (#), tells us the number of nominations (1,350) given or activated, which refers to the number of employees who have been nominated and approved for an award. The following column, Activated ($) shows how much revenue these awards total ($105,300) if they are all chosen and ordered. We include this number because, while these employees have been approved for awards, they haven't yet ordered their awards. For us, therefore, this is expected future revenue. The next column, Percent Participation, is the percentage of the total employees eligible who have been granted awards.
The following section, Fee Based Revenues, lists the consulting fees and user fees collected from this client so far—$ 10,000 in consulting and $ 5,400 in fees.
The Awards section provides information on the dollar amount of awards that have actually been ordered and shipped ($78,780), the number of awards shipped (1,010), and the average value of the awards (the first column divided by the second, which in the case of customer PP is $ 78). The next column, Total 2002 Rev, totals up all the revenue we received from this client in 2002. The total revenue we've received in 2002 from customer PP is $94,180. At the bottom of this column isthe sum of revenue, $410,765 we have received from all the new business.
The final section, 2002 YTD Financials, sums up the financials year-to-date, including the total cost of the project itself, which we here call Budget ($400,000). Next is how much we have actually spent of this budget, called Actual ($430,000), and the difference between what's been budgeted and what's been spent, Variance, which is $ 30,000 over budget.
Information we needed about the progress of the launch, such as conversion of prospects to customers, potential market, revenues generated and more, are spelled out in the top portion of the tool. This is much like a customer dashboard.
The bottom section is the customary OPPM template refined a little for IT projects.
You will note the usual objectives section has been condensed down into three subobjectives, and then aligned with each task. The schedule is for 13 months beginning with December 2001 and extending through December 2002. The reporting "buckets" are twice per month.
As in the standard template, each task is aligned with subobjectives, time line plan, time line performance, and owners.
Task #1, Prepare training for sales VPs, is shown complete. Task #3, System enhancement design, is on schedule; however, you will see four open boxes added to the end of the time line. This shows an extension to the time line beyond the original plan. Task #4 has also been extended. By focusing on the new open squares, your refined time line expectations are communicated. These tasks have been extended, with Task #19, Sales collateral, stretched out eight periods or four months. A bold outline around the time box indicates a major milestone. It is easy to spot the nine major milestones for this project. Each major milestone clearly shows its task, its owner, its completion date, and most important progress toward completion.
The major milestones for task #2 and #22 have been accomplished. One is coming due quickly with task #12, with others dotting the landscape of the project.
Experienced IT project managers will quickly see that the combinations of task extension for both design (task #3) and development (task #4) coupled with the approaching major milestones for completing testing raises quality concerns and some worries about the scheduled go-live for enhancements planned for year-end.
A note on the Stage-gate ® process and the OPPM: Using an OPPM for each stage (between each gate) is a powerful communication amplification of the product innovation process. The Stage-gate ® product innovations and launch process, pioneered and developed by Dr. Robert G. Cooper (see www.stagegate.com) was an important methodology underpinning the success of launching our Entrada business.
DuPont Chemical Company, my former employer, was an early adopter and successful user of Stage-gate ®. Most IT people reading this book are familiar, and possibly trained, on this project management road map for driving innovation from initial ideas to final product launch.
Simply said, the Stage-gate ® process divides the climbing of this massive and unknown mountain into distinct stages separated by management decision gates. Remembering Todd Skinner's comments about "getting on the wall," the Stage-gate ® process wraps a standard methodology around the innovative discovering—the "becoming" which occurs in the "doing."
The OPPMs used for each stage prior to launching the 1.0 version of Entrada are not shown here. Even product enhancements are greatly facilitated by stage-gating, as well as other project management tools like Microsoft Project ®. The five gates and five stages accompanied by a full Microsoft project plan are operating in the background while only a few tasks are shown on the OPPM.
As I've said, the OPPM does not replace these powerful and often-necessary project management tools—it complements and communicates.
Another common IT technique fits perfectly into the OPPM format—the RACI model. RACI is a relatively straightforward tool used in communicating roles and responsibilities of each project stake holder or team member.
As a reminder, RACI is an abbreviation for
| R = Responsible |
| A = Accountable |
| C = Consulted |
| I = Informed |
Responsible: This person is the doer, the one who does the work. There can be more than one R for each task. Start -to-Finish thinking is valuable here.
Accountable: This person is the owner, the one ultimately answerable for the task. There should only be one A for each task. A good project manager will aggressively delegate As and Rs. finish-to-start thinking helps here.
Consulted: This person is an advisor, typically a subject matter expert who should be consulted prior to actions or decisions. Visionary thinking is a critical element here.
Informed: This person should be made aware by being informed after the actions or decisions.
Referring back to our OPPM for the Entrada project, you see the 10 members of the project team shown in the lower right-hand corner of the form and the box above their initials showing their ownership and alignment to each task.
For IT projects, the RACI model replaces the simple A,B,C designations used in the standard template.
The team must do the construction and completion of their part of the OPPM. Thorough understanding and full agreement must be reached prior to presenting your completed OPPM to upper management for approval. Discussion of this section with upper management provides the perfect foundation for refining and clarifying your understanding of their expectations concerning you and your teams, accountability and responsibility coupled with management's desire for prior-consultation and postinformation.
Once your RACI box is complete, both a vertical and horizontal analysis can provide valuable insight and may even suggest source changes and refinements, which could involve every component of your OPPM.
I put a bold outline around the As to clearly communicate the ultimate owner.
Finally, the metrics section for this project is a chart showing financial progress: $529,000 in all of 2001 and $411,000 for the first two months of 2002—totaling $940,000 for the full project revenue-to-date.