
Chapter 7
Implementation Part 3
We've talked about motivation, adherence, and choice, now—the first three consumer challenges we identified as our criteria. The next couple sort of blur together: coordination and effectiveness of care. How might we improve the coordination of care among healthcare providers, and how might we increase the effectiveness of healthcare services?
What we learned from the blueprint exercise was that consumers want time with their providers, and not to be “herded like cattle,” as one interviewee said, and that doctors have information on them so that they don't feel like they're starting from scratch with each new doctor. Coordination and effectiveness are broad issues that mean various things and are large challenges to tackle. We could also argue that effectiveness would improve if coordination (and motivation, adherence, and choice) existed. But let's approach it in a more focused way.
Both coordination and the effectiveness of care could be enhanced by a lot of things we've already discussed: providers leveraging personal health clouds and self-generated data, using population health analytics to gain the 360-degree view, and using behavioral analytics to reach out more effectively to individuals. But the real issue is that patients are frustrated by the system—going from doctor to doctor without a single place for all their health information, having to fill out their history a hundred-and-one times, having very limited time with the provider, and much more. They're essentially noticing all the flaws of our data-sharing strategies and our volume-based system. Unfortunately, until policymakers and EHR companies figure out how to exchange data seamlessly and securely across multiple channels, consumers will have to deal with some of these frustrations. However, that's not the only way we can improve coordination and effectiveness, and luckily with changes emerging in the area of value-based care, there's a lot we can improve with the right tools to make the shift from volume to value a successful one.
Why Volume to Value?
Aside from the fact that the volume-based system creates dissatisfied consumers, another key factor in the shift is rising costs. Rising healthcare costs in the United States continue to be a critical issue and the fact that healthcare costs are unsustainably high and health outcomes are suboptimal raises concerns for all of us. Whether it's a provider trying to remain profitable while delivering the best patient care or a payer needing to manage services for new patient populations, the increasing costs and inadequate quality have affected everyone's financial and clinical decision making across the industry.
Healthcare decision makers and policymakers have attempted cost reduction and quality improvement techniques such as tackling fraud, waste, and abuse; reducing readmissions; and, most recently, extending coverage to millions of previously uninsured. While all of these small steps have typically generated positive change at different levels, they haven't created the systemic change necessary to drive value. In other words, achieving the best health outcomes per dollar spent hasn't materialized.
New incentives to create high value have begun to surface, such as accountable care and new reimbursements such as the Chronic Care Management Program. But while the recognition of value-based care has been established and embraced by some, how to achieve this ambiguous goal still remains a question. And rightly so—it's a big question. One on hand, providers want (and need) to remain profitable, payers have a business to run, and patients deserve the best care and don't want to be herded like cattle.
Addressing cost and quality effectively—often conflicting goals—is definitely a work in progress. And although some of the work requires a culture shift by organizations and individuals, a lot of it is going to rely on the right tools to enable consumer-centric, value-based care. So let's talk about some of the advanced analytics that can help healthcare organizations achieve this goal.
The Shifting Incentive and Its Adoption
For many consumers, it seems like providers are herding cattle because that's the way our system's structure has evolved. The healthcare system's performance incentives have historically been driven by the volume of services provided to patients and not the coordination of patient care, particularly when multiple providers are involved. As we talked about earlier, however, incentives are changing drastically, creating opportunities to gain a more consumer-centric focus on value. As commercial and government payers move away from a pay-for-volume system toward pay-for-value, financial risk is transferred to the provider(s) managing care. This changes incentives across the board for care and reimbursement, as providers now have to focus on better patient outcomes. It means that providers need to monitor the total path of care—for both cost and quality—and make necessary modifications such as treating patients holistically, reducing unwarranted admissions and readmissions, decreasing length of stays, improving cost-effective prescribing, and reducing variation in care. In other words, the implication for providers is achieving better patient outcomes using fewer resources.
The movement of transforming payment and delivery is still nascent but is moving rapidly. In fact, 75 percent of the providers that were surveyed in the 2013 Accountable Payment Survey expect to be engaged in a total cost of care (TCC) contract by 2017—a significant boost from the 35 percent that are currently under a TCC contract. Further, a March 2014 study by KPMG found that 44 percent of surveyed providers said they are “already working with bundled payments”—up from 38 percent in KPMG's October poll. Meanwhile, 20 percent said that they are not there yet but plan to be.1
Headway on the accountable care and shared-savings side has moved swiftly as well, despite mixed performance and results. The CMS Innovation Center's Pioneer ACO model, which launched in 2012, saw nine of 32 organizations exit the program after its first year, and nine of the remaining 23 organizations saved money, according to an independent audit.2 Similarly, Medicare's Shared Savings Program has experienced uneven progress. Some of the 114 enrolled organizations have failed to reduce health spending while others—such as Heartland Regional Medical Center, which was in 2014 awarded $2.9 million for its success in accountable care3—have fared better. After two years of the program, CMS announced that the program saved Medicare about $385 million during this period, and that consumers reported more timely care and better communication with their providers, and that they're using inpatient hospital services less and have more follow-up visits from their providers after hospital discharge—all great news.
Last but not least, commercial payers and providers aren't the only ones moving forward with value-based care: State governments and Medicaid are getting on board, too, through CMS State Innovation Model grants. Arkansas, for example, is making waves nationally with its Medicaid bundled payment initiative.

Balancing both goals of cost reduction and quality improvement is complex, and while financial incentives for high value are critical, it's important to safeguard against inadvertent consequences. For example, reducing readmissions without understanding the complete view of a patient's care and needs is ineffective and doesn't consider the patient experience or patient outcomes. In general, cost reduction without regard to the outcomes achieved is dangerous and self-defeating, leading to false “savings” and potentially limiting effective care,4 which leads to dissatisfied patients. That's why new payment and delivery models such as accountable care, patient-centered medical homes, bundled payments, and other shared-savings models require the right analysis tools to understand and measure value and outcomes.
While payers and providers are still investigating new methods for value-based care, perhaps the biggest challenge for these organizations, aside from cultural acceptance, is the lack of the right tools to understand patient data holistically. A 2014 survey by NAACOS found that learning to access and process data has been a significant challenge in ACOs achieving their goals. More specifically, ACOs have been challenged with finding suitable software and translating data into useful information for care managers and providers.5 Fortunately, new methods and tools have emerged that can drive the success of these new models.
Why Episode Analytics?
All healthcare organizations, from standalone practices to integrated delivery networks, have historically struggled with understanding how all of the moving parts of patient care work together, which is critical if trying to create a seamless patient experience. So to help understand and analyze the care that's being delivered, healthcare organizations are adopting new tools like episode analytics.
Typically known as a bundle of care, clinical episodes define all of the services that could be provided around a significant number of health events and conditions. Episode analytics is a more advanced method of looking at clinical episodes and has distinct advantages over the traditional methods, because it focuses on quality alongside cost. New analytic innovations in episodes of care identify total cost of care at the individual patient level, provide flexibility to payers and providers in defining clinical episodes, enable providers to identify variations in care and opportunities for improvement, and allow organizations to assess and predict their financial risk and savings in value-based reimbursement agreements (Figure 7.1).
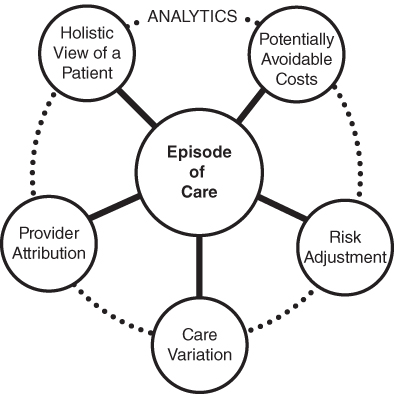
Figure 7.1 Using Analytics with Episodes of Care Creates New Opportunities for Innovation
Some of this may sound complicated or foreign right now, but it'll get simpler as we continue. You'll find that if we use analytics, we'll be able to approach value-based care more comprehensively, addressing the needs of consumers, providers, and payers, and ultimately creating more effective and more coordinated care.
Constructing an Episode of Care
An episode of care is defined as a series of temporally contiguous healthcare services related to the treatment of a given spell of illness or provided in response to a specific request by the patient or other relevant entity.6 In simpler terms, it's a collection of care provided to treat a particular condition for a given length of time. Episodes of care are the foundation for any assessment of efficiency and are necessary in determining if a delivery system is achieving its intended purpose. This is because it analyzes care over time, rather than at a single point, and offers a better assessment of the patient's resultant health status.7 Well-constructed episodes of care are instrumental to understanding and managing both cost and quality. They're also key to helping us understand the granularity of patient experiences.
What Constitutes an Episode of Care?
Episode construction is a complex, multistep process in which many clinical rules must work together to identify what constitutes an episode. We're not going to talk about clinical rules and individual episodes, but let me tell you about how an episode is constructed.
The construction of an episode is initiated by a trigger event, such as an inpatient hospital admission or a diagnosis, which signals that a patient has a condition or procedure taking place. Then, using a patient's claims data, all of the claims that are relevant to a particular episode are grouped together. This grouping is done with clinical rules that identify a defined time period to capture all of the events related to the episode. You can use predefined definitions, like ones created by CMS, or you can create your own.
While each episode of care has unique rules for associating relevant events, there are some standards that exist. For example, chronic conditions, once triggered, don't terminate (because they're chronic). Procedures, like a knee replacement, are triggered by the procedure itself and have a lookback and look-forward period. And acute medical events, like a heart attack, start with the event (typically a hospitalization) and then look forward 30 days post-discharge.
Let's use the example of John Doe's knee replacement to illustrate episode construction. In the illustration in Figure 7.2, we see a trigger in John's claims that lets us know that a knee replacement episode has begun. Subsequently, all of the events related to the knee replacement are grouped together. Identifying which events are relevant entails three time periods. First, there's the period leading up to the procedure, which can be referred to as the preoperative (pre-op) or lookback period. The lookback period for a knee replacement is 30 days, and for John's knee replacement this period may include events such as office visits, lab work, and some imaging. Then there's the procedure itself bounded by an inpatient or overnight stay. This includes the hospitalization and all professional services during the stay at the hospital. Finally, after John's discharged from the hospital, the postoperative (post-op) period begins, and it concludes when the patient has fully recovered and no longer needs treatment. For knee replacements, we look forward 90 days. In this stage of John's episode, there may be prescription medications, therapy, and more office visits.
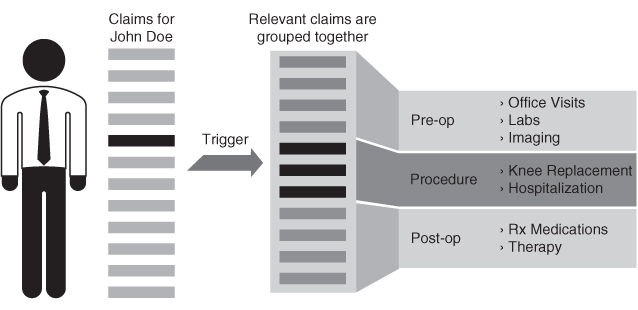
Figure 7.2 Constructing an Episode of Care with Claims Data
Calculating the Cost of an Episode
The next step after we create the episode is to calculate the cost of it, by identifying which costs get allocated to the bundle. Costs are broken up into categories: typical, potentially avoidable, and unrelated. All of John's aforementioned events, such as the labs, office visits, and therapy, can be clinically categorized as typical costs—because they're typical in treating a knee replacement. Within the group of claims, though, there may also be claims for other (atypical) events that weren't actually relevant to his knee replacement. In other words, John may have had other services that weren't expected. For example, John has pain and swelling, goes to the emergency room, and gets admitted and treated for a wound infection. These events are unexpected, and, clinically, infections are considered preventable with good clinical practice and follow-up care. So these events are included in the total cost, but are differentiated as potentially avoidable costs (PACs) since they could've been prevented.
Finally, during the time period of John's knee replacement episode, other services may have occurred, such as a primary care visit for a cold. These services might be related to a different episode may be other services unrelated to this procedure. These costs don't get assigned to the cost of the knee replacement and are simply identified as “unrelated” costs.
Patient and Population: Analyzing Costs and Outcomes
This method of constructing episodes and allocating costs lets us see the entirety of patient treatment as reflected in their claims data. Moreover, it provides an accurate measurement of total cost of care because costs measured at the condition or procedural level, not at the individual service level, is the most accurate way to measure them. And because value for the patient is created by providers' combined efforts over the full cycle of care, not just a single service, it structures patient data to allow us to track the entire experience of the patient. It's like a simpler version of an experience blueprint of a person's health condition/procedure.
Once episodes of care are created, we can analyze a variety of factors across a patient population and can create bundled payment models, measure the variation in care, and increase efficiencies among providers. For example, looking at the report in Figure 7.3, we can identify what clinical groups are represented in the patient population and how efficiently they're being treated.

Figure 7.3 Episode Summary Report
This report shows the total cost of treating a variety of episodes across a population. The top-left pie-chart shows total cost divided into the five classes of episodes—acute, procedural, chronic, system-related failures, and other. Meanwhile, the other two graphs display the total cost of each episode across the population and the collective, potentially avoidable costs for each episode. Another view of the total cost of conditions can be seen in the next report (Figure 7.4), where the costs are grouped by Major Diagnostic Category (MDC). Imagine you're a large hospital system with multiple facilities. With this information you can quickly determine across all of your facilities what departments and conditions have room for improvement. The bars in the graph show the costs that are potentially avoidable and are areas for improvement. The little dots indicate the how much of the total costs are PACs; the higher the dot, the more the PACs. So let's say you want to look at your musculoskeletal system and connective tissue conditions; you see that the highest number of PACs lie within osteoarthritis. If you were in an interactive report, you could drill down into this condition and find out what services the PACs are coming from, and from what providers. Then, you could do a variety of things for improvement, like finding best practices from providers who have the least amount of PACs, and creating department-wide quality initiatives. In this case, you might approach pain medicine departments that treat osteoarthritis.

Figure 7.4 Episode Report Showing Total Cost by Condition
With the distinct visualizations we can easily see the episodes that contribute to the highest costs, as well those conditions that present the most potentially avoidable costs. In this particular example, it's evident that there are several million dollars of PACs in many of these episodes, with chronic conditions like diabetes and hypertension having some of the greatest amounts. Using this information, providers and payers can easily detect which patient populations are being treated and, based on the ratio of PAC to total cost, how efficiently they're being treated.
Going back to our osteoarthritis example, the next report (Figure 7.5) shows us the different services that are provided for osteoarthritic patients, how much they cost, including PACs, and how much variation there is for each service cost. At the bottom right, we can also see the providers who have the highest PACs. This tells us exactly where to focus on bringing costs down. But more important, if PACs are high, it's likely that the quality of care and the patient experience are affected. It's a way to initiate improvements all around.
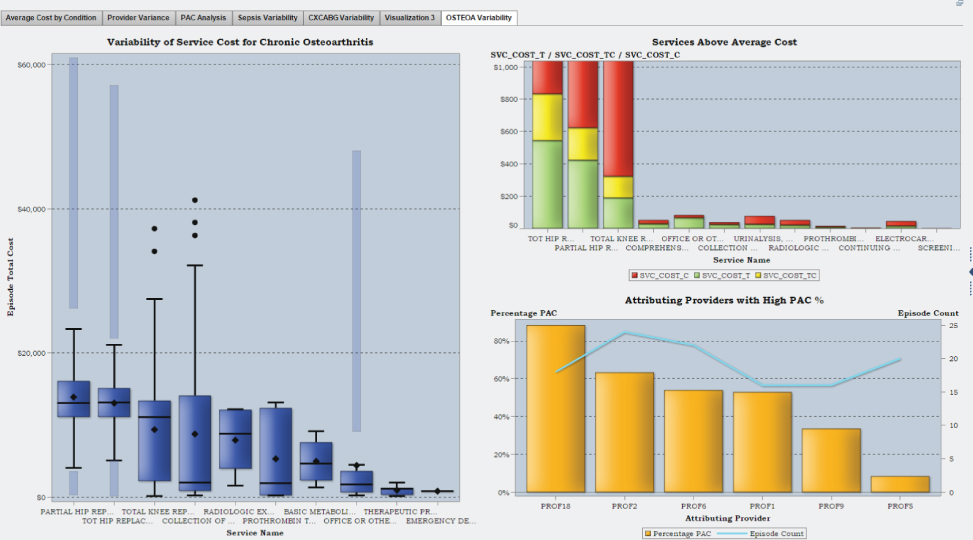
Figure 7.5 Details of Services for Chronic Osteoarthritis
The Holistic View of a Patient
As you can imagine, a single patient may have many episodes taking place concurrently or in series. In fact this is common, and a reason that patients get frustrated when their providers aren't treating and coordinating all of their health issues collectively. For example, John may have a continuous diabetes episode in addition to his knee replacement. The previous reports show how we're treating individual episodes, but to analyze how we're treating individual patients, we need a holistic view of the patient, which is gained through associating episodes to each other based on distinct, clinical relationships.
A relationship between two episodes is called an association. In an association, two related conditions with overlapping episode time periods coexist, with one episode being subsidiary to the other. Associations are important because they allow us to see all of the services related to an individual's healthcare over a period of time.
Provider Performance
As discussed earlier, potentially avoidable costs (PACs) are those costs that were unexpected during an episode and can possibly be prevented. Because efficiency and effectiveness are key goals for new value-based models, reducing preventable events and costs are critical.
The report in Figure 7.6 shows an analysis of PACs for various procedures at the individual provider level, such as a knee replacement. If we analyzed these costs further at the individual claim line, we'd be able to learn the reasons behind these numbers, helping us to shape care coordination and cost containment efforts. Knowing what the main complications are among a group of providers can help shape both care coordination efforts and cost containment efforts.

Figure 7.6 Provider Comparison Report
This also allows us to examine the performance of providers, which is another critical piece to value-based payment models, specifically bundled payments. In order for a provider to confidently participate in a bundled payment contract, it needs to have some level of confidence in its performance. Figure 7.6 is a useful report for analyzing performance. This report is similar to the osteoarthritis reports we looked at earlier, however, it compares providers against costs for procedures versus conditions—in this case knee replacement and knee revision.
Finally, in Figure 7.7 we can see the variation in both total cost and PACs and quickly identify the outliers. With this information, a payer or provider would be able to better decide on whom to contract with for bundled payments. Additionally, with accuracy in provider attribution, accountable care and patient-centered medical homes can easily recognize the owning or conducting providers of the episode.

Figure 7.7 Provider Episode Details by Procedure
Using episode analytics to enable value-based payment strategy, operations, and improvement is a big step forward for healthcare. It helps us address both cost and quality and lets us see the connection between the two. For patients, it means that providers will have a better, more complete approach to their health with a focus on achieving quality and improving the total experience. It also means that providers will have a means to coordinate with other providers, making new models like accountable care organizations more valuable and effective to consumers. While the road to value-based healthcare is a long one and is going to require the ideas and collaboration of lots of stakeholders, the right tools can help us gain the consumer-centric focus that we need. Episode is a critical piece to this transformation.
Diagnosis and Personalization
Our final two criteria that we identified in Chapter 2 were diagnosis and personalization, and we saw both of these appear in Dennis's healthcare experience. Think back to his experience. Remember how it took several years for Dennis to get the right diagnosis for his condition? He spent time, money, and effort visiting multiple doctors, trying different medications, and basically going through a three-year rollercoaster ride to find out what was wrong with him. Unfortunately, this story isn't uncommon—whether it's a diagnosis that takes too long to make, a diagnosis that was never made, resulting in a worse condition or another condition, or even a prescribed medication that just wasn't the right fit for a person. As I've been discussing throughout the book, perhaps the whole goal of health analytics is that we get to a point where treatments are personalized for the individual. Every other industry is there, and healthcare, too, needs a higher level of personalization.
How might we increase the accuracy and timeliness of medical diagnostics and how might we create more personalization of care?
Enter machine learning. Machine learning has the potential to create that personalization by dramatically improving medical diagnostics and treatments. Recall that machine learning uses algorithms that iteratively learn from data and allow computers to find hidden insights without being programmed where to look. It learns from using more data, and what it provides is something called artificial intelligence (AI). It's basically smart computers creating smart answers. One of the driving forces in the machine learning and AI revolution is something called deep learning algorithms. This approach allows us to process information from nontraditional, unstructured sources like videos, images, and sounds. Deep learning algorithms are going to transform everything. Companies like Google and Facebook are already investing in this technology, and new inventions like real-time language translation and self-driving cars are already being created with machine learning. For example, using lots and lots of data on things like traffic-light patterns, speed limits, turns, distance from curbs, distance between cars, and more, the Google self-driving car is able to figure out what to do in different situations without a human. It's not a stretch to say that we'll soon be seeing self-driving cars on the road. And in healthcare, machine learning and artificial intelligence could be equally radical.
Machine Learning and AI
We've talked about some of the applications of machine learning. For instance, automatically predicting health events and creating automated alerts and reminders for individuals are both applications of machine learning. One hospital in Dallas is already doing some of these things. They've actually been able to manage up to 70,000 children with asthma with just 70 resources using machine learning. By combining data about where patients live with environmental data from services such as weather.com and pollen.com, a cognitive system can spot correlations between the ragweed concentration in the air and asthma, and then send information or inhalers directly to children in areas where there's likely to be an uptick in asthma attacks. Without any human intervention, computers can provide individuals with accurate, usable information that could potentially save lives.
Soon, we'll see machine learning and AI become so much more groundbreaking in healthcare. Think about the billions (trillions, gazillions) of data points that could potentially be gathered with all of the data sources we've talked about—claims, EHRs, labs, imaging, mobile health, social media, and even genome data. Machine learning could be so powerful that it would find patterns in all of this unimaginable data, and by using an individual's genomic structure, tell us what treatment would work best for that person. For example, two women, both with the same type of lung cancer, may have entirely different treatment needs. One may be an active athlete while the other is overweight and leads a sedentary life. One may be diabetic while the other has no chronic conditions. One may be in her late fifties while the other just turned 40. All of these differences could mean different treatments, but finding treatments for specific types of people at such a granular level is nearly impossible for doctors and scientists. Critical information is lost in the mountains of data and it would take years to sort through all of the data to find the correlations and clues between all of these data points. As big data gets bigger and bigger in healthcare, it'll only become more of a challenge, becoming humanly impossible to use this data effectively.
That's why machine learning is so exciting for diagnosing and treating conditions. Eric Xing, a professor in the machine learning department at Carnegie Mellon, explains, “Every patient is different. You can take a very simplistic view. Say, breast cancer should be treated by drug A or B. But uniqueness in lifestyle, environment, and other health factors makes someone a unique individual. AI might take information from not just one doctor but many doctors' experiences and it can pull out information from different patients that share similarities.” Scientists at Carnegie Mellon University and the University of Pittsburgh are already working on using artificial intelligence to filter through electronic health records, diagnostic imaging, prescriptions, genomic profiles, insurance records, and even data from wearable devices, to create healthcare plans designed not just for a specific disease but for specific types of people. The researchers are hoping to be able to create designer treatments, head off epidemics, and find cures to deadly diseases.
Machine learning could be the Holy Grail in curing some of the most deadly diseases. Eric Topol, author of the book The Patient Will See You Now (Basic Books), thinks that we're in for some radical improvements in preventing conditions and diseases that have attack characteristics like heart attacks, strokes, seizures, asthma, and autoimmune diseases. He says that using omic (genome, proteome, or metabolome) tools like DNA sequencing or RNA tags, we'll be able to identify individuals at high risk for certain diseases. Also, wearable or embedded biosensors could be used to continuously monitor individuals well before signs, tissue destruction, or a clinical crisis develops. This will involve contextual computing and deep/machine learning. Topol believes that in the years ahead it should be feasible and increasingly practical to track large cohorts of people with conditions of interest. And as a result of tracking these large cohorts, that one or more of these conditions will actually become preventable in the next 20 years.
Preventing heart attacks and strokes sounds preposterous in some ways: it's predictive analytics on a whole new, unimaginable level, giving us so much precision of information that it seems a little unreal. But it is in fact real, and it's coming.
Natural Language Processing
In the next decade we could even see our phones or other gadgets diagnosing our conditions for us. With natural language processing (NLP), which uses machine learning to understand human speech, we could see services like a Siri for healthcare, using machine learning to translate everyday words into diagnoses. Imagine what this could do for the accessibility to healthcare. Companies like Skype, are in fact, already experimenting with real-time language translations; advancements like these could potentially diminish language barriers to care.
One day, NPL could become so accurate that it could capture individual sentiments as well. Actually, NPL is already so advanced that it can capture subtleties, nuances, and idioms in our language. What if, instead of waiting for your doctor's appointment, you told your phone the details of how you're feeling, and it took that information, along with all the other data from your personal health cloud, to provide you a diagnosis and treatment plan all in a matter of seconds? Or what if you voiced your health goals to a device and it knew you so well that it gave you the perfect combination of nudges and alerts to meet your target? What do you think all of this would do to the role of the physician? What do you think it would do to the role of the consumer? Nobody really knows, but one thing's for sure—machine learning will have a dramatic role in healthcare.
While some of this seems farfetched, it's actually closer to us than it seems and people are already working on these advancements. One start-up company, Enlitic, is focusing on making medical diagnostics faster, more accurate, and more accessible. They're creating tools for providers to leverage deep learning methods that would allow physicians to use the vast amount of data, like medical images (x-rays, MRIs, CT scans, 3D medical images), doctors' notes, and structured lab tests, to help them diagnose patients. Jeremy Howard, CEO and founder of Enlitic, believes that medical diagnosis at its heart is a data problem, and that turning all of this data into a diagnosis and a proposed intervention is the biggest opportunity for positive impact using data that he's seen in his 20+ years in the data science field.
Another company, Lumiata, is doing similar and equally inventive work with something called graph analysis, through which it can connect all the pieces of data that physicians see about patients on a daily basis, along with all the knowledge that they've acquired over the years. It's a big data system that's gathered more than 160 million data points from textbooks, journal articles, public datasets, and other places in order to build graph representations of how illnesses and patients are connected. The technical term for what Lumiata does is multidimensional probability distribution, but as Ash Damle, CEO of the company, explains, it basically boils down to understanding how time, location, and behavior come together to affect how a disease develops and progresses. The technology analyzes graphs containing tens of thousands of nodes (e.g., symptoms, diseases, and patient data points) and weighted edges (e.g., the connections between them all and how strong they are) in well under a second. That's one second. That means it can be used for real-time care, making analytics at the point-of-care possible for medical providers.
Damle gives the example of symptoms such as pneumonia and confusion to explain Lumiata. He says these symptoms are fairly common in younger patients and older patients, but not really for patients in between those ages. A graph analysis might help a nurse or a doctor find something abnormal within these age groups in between, and then instruct him or her on potential follow-up questions. Because various weak signals build up over time, it's important to see what may have been missed because all the little things could amount to something significant.
Enlitic and Lumiata are definitely doing some neat things with machine learning and AI, and there's still so much more to be done. My colleague, Dr. Mark Wolff, often talks about using these same tools to gain even more details of diagnoses, which consider things like the levels of severity. For example, if a patient is diagnosed with a certain condition, what's the severity of his or her condition? And how does the severity impact the treatment? We don't always know how severity correlates to various treatments, and having this type of information would let us make choices on medications and treatment plans, allowing us to understand if an individual is right for a certain drug, for instance. Subsequently, it'd also help with pharmaceutical and clinical research in developing drugs that are suitable for certain levels of severity of particular conditions. This impact could be huge, as so many millions of people are taking medications each day that aren't helping them. In fact, the top-10 highest-grossing drugs in the United States help only between 1 in 25 and 1 in 4 of the people who take them. For some drugs, such as statins, as few as one out of 50 people may benefit. There are even drugs that are harmful to certain ethnic groups because of the bias toward white Western participants in classical clinical trials. That's why President Obama announced a national Precision Medicine Initiative in 2015 that focuses on using the variability in genes, environment, and lifestyle for each person to create more effective and personalized drugs and treatments. Tools like machine learning and AI are going to be instrumental in implementing precision medicine and in making genetic diagnoses possible through learning about new disease genes. Not only will they allow us to find very personalized treatments and interventions, but they'll also help the system to reduce its spend on both drug development and prescription drugs.
Even though the concept of machine learning isn't new, the growth in the areas of machine learning and artificial intelligence is really just beginning to take shape in healthcare. It's definitely one of the areas that excites me the most and one that I think is going to be a game changer for our industry.