Chapter 6
Trend Following as a Portfolio Protection Strategy
“If you want to make a million you don't have to understand money, what you have to understand is people's fears about money.”
-William Gaddis, JR
In this chapter, we discuss how trend following can be used as a risk mitigation device after a market drop. It offers a potential alternative to long options strategies, particularly when the cost of insurance (i.e. implied volatility) is already high. We describe what the catch-all phrase “trend following” means, both in practical and philosophical terms. We study momentum from a variety of perspectives, calculating correlations with volatility indices and pushing the analogy with insurance as far as we can. Our conclusions will not be definitive, but will give some insight into the complex relationship between momentum and portfolio protection. Ultimately, we argue that trend following is a moderately reliable form of statistical insurance. There is no guarantee that your trend following system will be up during a rapid sell-off. However, trend following is structurally diversifying, with a high probability of strong performance during sustained bear markets.
Trend following benefits from price volatility when the signal to noise ratio is high. A market that shoots off in one direction or another, without too much choppiness en route, is ideal. Conversely, volatile range-bound markets are just about the worst environment for a trend follower. A system is likely to get “topped and tailed”, repeatedly having to exit positions at a loss as the market keeps changing direction. Since high volatility typically corresponds to market liquidations, there are more likely to be large-scale directional moves in risk off regimes. An investor who wants to use trend following as insurance is relying upon this stylised fact.
WHAT IS TREND FOLLOWING?
Imagine you were given some money to invest, but didn't have any idea about what to do with it. Value investing, i.e. attempting to buy underpriced securities over time, was not in your wheel house. Graham (1999) had never found its way onto your desk. Broadly, you had no conception of how much a given asset might be worth. What could you reasonably do other than stick your finger in the air? Following price trends might be a start. You could always follow the herd, with an exit strategy if the trend reversed. If an asset went up enough, you would buy it. If it sold off enough, you would sell it. You would simply invest in the direction that was being confirmed by the market.
Many seasoned investors have started with such an approach, drifted into other areas as they “learned” more about how markets operate and finally returned when they found that following trends was just about the most effective thing they could do. One advantage of trend following is that it purely relies upon market prices and to a lesser extent, volumes. The system is self-contained, as you make the limiting assumption that all relevant information is contained in the price action of a given market. Once you start to incorporate economic releases, news and so on, the problem of investing becomes open-ended. You never know whether you have missed something vital. To be fair, trend following is not the only strategy that restricts itself to price inputs. Other technical trading strategies fall into the somewhat amorphous category called “statistical arbitrage”. They might trade mean reversion in spreads or identify more complicated exploitable patterns in price data.
However, trend following does offer one advantage over other pattern recognition techniques. The trend following signal indirectly helps to manage risk. In particular, the signal forces you to reduce if not eliminate exposure as a trend breaks. In the absence of an outsized intra-day price jump, cumulative losses from a losing position are unlikely to get too large. While pure trend following might not offer very high risk-adjusted returns, it allows you to stay in the game while you wait for a large-scale directional move in one of the markets you trade. It is widely known that longer-term trend followers usually make the bulk of their returns in 4 or 5 markets each year. Another advantage of trend following is capacity. Some of the strategies presented earlier in this book are not scalable enough for large institutional investors. Weekly options are particularly constrained in terms of maximum trading volumes. Long-term trend following has no such limitations. The largest trend followers comfortably manage more than $100 billion total of gross notional exposure. Note that the notional exposure of a fund can dramatically exceed the amount of equity in the fund. It's only necessary to post a small amount of cash into a margin account to finance a relatively large position. For funds of this size, there may be some price impact at execution time. However, the impact can be minimised under “normal” market conditions by clever trade execution.
A pure trend follower is committed to following a sell-off all the way down. There is no question of taking some profits on a short position (say) and finding a higher re-entry point at a later time. This mentality is colourfully captured by Edwin Lefèvre in Reminiscences of a Stock Operator1 (1923). The book was written nearly a century ago, but continues to be relevant today. In the book, Mr. Partridge, also known as “Old Turkey” for the way he would stick his chest out while pacing the office, was a successful trader and a dyed-in-the-wool trend follower. As the story goes, he would never fade the prevailing trend. Rather, he would hold on to winning trades indefinitely, so long as they were broadly moving in the right direction. One day, a colleague offered a humble suggestion: Perhaps Old Turkey should consider trading around a trending long position, selling strength every now and then, with the hope of buying back the position at a lower price later. If the trend followed a rough path, with frequent reversals, the total profit in the trade would increase.
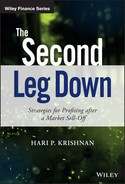
Several well-known macro hedge funds follow this principle today. They meticulously develop investment ideas, but make a point of waiting for market confirmation before entering a trade. Once in, they are willing to maintain a position well beyond what might be considered “fair value”, relying on glacial repositioning within a market. In mid-2014, who would have imagined that oil would trade below $40 a barrel? There was a near universal belief that producers would stop pumping oil below $60 or so. If oil plunged any further, oil production and delivery would be a loss-making enterprise. Yet, here is the spot price chart for WTI (West Texas Intermediate) oil. We refer to Figure 6.1 below.
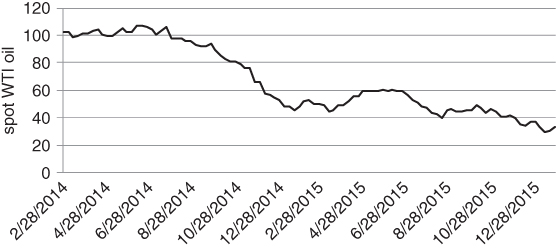
Figure 6.1 Trends can persist longer than one might expect
In Schwager (1992), Stanley Druckenmiller was asked about George Soros's style of trading. He claimed that Soros had the psychological ability to stick with and even increase winning positions, concluding with the comment that “it takes courage to be a pig”. Trend following systems automatically behave in this way. Rather than taking profits quickly and letting their losses run (which arbitrarily transforms losing trades into long-term positions), they chase winning directional moves. The pig-headedness encoded in a trend following system can be very reassuring to a client who needs portfolio protection. So long as risk assets decline in a steady enough fashion, the client knows that the trend follower will stay short. A downside hedge will always be in place. In this way, trend following complements some of the options strategies we presented in Chapters 4 and 5. Recall that we rotate from puts, to put spreads, to broken flies as implied volatility increases and the put skew steepens. While these hedges are well-adapted to the prevailing market regime, they become progressively less potent as risk conditions deteriorate. Put spreads and butterflies do not protect you all the way down. To a large extent, we have addressed this issue by incorporating VIX and weekly options into our overall hedging strategy. Trend following provides another mechanism for protecting against vicious sell-offs when volatility is already high.
TREND FOLLOWING DOGMA
Strict trend followers can sometimes be a belligerent lot. In the late 1990s, the technical support staff of a well-known trend following website would get irate if you asked them a question about their data.
You might send a seemingly innocuous question such as, “How do you adjust for the roll in commodity futures contracts?” They would send this sort of response, “It doesn't matter, markets trend. Stop asking us irrelevant questions.” An answer in the spirit of Mark Twain (1883) would have been preferable. “I was gratified to be able to answer promptly. I said, ‘I don't know’.”
And so it goes. There's no room for debate with certain hardliners. However, if we are to take a pragmatic approach to investing, we need to investigate further. In the example above, it's vital to choose the correct scheme for interpolating across contracts. You need the interpolation scheme to match the trading strategy you actually plan to use. By “interpolating”, we mean constructing a continuous price series from a string of futures contracts with different maturities. Suppose you naively take the raw prices of the front month contract, making no adjustment for roll. Then, your trend follower will not be taking into account the total return of a rolling futures strategy and your long-term systems may point in the wrong direction. For natural gas (which has historically traded in severe contango), you would lose the natural short bias that arises from the persistently negative roll yield arising from the futures term structure.
Strategies that have relatively low win/loss ratios with high payouts tend to be associated with dogmatic managers. They have a tendency to be pamphleteers, publishing long articles about the virtues of their strategy when things are not working out. This is understandable, given that a trend following strategy can become mired in a long drawdown every now and then. It's to be expected that a long term trend follower running at 15% volatility will have a 30% drawdown if it survives 10 years. Trend followers steel themselves for the task with their articles. It may be that this is psychologically necessary, as the average investor in hedge funds tends to crave steady returns.
One idea that often gets bandied about is that trend following provides a form of portfolio insurance. Some studies, notably Fung and Hsieh (2001), suggest that the returns of a momentum strategy have “option-like” characteristics. This is an intriguing concept, implying that trend following may provide a floor on losses in a client's core portfolio. However, as we shall soon see, the analogy between trend following and a long options position is a very loose one.
THE CRISIS ALPHA DEBATE
Many institutions allocate to trend following strategies, on the assumption that they perform well in adverse market conditions. Trend followers had a banner year in 2008, with strong performance in the eye of the storm. The Barclay CTA index, which has a reasonably large weight in trend following strategies, posted a +3.45% return in October 2008. Pure trend followers generally returned closer to +10% for the month. More generally, trend followers have performed relatively well at times when equities and other hedge funds have fared the worst. In Figure 6.2, we have tabulated the performance of CTAs during the worst 10 months for the S&P 500, from January 1980 to April 2016.
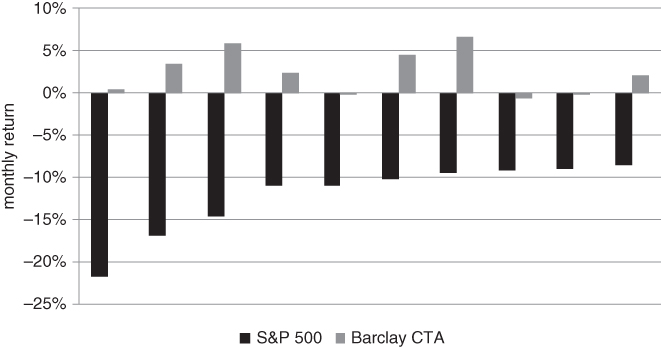
Figure 6.2 Historically, CTAs have performed admirably during S&P 500 draw downs
In 7 of the 10 months, the CTA index recorded a positive return. Moreover, the positive returns were generally much larger than the negative ones. This suggests that CTA returns have typically been positively skewed whenever equities sold off severely.
Recently, several academics and practitioners have introduced the term “crisis alpha” to describe trend following strategies. Fancy phrases abound in finance (don't get the author started about the marketing industry) and it's best to be wary of them before investigating further. Even Old Turkey was acutely aware of the connection between trend following and risk management. To some extent, this is simply the rebranding of a strategy that has been around for a long time. However, crisis alpha does turn out to be a succinct description for a strategy that has a larger than usual expected return during extreme market conditions.
Based on the historical evidence, trend followers have been an excellent diversifier in the past. The graph below demonstrates the impact of adding trend following to a long equity portfolio. We have used the S&P 500 and Barclay CTA indices as proxies for equities and a trend following futures strategy, respectively. Our data set reaches back to 1999. While CTA indices include strategies other than trend following, managers who have been around for a while (and are thus eligible to appear in the index) tend to focus on trends. Hence, broad CTA indices are reasonable proxies for trend following. The volatility of each index and the correlation between them has been calculated using historical returns, at monthly intervals. Since alternative indices suffer from a variety of biases, we have made an optimistic assumption about the return potential of equities and a punitive one about the expected return of trend following. This is intended to level the playing field a bit. In particular, equities are assumed to have an expected return that is 5% above the risk-free rate, while trend followers offer 0 excess return. Under these assumptions, an allocation of roughly 22% to CTAs maximises the Sharpe ratio of an equity/CTA portfolio. We have sketched the Sharpe ratio for a range of CTA weights in Figure 6.3.
Figure 6.3 A significant allocation to CTAs is justified by a naive portfolio optimiser
In principle, crisis alpha strategies offer a modestly positive return in quiet markets and a punchy positive return during market downturns. Greyserman (2014) has characterised trend following return patterns in terms of a “CTA smile”. The idea is to collate monthly returns for a generic trend following system and a benchmark equity index over different time periods. The equity returns are sorted in quintiles and the average trend following return in each quintile is taken. We have used the Barclay CTA index to create our own homespun CTA smile in Figure 6.4.
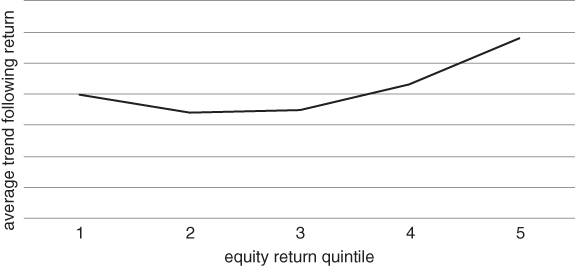
Figure 6.4 Trend followers tend to outperform when equity index returns are significantly higher or lower than normal
We can see that the single lowest and highest two quintiles deliver particularly strong historical performance. The logical conclusion is that trend followers tend to outperform when equities are either rising or falling strongly. The “payout” of CTAs has historically been convex (i.e. resembled a smile), with relative underperformance when equity returns are flat. Their approach may have been inspired by Fung and Hsieh (2001), who suggested that trend following returns are qualitatively similar to the returns generated by a lookback straddle. Note that a lookback straddle pays the difference between the highest and lowest values reached by the spot during the life of the option. It is a path dependent variation of the plain vanilla straddle we described in Chapter 3. Fung and Hsieh's paper has been widely cited by the managed futures community. While the analogy is intuitively appealing, we will see later in the chapter that it should not be interpreted too literally.
In an asset allocation context, a true crisis alpha strategy can have an enormous impact on performance. If it does what it says on the tin, crisis alpha can reduce marginal risk with virtually no drag on portfolio returns. Cole (2013) has played an important role in broadening the concept of crisis alpha to long volatility strategies.2 His intricate and entertaining papers and presentations are well worth reading. In this section, however, we restrict ourselves to the issue of trend following as a crisis alpha strategy.
Trend following is clearly a market timing strategy, in contrast to traditional value strategies such as distressed bond investing. You don't need to “buy low” (i.e. below some notion of fundamental value) and “sell high”. It's sufficient to wait for a trend, buy high and sell higher. The success of a trend following strategy is directly dependent on entry and exit points. This makes it difficult to measure alpha as a static quantity. Trend following doesn't make money by investing in the right securities, but rather by moving in and out of markets at the right times.
Measuring the alpha of market timing strategies has been explored in the literature by Henriksson (1984) and others. The Henriksson–Merton model focuses on measuring the market timing skill of a long-only manager relative to a benchmark, so the application is slightly different. However, the idea is to run a 2-factor regression of a fund's returns against the returns of its benchmark and the returns of a 0 premium put on the benchmark. If there is a positive loading to the put (i.e. if the regression coefficient is positive), the manager might be adding value through market timing, as he or she knows when to reduce exposure. The crisis alpha approach, however, takes things a step further. It doesn't run a regression against all returns, but rather focuses on the quality of returns when they are needed the most. In this sense, it rewards investors who take a regime-based approach to asset allocation. We are on the lookout for strategies that can perform well during “risk off” phases of the market. When the rest of your portfolio is collapsing, you are grateful for any source of positive return.
We can also think about crisis alpha in terms of regime-specific performance. Malek (2009) has created a risk index that allows them to see how various hedge fund strategies perform in different market regimes. It's closely related to our “international bar code” index in Figure 4.43. Contrary to popular claims, hedge funds don't really hedge all that much, at least in terms of exposure to systematic risk. Many hedge funds, especially those in the arbitrage or relative value category, advertise themselves as “market neutral”. They go long and short related assets, in an attempt to reduce directional risk. Many claim that they can generate a positive return in all regimes, given that they are initially delta-neutral.
Judging from past returns, this claim is an optimistic one. Malek observed that most strategies performed dramatically worse in risk off regimes. The “risk off” underperformers included relative value hedge funds and convertible arbitrage, which had been advertised as a long volatility strategy. Market neutral equities that focused on buying “value” stocks also had a negative loading to volatility. The trouble is that value stocks can experience very long periods of underperformance during economic slowdowns. They become “unloved” as investors scramble for stocks that exhibit some form of price stability. Other than dedicated short-selling, which accounts for a tiny percentage of total hedge fund assets, trend following CTAs were the only category that outperformed when the market was “risk off”.
Let's up the ante a bit. If trend following was guaranteed to provide significant protection after a market sell-off, most of the chapters in this book would be irrelevant. You would be able to hedge without paying an option premium after volatility had spiked. The reality is that trend following is a genuine diversifier, but does not hedge exposure to individual markets or systemic risk. Correlations across asset classes change over time and it may well turn out that stocks and bonds move down together in the next crisis. In this scenario, trend followers will not take a stubborn long position in sovereign bonds and should be well positioned relative to risk budgeting strategies. Eventually, they will be on the right side of a sustained move in equities, bonds or currencies. These results also point to the “crisis alpha” effect described above. When you allocate to a trend following fund, however, you are not long extreme event risk. The classic references comparing trend following to a long options strategy should not be interpreted too literally. Even if volatility increases, performance is very path-dependent. If a market makes a large move but is very choppy along the way, there is no guarantee that a trend follower will make money. The signal to noise ratio might be too low for a manager to stay in the trend. To some extent, it may even be accidental that trend followers have done so well in recent flight to quality environments. We review the recent literature and conduct experiments using a simplified trend following strategy. Our results are not conclusive, but imply that short-term trend following systems may provide more protection against a volatility spike in the future. During risk aversion periods, they are a valuable adjunct to options hedging strategies.
AN ASIDE: DIVERSIFYING ACROSS TIME
Trend followers have made an important contribution to asset allocation practice that rarely appears in the literature. They have focused on the idea of diversifying across time, something that Markowitz theory would not even consider. While this is not a central issue in our attempt to decide whether trend following acts as insurance, it is worthy of discussion. One of the goals in this book is to introduce the reader to alternative yet important ways of thinking about risk.
Standard risk models focus on diversifying across assets. At any given time, you take a snapshot of your portfolio. All risk calculations are based on the snapshot. It doesn't matter how or when the assets got into your portfolio. How your portfolio is likely to look in the future is a trivial detail, as you can dynamically recalculate portfolio risk over time. Risk is encoded in the covariance structure of the assets in your portfolio at that instant. However, this approach breaks down when one thinks of allocating to strategies, rather than assets. Many strategies will reallocate predictably as market conditions change. The beleaguered fund of hedge funds industry has had to deal with this issue for many years. Time diversification is a difficult problem that has traditionally been beyond the capability of a run-of-the-mill fund of funds. Yet, it is vital. If you can't rebalance your allocation very often, instantaneous risk measurements don't do you much good. You are better off knowing the qualitative properties of each strategy you invest in.
Managed futures and multi-strategy hedge funds have been far ahead of the curve in dealing with this issue. The problem is cleaner when you allocate to various sub-strategies that you have designed yourself. You might, for example, have several different models that trade US Treasury futures. Each system can go long and short and generates a series of returns over time. The individual series will differ, even though each system is only trading the Bund. To an outside observer, who has no idea what each strategy is up to, it might seem as though each return series corresponds to a static position in a different asset. The various systems will have a covariance structure and we can apply Markowitz theory to them as though they were individual assets. In Figure 6.5, we show that the pairwise correlations between different moving average crossover (MAC) systems decline as the lengths of the lookback windows move further apart. This creates a diversification effect.
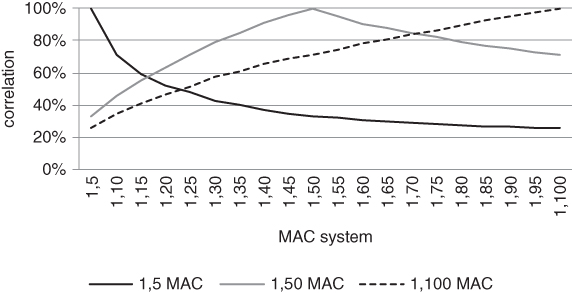
Figure 6.5 Systems with different lookback windows and expected holding periods are diversifying
Each MAC system above has the form ![]() , where n ranges from 5 to 100 trading days, and is always in the market. If today's price (i.e. the 1-day trailing average price) is higher than the average price over the previous n days, the system will be long going into the next day. Otherwise, the system is short. By construction, each system is always in the market.
, where n ranges from 5 to 100 trading days, and is always in the market. If today's price (i.e. the 1-day trailing average price) is higher than the average price over the previous n days, the system will be long going into the next day. Otherwise, the system is short. By construction, each system is always in the market.
We have applied the MAC signal to 3 markets: US 10-year futures, S&P 500 futures and the spot US dollar index, using daily data from 1996 to early 2016. In each market, we have measured the correlation of a short-term (1,5), medium-term (1,50) and long-term (1,100) system to all of the other systems. We then averaged the correlation graphs across the 3 contracts. It can be seen from the graph that each system has 100% correlation to itself. This obviously should be the case. More interestingly, as the lookback windows move further apart, the correlation between any two systems decreases. Finally, we observe that the (1,50) MAC system bears a closer relationship to the (1,100) system than the (1,5) one. This implies that more diversification can be achieved by lumping together nearby short-term systems than nearby long-term ones.
It is worth noting that the average holding period increases with the length of the lookback window. The probability of flipping from long to short or vice versa ranges from roughly 25% for MAC (1,5) to about 5% for (1,100), with a decay rate proportional to 1/sqrt(n). This suggests that snapshot risk estimates are reasonable for long-term trend following systems, but may be wildly inaccurate for shorter-term MACs. The conclusion is that we need to understand the dynamics of a trading strategy before we can estimate its marginal contribution to the risk in a portfolio.
TAKING ADVANTAGE OF A CORRECTION
Institutional money managers are forced to put money to work most of the time. Hedge funds can't just sit on their hands when T bills have 0 yield, as costs will significantly eat into performance every month where nothing is done. If you stay un-invested, investors will question your commitment. However, having cash in hand can be enormously beneficial during a fire sale. You can find bargains among the rubbish. This is an important area where less sophisticated investors may have an advantage over their institutional counterparts. In Chapter 7, we give several examples of trading strategies that can take advantage of high volatility. While these are not without risk, an investor who has plenty of dry powder can take advantage of the opportunities available. We also survey some of the intriguing and possibly controversial academic research that relates the price of variance swaps to the equity risk premium. Our more humble examples focus on the idea that market valuation ratios, such as price to earnings, are far more sensitive to price than anything else. This automatically creates value-buying plays after a sell-off.
THE NIEDERHOFFER ARGUMENT
Recently, Niederhoffer (2014)3 has argued that trend following might not provide adequate protection during future crises. The paper starts with a historical observation. Since the 1980s, interest rates have been in a secular bear market. Bond prices, which move inversely to rates, have persistently trended up. On a risk-adjusted basis, bonds have outperformed stocks by a very wide margin. It's a one horse race, as illustrated in Figure 6.6. We have tracked the performance of a rolling position in S&P 500 and US 10-year note futures. The 10-year note returns are geared so that their 1-year trailing volatility matches that of the S&P. The performance differential is so large that we need to represent it on a logarithmic scale. Even if we use the cash S&P 500 index rather than S&P futures, the gulf is enormous.
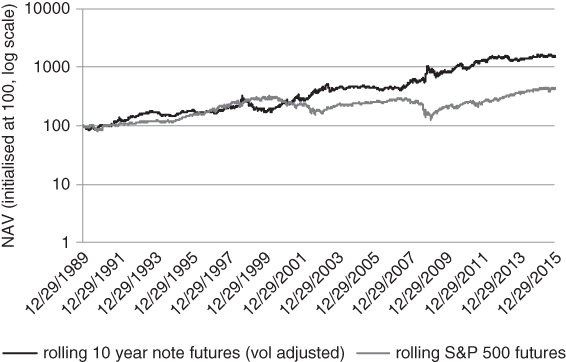
Figure 6.6 Bond futures have delivered relatively high absolute returns as well as protection during a crisis
Note that our bond proxy is a rolling long position in 10-year note futures. The fact that we have generated bond exposure through a rolling futures strategy is significant, as we will soon find out. The extended bull market in bonds has created a fertile environment for trend followers. They typically have taken long positions in US 10 year, Bund, Japanese Government Bond and other interest rate futures markets in an effort to capture a move that has transcended market cycles. We argue that a large proportion of returns has come from bonds and other interest rate futures. Since these markets tend to be very liquid, large CTAs have been able to deploy significant amounts of capital to rates. Their allocation to interest rates has been proportionately high. In turn, the bias toward bond futures over other classes has boosted returns. Trend followers have benefitted not only from declining spot rates but also from the roll yield embedded in interest rate futures. As we mentioned previously, the US yield curve has usually been upward sloping since the 1980s. When yields started to come down following the Fed's attempt to control inflation with tight policy, short-term rates declined more rapidly than long-term ones. This generated an upward sloping yield curve or, equivalently, a downward sloping futures term structure.
Figures 6.7 and 6.8 emphasise the importance of futures roll down. These graphs encapsulate the results of Monte Carlo simulations. First, we calculated the average level of backwardation for US 10-year futures over the past 20 years. As it turns out, the back month has historically traded at a 75 basis point discount to the front month. We then simulated multiple interest rate paths over 1000 day horizons, making the crude assumption that constant maturity Treasury yield returns evolved according to a random walk. The volatility of our random number generator was calibrated to match the historical volatility of the relevant constant maturity rate. The zero coupon yield curve was initialised at 2%, for all maturities. This is a reasonable synopsis of where longer-dated yields are trading as of this writing. Next, we priced 10-year note futures off this curve, assuming that the cheapest-to-deliver bond was always the one with the shortest duration. Burghardt (2005) and Choudhry (2006) are useful references for readers who want to become familiar with the intricacies of pricing and hedging sovereign bond futures. Finally, we calculated the cumulative return of the futures on a simulation-by-simulation basis. This incorporated the roll yield that we have calculated above.
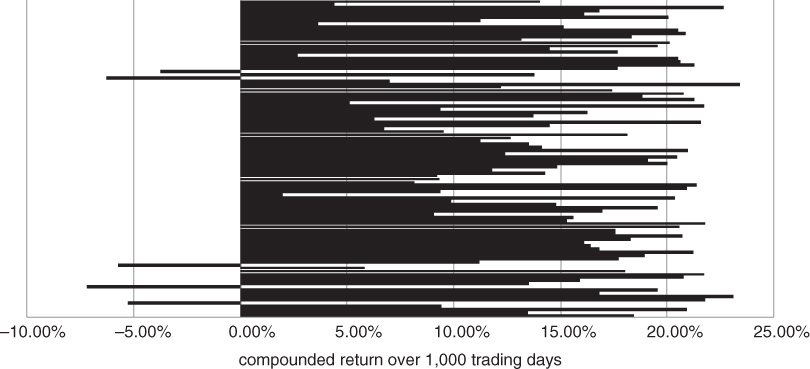
Figure 6.7 Roll down overcomes randomness in interest rate paths when the term structure is in significant backwardation
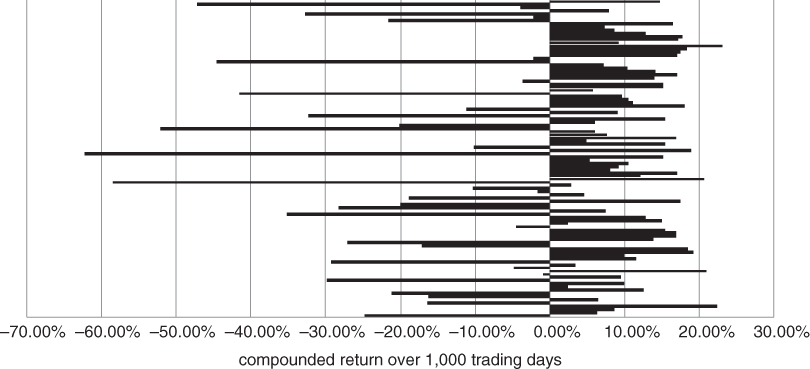
Figure 6.8 Even if rates are ratcheting up, bond futures can have positive expected return
The previous paragraph was a mouthful. Let's just say that we simulated some bond prices using the historical futures term structure, assuming no trend in rates. The simulation was reasonably realistic, given the current market environment. Figure 6.7 summarises our results.
Nearly all of the futures price paths compound to a positive 1,000 day return. With backwardation at this level, the shape of the term structure dominates random fluctuations in rates. We only start to reach break-even levels if we aggressively reset the drift in our simulation. More precisely, we need to assume that rates have roughly +20% annualised drift before the futures have a greater likelihood of going down than going up! (See Figure 6.8)
We note that the average down moves appear to be bigger than the average up moves because our simulation has effectively constrained longer-term rates to be above 0. The distribution of interest rates is effectively assumed to be log normal. As rates approach 0 in a given simulation, the magnitude of subsequent rate moves becomes smaller.
Now we come to the crux of the Niederhoffer argument. Bonds have generated remarkably strong returns since the 1980s, with recent performance dominated by capital appreciation rather than yield. The trend has been almost unilaterally positive. At the same time, they have acted as the de facto flight to quality security, providing statistical insurance during spikes in global market volatility. Over this period, you would have been paid to hold insurance in the form of bonds. How nice is that? While sell-side economists were busy rattling on about how bonds were overpriced, dedicated trend followers were happily rolling their long positions. As we observed earlier in the chapter, pure trend followers make no attempt to assess the fair value of bonds or any other asset. Their decision-making during the “great moderation” was price-based, as ever. Given that the typical CTA allocation to bonds has been relatively high and bonds have consistently performed well during risk events, it may be that CTAs have provided insurance by accident.
Niederhoffer emphasises this point, in an effort to place doubts in the minds of investors who allocate to trend following as a portfolio anchor. He argues that trend followers might not offer protection should the term structure of interest rates change, i.e. if short-term rates rise more quickly than longer-term ones. Most US investors haven't seen an environment where stocks and bonds go down together and it is not obvious that trend followers would perform well in such an environment.
Broadly, there are two important scenarios where trend followers might not provide any protection against rising volatility. If yields started to rise for a sustained period, trend followers might find themselves short, on the wrong side of a flight to quality spike in government bond prices. Conversely, if there were an inflationary shock with yields skyrocketing, they might be caught with a long position. As of mid-2016, short-term yields would have to rise quite rapidly to push the futures curve into contango. Otherwise, bond futures and yields might rise simultaneously, forcing trend followers to maintain a long position in bond futures. They would be ill-equipped to handle a shallow rise in yields followed by a violent inflationary spike. This is yet another case (e.g. recall the VIX discussion in Chapter 4) where a portfolio manager is handicapped by an inability to access spot market moves in an efficient way.
We have started this discussion by outlining a number of reasons why trend following might not function as a portfolio hedge in the future. However, there are other factors at play, that may increase an allocator's comfort in the strategy. To illustrate this point, we refresh a study on the properties of momentum models that operate in different markets over different horizons. We first check whether short term momentum tends to work well within a given market when volatility picks up.
CHASING 1-DAY MOVES
If we don't resort to intra-day data, the shortest lookback window for trading breakouts is one day. So let's start with that. We want to test the hypothesis that short-term breakout system returns are correlated with changes in volatility. This was shown in several specific cases by Kremer (2007). In Figure 6.9, we compare the performance of a one day breakout model on the S&P 500 with changes in the VIX. Our trading rule is very simple and is simply used to illustrate a point. We are by no means recommending it as an absolute return strategy. Contrarian trading over 1-day horizons may in fact be a better strategy across markets. For the moment, suppose we have a trading rule that buys the S&P 500 whenever the trailing 1-day return is positive and sells the S&P 500 whenever the return is negative. We are simply chasing 1-day trailing performance. In the scatter plot below, we can see that the returns of this strategy have a mild positive correlation to changes in the VIX.
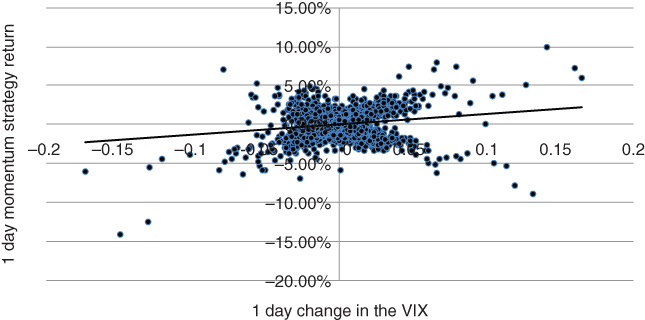
Figure 6.9 1-day momentum returns have a moderately positive correlation to changes in the VIX
This at least is suggestive. If you chase every 1-day move, you are looking a bit like a long volatility strategy in the markets you trade.
An interesting variation of this trade involves trading 1-day moves in the US 10-year note. We can regress the performance of the 10-year chaser against 10-year implied volatility. Taking into account the high conditional correlation between the TVIX and VIX, however, it may be more instructive to regress performance against changes in the VIX. By “conditional correlation”, we mean the correlation given (i.e. conditional on) a large spike in one index or the other. This is consistent with an idea we presented earlier in the book. Usually, “flash crashes” are preceded by a sequence of down days. The down days put pressure on leveraged investors. At some point, these investors reach their pain threshold and liquidate large chunks of their portfolio. This has the potential to cause a dramatic sell-off. However, there is no guarantee that the next flash crash will develop in such a predictable way. If there is an entirely unexpected credit or geopolitical event, the one day “chaser” might not be on the right side of the move.
As we lengthen the breakout horizon, the correlation between signal returns and volatility in a given market typically decreases. This means that we have to content ourselves with the following rather conservative conclusion. Trend following strategies with well-defined stops generally provide diversification (though not pure insurance) when there are sustained outsized market moves. Meanwhile, shorter-term systems have a greater chance of being on the right side of the market when there is a spike in volatility. Unlike many other hedge fund styles, they do not rely upon selling an explicit risk premium. Usually, you are taking liquidity while trading in the direction of the prevailing trend.
PUSHING THE ANALOGY TOO FAR
The analogy between trend following and long options strategies originates from the days when many managers used hard stop losses. If crude oil futures were trending and your system generated a buy signal at 80, you might have an exit at 70. If prices continued to rise, you would gradually move the stop loss higher to lock in a profit. At the point of entry, your payout profile would look a bit like a long call option at expiration.
This simple observation probably motivated Fung (2001) to compare trend following to a static long options position (i.e. a lookback straddle). Since a straddle benefits from rising volatility, it's tempting to conclude that trend following is also structurally long volatility. However, we caution against interpreting the analogy too literally. Trend following is somewhat similar but not equivalent to a long options strategy. You do not directly profit from increases in volatility. We illustrate this using a simple example. Even the hard stop loss assumption is a stretch. Most trend followers scale in and out of positions as their signal changes. When a trend breaks, the short-term indicators exit the position first. Over time, longer-term indicators follow suit, so that the entire position is not liquidated or flipped in a single go. For large trend followers, “bang bang” controls on positions cause unnecessary slippage. You don't want to enter or exit a large position in one go. It is preferable to vary your sizing fairly continuously through time. In this way, your returns are not overly sensitive to split-second timing. You can also trade more when there is more liquidity in the market. For concreteness, though, let's assume your trend following strategy does use explicit stop losses. This is a conservative assumption if we are trying to disprove the hypothesis that trend following is equivalent to a static options position. However, for simplicity, assume that your strategy does have specific exit points for trades. Assuming that you can execute at the stop level, your payout profile looks like a call or put at any point in time. For long positions, your potential gains are theoretically unlimited, while your losses are bounded by the stop.
This all seems fantastic. You now have a strategy that equates to buying an option, with no premium outlay. Or so it seems. There is a problem with the downside-stop-as-insurance argument. First of all, there is no guarantee that you will be filled at the stop if there is a very sharp move in the underlying. More importantly, in our example, you are only instantaneously long a call. There is no telling what your position might be tomorrow.
Let's say you are long oil with a sell stop below the current price today. If the trend reverses strongly, you might be selling oil with an upside stop before you know it. Even if the instantaneous payout resembles an option, you wind up flipping between a long call and long put over time. It is worth adding that many trend followers use a risk-budgeting approach when sizing positions. Roughly, this means that the notional amount assigned to each contract is inversely proportional to the volatility of the contract. In addition, if the volatility of an asset goes up with no change to the trading signal, the position will automatically scale down over time. Volatile contracts, such as natural gas, get smaller allocations than contracts that don't move very much over time. How does this affect the qualitative properties of a trend following strategy?
Let's return to our old faithful, the S&P futures contract. We can construct a simple example demonstrating that risk-budgeting can offset the implied “gamma” in a trend following system. Suppose that a client wants to hedge long exposure using a dedicated short trend follower on the S&P. The hedge is outsourced to an overlay manager. The trend following algorithm progressively builds into a down move by moving from cash into an ever-increasing short futures position. This certainly has the characteristics of a long put on the index. However, a meaningful sell-off in the S&P is usually accompanied by an increase in realised volatility. Bear markets are characterised by ferocious down moves and equally vicious relief rallies. If the overlay manager has a risk threshold and volatility spikes, it may be necessary to cut a fully loaded position to stay under the threshold. Increased signal strength is offset by a risk constraint. This reduces the return potential of the hedge if there is another leg down. The owner of a put has no such concerns, as the put will automatically gear into a sell-off, with an added kicker from any increase in implied volatility.
Is a strategy that flips between calls and a put long volatility? We can test this directly. Suppose we alternate between buying a 1-month ATM call and put on the S&P 500 based on the flip of a coin. We repeat the coin flip at the end of each week, unwinding our old position and initiating a new one. We calculate a weekly return by repricing the option, based on the change in the underlying price. Note that we keep the time to maturity and volatility of the option fixed, as trend following strategies do not have any theta or vega. Finally, we calculate the correlation between our strategy returns and changes in the VIX. Figure 6.10 is based on 1000 simulations of weekly returns from 2005 to 2015.
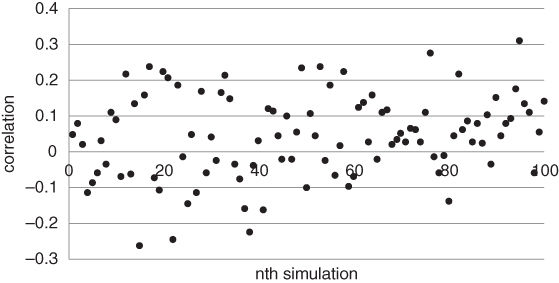
Figure 6.10 Random switching between puts and calls is not analogous to a long volatility position
It turns out that the average correlation between strategy returns and changes in the VIX is close to 0. This suggests that there is no obvious relationship between trend following on a single market and volatility in that market, even if the strategy uses stop losses at point of entry. We emphasise that this is not a conclusive study. It merely suggests that a strategy with stop losses is quite different from an options buying strategy.
The analogy becomes even weaker when we reflect that trend followers don't use explicit stop losses any more. The largest and most established funds tend to scale in and out of positions almost continuously, based on signal strength and changes in volatility. Position sizes tend to be inversely proportional to volatility in a given market. This implies that if a manager is fully short the S&P and volatility increases, the position will be reduced, to ensure that the S&P risk contribution is not too large. So the “long gamma” effect of scaling into a winning position is partially offset by a risk constraint that sets an upper bound on position size, based on volatility.
Malek and Dobrovolsky (2009) convincingly argue that long gamma strategies are not automatically long volatility. On a statistical basis, trend strategies may appear to be short volatility over modest horizons. This is particularly true for managers who rely upon long-term trends, when the trend is breaking violently. The converse is also true: short gamma strategies can outperform in high volatility regimes. As we will see in Chapter 7, contrarian strategies that buy dips in equity indices can have a high correlation to the level of volatility in the market. Similarly, asset allocation schemes that re-balance to a set of strategic weights may also outperform when volatility is high.
Most fund managers tend to distinguish between “good” and “bad” volatility, relative to their trading style. When the market aimlessly wanders around like a drunken sailor, that’s good for contrarians and bad for trend followers. Conversely, when a given asset crashes through its historical range and keeps going, trend followers rejoice. The conclusion is simple. Since you are not paying an options premium when you follow a trend, you should not expect to benefit from every expansion in realised volatility.
ANALYSING THE DATA DIRECTLY
The reader may have noticed a strange pattern in this chapter. We initially asked whether trend following is a long volatility strategy. Since then, we have waffled back and forth, without giving a definitive answer. This pattern will continue here. Hopefully, we are not starting to resemble one of those banks that have a habit of presenting two opposing views, in order to have something to sell. The truth is that trend following is a highly diversifying strategy with some option-like characteristics. In our opinion, it is a vital component of a diversified, multi-asset class portfolio. However, the options analogy is not a precise one. We can't say how a bog standard trend follower will perform during the next crisis. The random switching strategy from Figure 6.10 is suggestive but not definitive. When there is a strong move in one direction or another, trend following might be analogous to holding a call or put for quite some time, without switching. By contrast, random flipping between a call and a put shows no persistence. So let's try another approach. The most direct way to see how trend following performs as a function of volatility changes is to build a momentum strategy explicitly. So long as our version is representative, we can then regress the returns of the strategy against changes in the VIX and just see what we get. We have used the VIX as a risk indicator since it is widely quoted, has a reasonably long history and is sensitive to large changes in risk aversion across markets.
Our trend following signal is very basic, but representative. We focus on breakouts over six different time horizons, 1, 5, 10, 20, 50 and 100 days. Note that a “breakout” occurs when the price of a contract moves out of its historical range. For example, let's consider the 5-day breakout signal. If the closing price today is higher than the maximum over the previous 5 days, we go long. If it's lower than the minimum over the previous 5 days, we go short. Otherwise, we maintain our position. After an initial breakout, the signal is always in the market.
Our composite return is simply the average of the individual breakout system returns. We use multiple breakout horizons in an attempt to capture trends over a variety of time horizons. Note that we have not said anything about how to combine our multi-frequency signals across markets. We are simply checking whether there might be some connection between trend following returns and volatility changes within a specific market.
Next, let's take our composite signal and apply it to a representative market. In Figure 6.11, we have applied our homespun trend follower to the S&P 500.
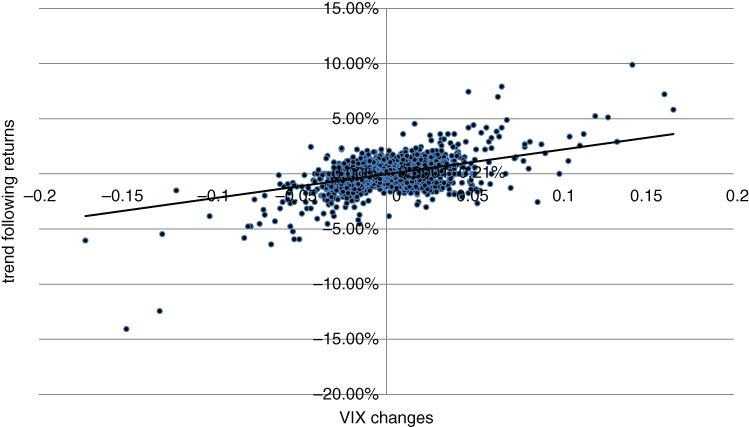
Figure 6.11 Moderate historical correlation between trend following returns on the S&P 500 and changes in the VIX
The results are actually quite promising. The R-squared of the regression is close to 0.2 over a 20-year horizon, using daily returns. There does seem to be some connection between volatility and the performance of a momentum strategy on the same underlying equity index. Why should this be so? We can only speculate. The sharpest spikes in the VIX have usually occurred after an equity bear trend has already formed. They do not appear completely out of the blue, but represent liquidations from long-biased managers who have come under increasing pressure to exit their trades. This implies that our trend follower has a tendency to be short in advance of the largest jumps in the VIX and will frequently provide protection when markets go into crisis mode. Broadly speaking, the same results apply to US 10-year futures, i.e. returns from our basic trend following system are positively correlated to changes in bond implied volatility.
If equities and credit move into an extended bear market, trend following is likely to come to the rescue. Almost any reasonable system will eventually accept that risky assets are in a down trend and will short the market thereafter. However, choppy markets with intermittent flash crashes do not play into the hands of momentum-based strategies. The only way to cover rapid wholesale liquidations within the larger context of a bull market is with options. Ideally, we should be able to identify conditions where rapid sell-offs or protracted bear markets are likely. This is the topic of Chapter 8.
LEGO TREND FOLLOWING
We can increase the probability that a trend following system will provide protection against adverse moves by customising it. This involves reassembling the building blocks of a full trend following system, “LEGO” style. Suppose that we want to hedge the future liability stream of a pension fund against a decline in yields. If the discount rate drops, the fund will become less solvent unless the asset pool goes up by an equal amount. The present value of liabilities (i.e. the amount required to fulfil future obligations given current interest rates) will have increased. While a system that goes long and short in major markets will have some correlation to rising market volatility, we can be more precise than that. We can increase the expected duration of our system by overweighting long signals in global sovereign bonds. In particular, we don't want to get caught with a short position in bonds if rates drop. It's true that if rates go into a sustained down trend, the trend follower will eventually take a long position in bond futures. However, actuarial losses may have been compounded by a short futures position along the way.
A reasonable solution is to customise the trend following system by focusing on a subset of available trades. This may degrade the stand alone alpha of a trading system, but is likely to increase its marginal utility relative to an existing portfolio. In particular, you could constrain a full system in the following ways to extend the duration of an existing portfolio:
- only trade bond and interest rate futures (note that equity indices and commodities have unreliable duration from a statistical standpoint)
- avoid shorting these futures, to ensure that the aggregate duration of the overlay is never negative
- overweight short-term trend signals, to increase the expected correlation of the overlay to volatility.
A wide range of static portfolios can be hedged using the same line of reasoning. For example, we might hedge an equity portfolio by restricting ourselves to short signals in equity index futures. If our full trend following system generated a long signal in S&P E-mini futures, we would simply ignore it and stay in cash. From the standpoint of hedging, we would never want to be positioned in the wrong direction in advance of a move.
Institutions that are unable to trade futures directly can outsource a bespoke trend following strategy to an external manager. This might take the form of a managed account, which is easily customised and requires a relatively low cash outlay.
SUMMARY
Once volatility picks up, outright options buying becomes expensive. We've explored range-based hedges as a way to maintain some level of protection while keeping costs low. Another alternative is to follow trends in major markets. This approach has offered statistical protection during historical risk events and does not force you to pay up for volatility once it has become expensive. We caution that trend following may have provided historical protection for structural reasons that may not persist into the future. A reasonable hybrid approach combines options with trend following algorithms, with an emphasis on short-term systems that have been particularly responsive to volatility spikes in the past. Trend following enhances the expected return of a hedging overlay, while providing statistical protection against large-scale directional moves in a given asset. It also defends against fundamental high conviction views that are not currently being validated by the market.