Chapter 8
“Flash Crashes”, Crises and the Limits of Prediction
We have spoken at length about hedging after a drop and even ventured into offensive strategies for a high volatility market. But is it possible to anticipate sharp sell-offs or longer-term crises? The words “predict” and “forecast” are a bit more loaded. These words bring to mind the admonition that the goal of economic forecasting is to lend credence to astrology (1984). Nevertheless, we will wade into the muck and see whether it is possible to say anything about the likelihood of a quick correction or longer-term bear market. We informally describe how a flash crash can develop, using an analogy from mathematical biology. There are attempts to predict crises in the recent literature. We discuss some of these approaches, ending with a cautionary note about the limits of forecasting in financial markets.
LORD OF THE FIREFLIES
Many investors (especially those influenced by Taleb, 2007) vigorously argue that market crises are inherently unpredictable. Portfolio managers sometimes feel that they are operating in a sea of randomness, with a low signal to noise ratio for even their best ideas and systems. Large-scale liquidations are particularly baffling. If conditions had been even slightly different, they may never have occurred. In this context, the claim in Sornette (2009) that extreme moves can be predicted and possibly controlled seems remarkable. It's like trying to solve the hardest problem in a scientific field without having a reasonable understanding of the simplest cases.
We need to be a bit more precise here. Sornette does not claim that all market movements can be predicted. In most market regimes, the degree of predictability is low. However, he would argue that there is a brief and reliable “window of predictability” for financial disasters. Sornette is not focused on high frequency liquidations, but rather the sort of longer-term market disasters captured in Reinhart and Rogoff (2009). In his paradigm, the fog of uncertainty lifts just before something really awful is about to happen.
A signal arrives in the form of unsustainable price action. Markets go parabolic, rising at an ever-increasing rate, before the inevitable correction. “Weak hands” enter the market near the end of the rally, in a last-ditch effort to participate. These investors are easily flushed out at the first signs of weakness and can create a strongly negative feedback loop. An ever-increasing number of investors are forced to sell as their downside stop levels are hit. Sornette has identified various boom/bust cycles in China and US technology stocks where in his view, a major sell-off was inevitable.
Sornette's analogy between phase transitions and market collapses is suggestive, though not entirely accurate. It is not necessarily the case that markets move from a state of order to disorder during a liquidation. Over long horizons, characterised by unpredictable waves of buying and selling, this may be the case. However, at the tipping point where panic selling begins, investors tend to be aligned in the same way. While it is true that there must be a buyer for every seller, buyers can aggressively drop their bids and still get filled when the market is cratering. The investors who are initiating large blocks of open interest are almost invariably sellers.
The notion that liquidations actually represent somewhat orderly behaviour (however hair-raising) requires a different analogy. The sum of investors can be thought of as a collection of agents whose activities become synchronised in advance of a fat-tailed event. Once the level of synchronisation crosses a threshold, a crisis becomes inevitable. Steven Strogatz's model of the synchronised bursting of fireflies is particularly appropriate and we briefly review it here. We highly recommend Strogatz (2004) for its fine exposition and interesting ideas. The story goes as follows. In the 1500s, European explorers started to relay stories about Asian fireflies back to their mother continent. As the cover of this book humbly suggests, large clouds of these flies were able to coordinate their activities to the extent that they could illuminate the river banks as night began to fall. This was the stuff of wonder and awe, as it would be several centuries before the electric light bulb was invented.
Given that fireflies are not renowned for their expertise in strategic planning, it seemed astonishing that they could organise themselves into swirls of light, synchronising their flashes. It took quite some time for scientists to understand how such an organised network could form spontaneously. It was eventually discovered that the movement and timing of flashes could be controlled by a light of variable intensity. This implied that fireflies could send each other simple messages by flashing in a specific way. Referring back to Sornette's argument, the important point was that if enough flies started behaving in a co-ordinated way, others would follow. Beyond a threshold, the short-term movement of every fly would follow a fairly deterministic process. This is the window of predictability we referred to earlier. You could almost tell when the fireflies were about to act collectively. While crises tend to build over horizons of months rather than minutes, the firefly example demonstrates that co-ordinated behaviour can arise from a collection of agents who act independently under normal circumstances.
CASCADING SALES
Intraday sell-offs do not fit precisely into the Sornette framework. They are not necessarily preceded by accelerating rallies that drive valuations to extreme levels. Over short horizons, valuation is relatively unimportant. Prices tend to be driven by technical considerations. Still, it seems as though investors exhibit the same sort of collective behaviour during a severe drop, independent of horizon. Negative feedback loops feature in sell-offs over all frequencies. Proceeding from the Strogatz analogy, we can think of each order as a single firefly. As their behaviour becomes more organised and directed, the probability of an outsized move becomes increasingly likely.
Whenever someone asks you why the market crashed today, there is always an easy answer: positioning. In this case, the easy answer isn't very helpful, but it's invariably correct over short time horizons. There's no need to scan your news feed or process large quantities of sentiment data. Whatever may have happened in the outside world only provided an initial impulse for the larger move. At some point, larger investors were forced into the market in an attempt to reduce margin requirements, meet redemptions or manage their losses. But how do large volumes of selling precipitate intraday crashes? In this section, we attempt to address this question using a simple model of price impact.
We start with another analogy. Suppose you're at a public auditorium and you see lots of people heading for the exits. If they all belong to the same group, you wouldn't be too worried. They might all be going somewhere else; collectively, they have a single mindset. However, if people are leaving from throughout the hall and the show isn't over, you might be inclined to leave too. Something must be up (assuming, of course, that it isn't the performance itself). The information content seems much higher when unconnected agents are all doing the same thing.
The same argument applies to price moves in the financial markets. A large number of small trades in the same direction will typically move the market more than a single trade of the same total size. The graph below is loosely based on Bouchaud (2009), which surveys various price impact models. Here, we assume that price impact is inversely related to the square root of volume, as in the BARRA model. Suppose that there are a series of buy orders in S&P 500 futures, accounting for 5% of average daily trading volume. What is the estimated price impact?
Under the following assumptions, we can sketch the price impact function. The third of these is based on conversations with execution brokers and should not be interpreted too rigidly.
- About 2 million S&P E-mini futures contracts trade each day.
- The futures have a volatility of 15%.
- If a 10,000 lot goes through the market, its price impact will be around 0.3% of the index level, i.e. 6 points if the futures are at 2000.
- The volatility of the contract is 15%.
The third assumption allows us to solve for ![]() in the price impact function
in the price impact function
where ![]() is the volatility of the index and the trade size
is the volatility of the index and the trade size ![]() is set as a percentage of daily trading volume.
is set as a percentage of daily trading volume.
We can break up 5% of daily trading volume in a number of ways, 100 trades of 1,000 lots, 50 trades of 2,000 lots and so on. If the trades are all buys or sells, we end up with an impact curve as in Figure 8.1.

Figure 8.1 Small unidirectional trades collectively have larger impact than a single block
The curve is remarkable because it suggests that 100 trades in the same direction will have 5 times the impact of 4 trades that amount to the same total volume. This is insightful and ultimately troubling, given the current trend toward automated order routing systems. These systems tend to slice large orders into smaller blocks, leading to smaller average trading sizes. If the price impact curve remains the same in the new regime, the probability of fat-tailed moves in individual securities is likely to increase.
A CONCRETE EXAMPLE
At the risk of oversimplification, we can try to codify Sornette's collapse point theory into a small set of rules. Roughly speaking, Sornette is looking for two conditions that might precipitate a crisis. First, prices need to have gone up very rapidly in the recent past. More recently, the pool of potential new investors has been exhausted. This is reflected by an increase in realised volatility. The aggressive tug of war between buyers and sellers has intensified. So let's test these conditions on some real data. We consider an index that has experienced two bubbles and crashes over the past 10 years, namely the Shanghai composite index as shown in Figure 8.2. Our data set ranges from 1990 to 2015. We start by specifying the year on year (YoY) change in the index. Next, we calculate the 5 year trailing Z score of the YoY returns. We also calculate the 5 year trailing Z score of 1 month historical volatility for the index, using daily returns. Our crisis warning indicator flashes if both Z scores are above 2. In other words, recent price increases and current volatility need to be at least 2 standard deviations above normal.

Figure 8.2 Nuts and bolts implementation of Sornette's crisis indicator, Shanghai Composite Index
It can be seen that this basic implementation is reasonably effective, accepting that the effective sample set is small. A false signal is given in mid-2006, but the signal is quickly washed away. The remaining signals occur fairly close to the point of collapse. The idea that elevated volatility is predictive of danger is not new and underpins many asset allocation schemes. However, Sornette deserves credit for moving away from a largely valuation-based approach to predicting crises to one that relies upon price action itself.
AN ASIDE
Sornette pushes things even further with his second assertion. Somewhat remarkably, he contends that a small policy control applied near the threshold should be able to subvert a bubble or crash. In the firefly example, this might correspond to drawing some fireflies away from the group as they start to co-ordinate their activities in some area.
Many of us have not even reached the point of deciding whether it is possible to predict a crisis, let alone come up with a model that claims to do exactly that. Sornette's two claims may strain the imagination a bit. From a technical standpoint, it is hard to model singularities (i.e. extreme solutions to dynamical systems) in physics, let alone finance. Some equations in physics have solutions that “blow up” in finite time. But do these singularities really exist, or are they artefacts of the modelling process? There might be an equation that is nearby the original one, in some sense, yet does not have any singularities. One has to be very cautious. However, it does seem as though Sornette has made some progress in identifying price movements that are too fast to be sustainable. This naturally leads us to a discussion of more concrete models that can be used to say something about rapid sell-offs and longer-term crises.
PATHS, PRINTS
We have described above how a large succession of trades in one direction can have surprisingly large price impact. Some short-term traders are left scratching their heads, thinking that they have missed something. They eventually pile into the market, exaggerating what was perhaps an uninformed trade in the first place. Eventually, levered investors hit their pain thresholds and are forced into the market. If lots of selling is going on around them, they have to sell in an effort to cut risk. Is there any way we can model the interaction between random moves in the market, leverage providers and leveraged funds in a way that generates outsized moves?
Thurner (2012) has developed a model that might not predict fat-tailed market moves, but generates the right sort of qualitative dynamics. Chaos theory, which held such promise in the 1980s, is similar in spirit. You can generate a rich set of dynamics that “looks right” by perturbing a relatively simple equation. While you can simulate a wide range of outcomes, however, you can't predict real world outcomes with much accuracy. Farmer's group at Oxford has subsequently built more realistic representations of the economy. This is a promising area that may allow central bankers to simulate the impact of policy decisions on financial markets and the real economy. Interventions that are likely to destabilise the economy can be ruled out. The paper develops a “toy” model with 3 agents: a bank, a noise trader and a leveraged investor. The market is initialised to move randomly through time. For simplicity, it might be worth thinking of the “market” as a broad-based stock index. Noise traders respond to the random moves, buying short-term dips and selling rallies. They operate on the assumption that there is no information content behind these small irregular moves. Things are likely to revert quickly. Noise traders have a tendency to generate mean reversion in prices in “normal” regimes. The leveraged investor is called a “value investor” in the paper, but in general could take a long position based on value or momentum criteria. The point is that, as leverage increases, these value investors have a relatively small margin for error. They will be forced to sell out of their positions relatively quickly and aggressively if there is a material downside move. Otherwise the bank, providing leverage to the investor, will threaten to close out their positions. In this scenario, the noise traders (i.e. self-styled liquidity providers) are forced to pull out of the markets, as they do not have sufficient capital to hang on to losing positions for an extended period of time.
As leverage approaches a critical threshold, we can show that the market return distribution deforms into a fat-tailed one. The potential for large down moves increases. All it takes is a sharp enough drop in the index for long investors to be forced into the market. Selling can become desperate and indiscriminate when investors are in danger of having their credit lines pulled. In this context, leverage is the key variable driving large-scale moves in the broader market. If we follow this argument though to its natural conclusion, the central bank must have an impact on the formation of bubbles and crashes. When investors are trying to magnify returns with leverage and the central bank is simultaneously trying to withdraw credit from the system, the conditions for a crisis are in place. Commercial banks will eventually have to curtail their lending activities once they lose easy access to cheap revolving credit. The tightening ultimately gets passed on to corporations and investors, who now have a harder time maintaining a borrow. Under these circumstances, a –10% drop in the S&P index will have a disproportionately large effect. Banks will be quicker to enforce large margin calls at a time when investor gearing is at a cyclical high. If we are to understand the relationship between tail risk and credit, we need to understand the workings of the central bank in a bit more detail. This is the topic of the next few sections.
THE ROLE OF THE CENTRAL BANK
Rothbard (2008) is an entertaining, though agenda-fueled, romp through the history of banking. It argues that governments have always been incentivised to inflate the supply of money. A king might recall existing coins, melt them down, dilute the gold or silver content and stamp a larger quantity of new coins. The king could then keep the extra supply for himself. In this way, monetary expansion (i.e. increasing the quantity of coins) was an implicit tax on the people. Their coins would theoretically be worth less on the open market. In modern times, credit dwarfs the supply of physical money. Accordingly, governments have more sophisticated tools for encouraging growth and consumption in the system. These are typically deployed by the Central Bank.
Rothbard encourages us to take a critical look at the inner workings and motivations of central banks, notably the Federal Reserve Bank in the US. One of his main points is that, once the US moved away from the gold standard, bubbles became more likely. The government could quickly increase the domestic money supply without having to back it with gold. Major economies could now engage in competitive devaluation, as there was no need to withdraw money from the system after selling gold to another central bank or into the market. For asset owners, inflation has a “feel good” factor associated with it. People's houses are worth more, their stock portfolios rise and there is an urgency to buy things before the next price increase. The winners in the inflation game are the ones who buy first, before prices increase. Conversely, investors who favour safety and income pay an implicit tax in an inflationary environment. This can stimulate real growth in the short-term, but the growth is unsustainable. Hyper-inflation can create political instability, as in post-World War I Germany. If a central bank turns off the liquidity spigot too aggressively or at the wrong time, a bubble can rapidly turn into a crash.
Sornette and Woodard (2009) trace the roots of the 2007–8 financial crisis back to monetary policy from 2000 to 2004. This is the same Sornette as before, now giving a historical perspective on credit expansion before the crisis. Although stocks sold off quite dramatically from 2000 to 2002, economic growth remained relatively strong. Nevertheless, the Fed Funds rate was steadily cut from 6.5% to 1%. The Fed was presumably responding to market price action, rather than its stated dual mandate of employment and inflation. Recall that Fed Funds is the rate at which commercial banks borrow from the Federal Reserve Bank. A low Fed Funds rate encourages banks to finance long-term corporate projects using revolving short-term credit. This can stimulate the economy if there is adequate demand from the private sector. Otherwise, the excess credit may be misdirected to assets that are already overvalued.
Low interest rates encouraged leveraged speculation in real estate, equities and high yield bonds from 2003 to 2007. Giant bubbles formed in the credit derivatives markets. Once fundamental cracks appeared in the system, the genie couldn't be stuffed back into the bottle. Perversely, the Fed had to do more of the things that had caused excessive speculation in an attempt to prevent a collapse in the global banking system. Overly lax policy and bank lending are nearly always behind the speculative bubbles that ultimately collapse.
CREDIT CYCLES AT THE ZERO BOUND
It has been remarked that all assets are in some sense derivatives of the Fed Funds rate. While there are clearly other factors at work, variations in target rates can have a large impact on various asset classes, ranging from bonds to real estate. A drop in rates typically causes yield curves to steepen and may increase demand for risky assets such as real estate, equities and high yield bonds. The implied carry in these strategies becomes relatively attractive. A rise in short-term policy rates tends to have the opposite effect. Bank profits have a tendency to decrease, given that the spread between borrowing and lending rates has shrunk. (Note that a collapse in long term yields can have an even more pronounced negative effect on bank profits.) Once rates get really low, all sorts of distortions can occur. Risky assets such as stocks, corporate bonds and notably housing can rally. Investors and home buyers can now borrow at rock bottom rates. This increases the amount of money and credit chasing a fixed pool of assets and can cause speculative bubbles. Eventually, the market overheats, forcing the Fed to start hiking rates again.
But how can we apply this reasoning when short-term rates are stuck at 0? There is no value in measuring the sensitivity of an asset to a quantity which does not move. We can no longer extract information about central bank policy from month over month changes in rates. Consider the current situation. Even if most observers agree that rates should be higher, there never seems to be a good time to raise them. As Sornette and Woodard have remarked (2009), forward guidance seems to be increasingly dependent on what is going on in the market. This is an unfortunate legacy of the Greenspan era. Suggestions of a rate hike have been met with panic selling, pushing actual rate hikes further out into the future. Is there a viable way to track central bank policy in a 0 rate world? An idea emerges when we start to think of what the Fed and ECB have actually done over the past few years. Their ability to cut short-term rates has become severely restricted. Rather, they have engaged in various rounds of “quantitative easing”, or QE. This has included printing money to buy long-dated bonds (“operation twist”) and lending money against dubious collateral, such as mortgage-backed securities. These sorts of strategies have increased the balance sheet size of the major central banks. The goal has been to increase the quantity and movement of credit at times where commercial banks would have been otherwise reluctant to lend.
THE MONETARY POLICY PALETTE
Central banks can inject money and credit into the financial system in a variety of ways that are largely ignored by the mainstream financial media. In this section, we focus on the US Federal Reserve Bank, or “Fed”, as it is usually called. Since the 2008 crisis, Fed watching has become a major commercial enterprise. The US Fed is unequivocally the most actively followed central bank worldwide. In terms of sheer balance sheet size, the People's Bank of China, or “PBoC”, has surpassed the Fed. However, this is a relatively recent phenomenon.
There are some misconceptions as to how the major central banks operate. We hope to clarify some of them here. The financial industry seems obsessed with the Fed funds rate. A great deal of energy is spent trying to gauge where the rate is likely to go. Mathematical algorithms have been written, in an attempt to uncover subtle changes in the wording of monetary policy committee releases or speeches given by Fed governors. At some level, this is all quite ridiculous. The Fed Funds rate is actually a blunt policy instrument. It roughly measures the cost of credit. However, it doesn't say anything meaningful about its availability. Banks may be unable (e.g. for regulatory reasons) or unwilling to borrow at rock-bottom rates. This implies that the supply of credit available to the real economy need not increase as rates decline.
However, suppose that banks are unconstrained, greedy and able to access more credit at a reasonable rate. Then, there should be a multiplier effect on the private sector. Every dollar that enters a bank can contribute to 10 or more dollars of available credit. This can be viewed as a positive thing, on the assumption that working capital can be accessed more efficiently. The downside, as Rothbard (2008) suggested, is that reckless uncollateralised lending bears some of the hallmarks of a Ponzi scheme. If, in a crisis of confidence, all depositors withdrew their cash from a bank, the bank would go bankrupt immediately. The Fed can increase the quantity of credit available to primary dealers by expanding its balance sheet. There are a number of ways to increase credit supply and we list some of the most important ones below.
-
Direct lending. Initially, direct lending was the only monetary policy tool used by the Fed. Since the Fed offered cheaper loans than the benchmark commercial paper rate, some banks abused the facility and borrowed excessively. The Fed divides its direct lending activities into primary and secondary credit. Primary credit is offered to banks that are deemed to be in good shape. The duration of primary loans ranges from overnight (possibly to cover settlement issues) up to 28 days. Conversely, secondary credit essentially consists of emergency loans. “Secondary” is a polite way of saying that the bank in question is in trouble. Borrowing through the “discount window” is life support for critically injured banks, on the assumption that they will be able to repair their balance sheets once financial conditions stabilise.
Armantier (2015) has observed that, over time, banks became increasingly reluctant to borrow though the discount window. This was largely an issue of perception. Once the market discovered that a bank was asking for emergency loans, speculators would swoop in, shorting its stock and credit. In 2008, however, many banks were well past the point of worrying about perception during the next beauty pageant with shareholders. It was a simple matter of survival. Loans soared to unprecedented levels, triggering a huge jump in the size of the Fed's balance sheet. At the apex of the 2008 crisis, the Fed responded by offering a huge quantity of emergency loans, placing the US banking system on life support.
- Buying Treasuries in the secondary market. The New York Fed is responsible for cash transactions in Treasury bonds. These are called open market operations. When the NY Fed buys Treasuries, especially at an auction, a fresh supply of money enters the financial system, as they pay in cash. This is a fairly direct form of money printing. Conversely, selling Treasuries represents a withdrawal of cash from the system, as money is paid back to the Fed.
- Repo activity. Repurchase loans, or “repos”, are short-term collateralised loans. In particular, you need to post an asset in exchange for a loan. Usually, the asset needs to be something backed by the government. However, this requirement was famously relaxed in 2008, when a variety of lower-grade credits were accepted by the Fed. Once the loan is repaid, you get the asset back. Primary dealers can repo securities such as Treasury bonds to the Fed. They nominally sell the bonds to the Fed and are contractually obliged to buy them back at a higher price at settlement. The prearranged price differential between selling and buying determines the repo rate. If a bank can continuously roll its repo agreements forward in time, it has a perpetual source of credit that can be applied elsewhere.
It remains to establish a link between central bank activity and the booms and busts that occur every so often. We proceed according to the hypothesis that most of the major crises in recent memory have been credit-related. We accept that there have been various “flash crashes” over the years that do not fit into this framework. Some have been triggered by geopolitical events and others by rapid liquidations. There was a relatively silent crash in the summer of 2007, when quantitative equity funds were forced to liquidate stocks with the same characteristics at the same time. As of early 2016, we have seen lots of algorithms trading intraday price momentum across various markets. This may have triggered large-scale directional moves in markets such as oil and China, followed by violent reversals. Algo-driven moves are not easily predictable by liquidity analysis, as they can occur over arbitrarily short horizons. These may occur with greater frequency in a marketplace increasingly dominated by machines. However, most of the sustained downturns in recent memory have been credit-related. The 1991 US Savings and Loan crisis, the various bankruptcies in 2002 and the banking failures in 2008 all had their roots in a liquidity crisis. Banks lost their access to revolving loans and the Fed eventually had to increase the size of its balance sheet to compensate.
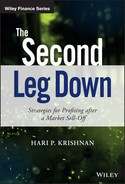
CrossBorder Capital has developed a series of liquidity indices that track central bank and private sector lending activities over time. Their policy indices focus on global central banks, covering over 75 countries. The private sector indices move further down the chain and track the amount of bank and shadow bank lending to corporations and individuals. However, for simplicity, we will focus on the US and Global policy indices only. The indices are normalised and range from 0 to 100. When an index is close to 0, the supply of central bank credit is growing well below trend. When it's close to 100, credit expansion is significantly above trend. These indices allow us to condense loan, swap, repo and cash Treasury data into a single index for each Central Bank. In Figure 8.3, we explore the connection between US policy liquidity levels and 12 month forward returns on the S&P 500. The S&P 500 is used as a rough proxy for risky assets. The regression is based on monthly data from 2000 to 2015.
Figure 8.3 Liquidity is the tide that lifts all boats
The historical correlation between the two time series is around 24%. This is more than respectable for a one-factor non-parameterised forecasting model. We observe that forward returns are especially strong after a period of aggressive easing. This can be seen in the upper right portion of the graph, where the data is almost exclusively above the x-axis. It suggests that aggressive credit expansion is very bullish for equity and credit markets.
It is also instructive to examine the global liquidity index on a stand-alone basis, as in Figure 8.4.

Figure 8.4 Time series of CrossBorder Total Liquidity Index, Global
The time series has conspicuous troughs in 1988/9, 2000/1 and 2006/7. Each of these troughs preceded a major banking or credit crisis (the savings and loan crisis, the Enron/fallen angels crisis and the Lehman crisis, respectively) by roughly two years. The series also shows strong policy responses in 1994, 1999 and 2008/9. As overall liquidity surged, a sharp increase in asset prices quickly followed. 1994 preceded an EM equity boom, 1999 helped trigger the dot-com bubble and 2008/9 caused a violent rally in credit and equity indices. The transmission mechanism seems to be faster when liquidity is increased than when credit is withdrawn from the system. It seems as though a decline in liquidity takes longer to filter through the system because central banks typically only tighten when the economy is in relatively good shape. Companies are able to absorb slightly tighter credit conditions. Conversely, an increase in liquidity can be rapidly put to work by banks and other investors who rely on leverage to generate an attractive return on equity.
It seems as though central bank activity can actually create financial fault lines for major crises. This is inevitable and does not invalidate the role of the central bank. While it might be argued that there would be an economic cycle in any case, a central bank's credit facilities can serve to amplify the cycle. After a bubble or an extended bull market, the liquidity spigot eventually gets turned off. Central Banks finally revert to their original remit, namely inflation control. Credit delivered from the central bank to primary dealers becomes more restrictive. At the same time, banks are ratcheting up their exposure. These bullish conditions can persist for quite some time, even if Central Banks are trying to put the brakes on. What we can say, however, is that crises usually occur for liquidity rather than solvency reasons. So long as a bank or sovereign nation has unlimited access to cheap revolving short-term credit, it is unlikely to default. It doesn't matter whether the entity is creditworthy or not.
Our Central Bank-derived approach to analysing crises does not quite fit into Sornette's blueprint. In particular, liquidity is an exogenous factor. It moves markets from the outside. Sornette would argue that crises do not require external shocks to appear: they are simply the byproducts of a complex network that can exhibit strong positive feedback over time. From our perspective, however, liquidity offers a near-universal mechanism for bubbles and crises. Crises might form spontaneously, but their likelihood is much higher when large investors are stretched and banks are unwilling or unable to lend. This idea is neatly encapsulated by the global liquidity index.
READING THE TEA LEAVES
By a process of extrapolation, it might be argued that economics will eventually catch up to astronomy, to the extent that market movements will become predictable over reasonably long horizons. We don't agree. In our opinion, modelling asset prices is a fundamentally different activity from modelling planetary motions. The markets offer nearly every conceivable challenge from the standpoint of prediction. At a micro level, there are a huge number of agents and we don't have an accurate understanding of how any given agent is likely to behave. High-frequency finance is the only area that allows for somewhat-deterministic predictions and this is only true in certain circumstances. We are neither high-frequency experts nor advocates. However, it does seem as though imbalances in the order book for a stock, say, can trigger predictable moves if the stock is pushed to a certain level. That's about it. As the investment horizon increases beyond a few seconds, accurate forecasts of asset price returns are out of reach. Most of us don't even know what our own utility function looks like, let alone someone else's. Alternatively, characterising the market risk aversion parameter, as in various incarnations of CAPM, requires a number of unverifiable assumptions. The original Black–Litterman model (1990), which combines CAPM with a set of investor views, makes the Herculean assumption that the long-term expected return of equities is known. Otherwise, it isn't possible to specify how investors collectively trade off return and variance. There is also the problem of non-stationarity. Individual asset distributions can vary quite dramatically over time and the correlation structure across assets is dynamic. Swiss equities might be highly correlated with oil in one regime and entirely uncorrelated in another.
We can follow a thread from astronomy to meteorology to finance. Planetary motions have been predictable with great accuracy over long timescales since the 1600s. Weather prediction allows for reasonably accurate predictions over horizons of about a week. While the forecasting horizon is not very long, it allows accurate warnings to be issued and precautions taken. In financial markets, however, things are not quite so simple over any discrete time horizon. Feedback is a near-intractable problem. Even if catastrophic sell-offs could be predicted over weekly horizons or longer, issuing a warning might have an unpredictable impact on investor behaviour. Some investors might start selling right away, leading to severe losses for others who decided to wait until the forecast date. Alternatively, Central Banks might take heed of the warning and act decisively, either averting or pushing the predicted crisis further into the future.
Specific market patterns and anomalies are unlikely to persist indefinitely in liquid markets. Eventually, other investors will cotton on to a scalable high Sharpe ratio strategy and trade the edge away. In the same way, if investors universally believed in a certain crisis prediction model, the timing and trajectory of crises would change as they acted upon the model. All that we can say is that when aggregate investor gearing is high and Central Banks are simultaneously applying the brakes, the probability of a sell-off is relatively high. In turn, it is well known that sell-offs can presage recessions. In summary, crisis prediction is a complicated brew of exogenous factors and positive feedback loops.
SUMMARY AND CONCLUSION
We have come to the end of our journey. Hopefully, it was an entertaining and instructive one. The narrative takes several twists and turns, which we review here. We first argued that sell-offs can come unannounced and that it is not clear whether any given one will follow through. Investors start to get panicky, margin calls are triggered and doomsday economists generate considerable air time. Cortisol levels are reaching unsustainable levels. The odds might be 4 out of 5 that everything will revert to normal and 1 out of 5 that things will get dramatically worse. In most cases, the initial sell-off in risk assets is met with strong buying. However, investors can't be certain what will happen next, so have to hedge or liquidate positions. Everyone is thinking that they need to hedge and this jacks up the price of insurance. At this point, what hedges can be placed that offer significant protection, yet are not egregiously priced? This is the vital question that we have tried to address. The central chapters of the book analysed specific strategies for hedging against a risk event. We delved into short 1×2 ratio spreads as a way to cover extreme event risk with low premium outlay. We also explored range-based hedges, such as spreads and non-centred butterflies, demonstrating how you could rotate from one to another as the market risk regime changed. We then focused on weekly options as the hedge of last resort. Our idea was that weeklies played a similar role to emergency loans provided by central banks, allowing you to stay in the game until market conditions stabilised. We also examined long-dated options as a value buying proposition, when the far end of the volatility term structure was relatively low. Later, we offered various perspectives on trend following as a protection strategy. Our tentative conclusion was that trend following offered less reliable protection than options, but was relatively cheap and likely to profit in a sustained bear market. We also tried to turn the problem on its head by investigating various contrarian strategies for making money after a sell-off. We ended with a wide-ranging though somewhat open-ended discussion as to whether crises can be predicted or even averted. In our opinion, that is a fitting end to the difficult and ever-changing problem of investing when the chips are down.
A secondary theme is that, philosophically, there is no universal solution to hedging or risk management. If everyone tries the same approach, it is almost guaranteed not to work over time. When using options as insurance, value is to be found in areas that the broader market finds uninteresting or in scenarios that are considered implausible. Trend following as a defensive strategy can be viewed as an adjunct to contrarian or “low-impact” (i.e. low vega) options strategies. Historically, at least, momentum-based systems seem to have worked particularly well during large-scale liquidations, without any direct volatility exposure. Investors have tended to forcibly push the market in a trend follower's favour as they unwind positions.
The level of demand for hedging strategies is highly time-sensitive. While there are legions of investors who are always “in” the equity market, hedging goes in and out of fashion through the market cycle. When equities and credit are quietly rising, many institutions frown upon the need for hedging. Knowing what to do when the need for insurance suddenly becomes apparent is a vital skill that can save large institutional portfolios from ruin. This all needs to be planned in advance. One has to be pragmatic. Mike Tyson has remarked that everyone has a plan until they get punched in the face and this seems relevant here. A reliable set of mechanical techniques, or “bag of tricks” is needed to respond appropriately in tough conditions. Imagination, technical skill and a decent amount of fun and amusement are necessary in the research phase. However, at the point where an emergency hedge needs to be placed, there should be minimal uncertainty about what needs to be done.
While we have written this book in an informal style, the reader should benefit from reviewing the specific options structures and trading strategies that have been presented. Investors who wind up outsourcing their hedging to an overlay manager will hopefully develop a feel for the range of exchange-traded strategies available. Back-testing extreme event hedging strategies will always be a challenge. Forecasting crises outright is at best an inexact science. However, by using a mixture of statistics, intuition and practical trading experience, it should be possible to justify the choice of a particular type of hedge for a particular situation. Ultimately, this book is based upon the realisation that most investors only want to hedge when they are already in trouble and responds accordingly. Relatively prudent investors might be faced with illiquid long positions that need to be hedged before they can be properly unwound. It focuses on ambulance-style strategies, designed to keep the patient going while doing minimal harm.