
Chapter 18
Control and Process
Management
Hold the Gains

DOING SOMETHING NEW AND DIFFERENT for a little while is usually not too hard. With a little extra effort, people will bend their habits to fit the solution and new practices put in place by your DMAIC team. But what often is hard is to continue using a new approach or solution. Old habits, as they say, die hard.
The purpose of Control is simple: once the improvement’s been made and results documented, continue to measure the performance of the process routinely, adjusting its operation when the data clearly indicates you should do so or when the customer’s requirements change. In this chapter we’ll look at how this simple concept can be implemented.
Lest there be any confusion, by “Control” we mean maintaining a process whose operation is stable, predictable, and meets customer requirements. Getting your process to this state is what DMAIC is all about. Without Control efforts, the improved process may very well revert to its previous state, undermining the gains you thought you’d achieved and making your work for naught.
1. Discipline.
2. Documenting the improvement.
3. Keeping score: establishing ongoing process measures.
4. Going the next step: building a process management plan.
Part 1. Discipline
Maintaining a stable and predictable process requires discipline at both the personal and organizational level. Let’s start with the latter. Unless the organization clearly rewards disciplined maintenance of improved processes and discourages “taking your eye off the ball,” individual employees will decide on their own if they want to measure and monitor process operations religiously. So discipline starts with the very processes whereby companies select, train, track, and especially evaluate and reward their own employees.
If disciplined and proactive processes are not in place, control of improved processes will be hit-and-miss, left to the individual employee and subject to luck, not skill. Occasional “rally the troops” meetings in which management exhorts employees to “be more accountable!” “pay more attention to detail!” and “shape up!” are often wastes of time. They provide a poor substitute for rewarding for people to regularly measure and analyze process operations. Instead, your organization should clearly identify a process owner, the person who is responsible for that process—not in the sense of doing all the work himor herself, but rather in the sense of making sure that the process is continually monitored, studied, and improved.
Discipline at the personal level is difficult unless you and every other person who works on the process understand the reasons and benefits for monitoring, control, and improvement. Without that understanding, gathering data and creating charts will be seen as busywork—and will become the tasks dropped off the “to do” list at the first sign of pressure. That’s why the organization should also make sure that employees are trained in the use of process management tools.
Part 2. Documenting the Improvement
Once the pilot phase of Improve is nearing completion and the improvement appears to be effective and sustainable, you need to make sure the improved process is thoroughly documented.
If you’ve ever left instructions for a house-sitter while you’re on vacation, you know how easy it is to give bad or incomplete directions. Did you think to let the sitter know how to tap the thermostat in just the right place to turn the air conditioning on (in case of a rare December heat wave)? Did you remember to mention that the hot and cold water faucets in the shower are backwards, or that the key to the front door is under the doormat by the side door?
Without good directions, house-sitters and inheritors of improved processes are in for a series of painful surprises. Documentation will help prevent those surprises, if you Keep It Simple, Please. Here are a few hints:
♦ Write clearly and use pictures—flowcharts, photographs, charts, and videotapes—whenever possible. Avoid jargon and technical terminology, unless you can correctly assume that the person looking after the improvement is as fluent as you are with “insider” language.
♦ When you’re unpacking the new computer, which one do you read, the two-inch thick manual or the 10-page “Highlights for Operating Startup”? (Or maybe you don’t read either one!) Keep it brief!
♦ Anticipate problems and warning signs that cropped up during the pilot phase. These are the document equivalent of those glass panels that say “Break in Case of Fire and Remove Axe.”
♦ If someone has to take the company shuttle over to the third floor of building 16 or spend an hour on the computer to dig out required procedures, they probably won’t bother, and undesired variation will creep back into the process.
♦ If the process is too complicated, people will stop updating what they’re doing, until what the documents say and what people actually do become very different things. Some companies handle this problem by having a department specially devoted to “documentation control,” but we recommend you keep control of documentation in the hands of people who actually manage the process and know what needs to updated or dropped.

See the Process Documentation Checklist on p. 355.
One last hint: your documentation is more likely to be used if those who will be using the documents help create them. Show rough drafts to people who work with the process every day and ask them for their input.
Documenting the Gas Extrusion Team Upgrade
Reducing the air bubbles in high-pressure hose manufacturing had been the project focus of the gas extrusion DMAIC team at Steinway Rubber Hose Company for the last six months. The team finally discovered why there was air mixing with the liquid rubber in the complicated machine that shaped and extruded a continuous stream of hose from its tungsten nozzle.
The team engineered and built a small device into the extruder that prevented any air from mixing with the liquid rubber. The new device needed some attention from the extruder operators, so the team wanted to make sure that the operators understood exactly what it was, why it was there, and how they could maintain its operation.
The team first put together a “home video” team explaining what they had done working on the project, plus a short section on how the device operated and kept air from mixing with and weakening the high-pressure hose. This video would be shown to all employees already on site, and to all new employees who worked the extruder.
On the extruder itself there was a large plastic-laminated card that had a series of colored photos showing how to operate the extruder, and drawing special attention to two digital screens on the extruder, one that warned when air was mixing with the rubber and another to indicate pressure inside the new device. The card included instructions on what to do if the screen showed a problem on the device itself.
There was also a computer terminal near the machine that gave information on the machine’s operation and possible problems and cures, as well as a space for people to enter ideas for improvements. The same computer could display control charts showing how the extruder was operating over time. All the extruder technicians practiced with the computer during training.
Over the next eight months of operation, there were only minor adjustments to the new device, and air bubbles stayed well below customer and safety requirements.
Part 3. Keeping Score: Establishing Ongoing Process Measures
Earlier in DMAIC, the team measured to define the problem, to count defects, to analyze for the cause of variation, and to gauge the success of improvements. In Control, the team must identify the key measures that will enable them and their successors to maintain and manage the process over time. How will the everyday people keep score? There are three obvious starting points where your team should look for measures:
a. Examine a SIPOC map of the improved process. As usual, customer requirements are the starting point. Obviously the Six Sigma team must measure process outcomes for conformance to customer requirements, defects, and process variation.
b. Decide which upstream process measures are linked to the improvements, measures that will predict problems downstream in the outputs. For example, if “on time” is a key customer requirement and process measurement shows that two of the key process steps are taking longer and longer, the team needs to find and eliminate the cause of the trend before it causes the output to be late—a defect.
c. Look at critical input measures that help to predict the quality of process steps and key outputs.
It may take a while in Control to nail down the chain of measures that best characterize the process. Once established, this chain becomes the basis of a scorecard monitored on a regular basis (each day or month, for example) by whoever “owns” the team’s improved process.
Charting the Data
Knowing what you want to measure is half the battle when it comes to maintaining a high-performing process. The other half is defining when and how those measures will be gathered and what to do in response to the data.
To get started, have your team review the new SIPOC of the improved process and discuss:
♦ How will we get feedback from a representative cross-section of customers of this process? (Feedback should not be limited simply to happy customers or chronic complainers.)
♦ Where exactly will measures be taken?
♦ How difficult will it be to collect data?
♦ How will measurement data be displayed?
The decision on how to display data depends on what you want to show and who wants to know. Charts already discussed in this book—run charts, histograms, Pareto charts—can be used to summarize and analyze measurements.
There is one other power tool that is extremely useful at this stage: the control chart, a type of souped-up run chart that provides additional ways to detect abnormal variation.
Control Charts
Claims at Safest Insurance
Mel is the manager of an insurance claims office and serves on a Six Sigma team that recently made improvements aimed at speeding up the number of claims processed per hour. He volunteered to establish a method for the team and process owners to monitor claims-per-hour.
To get started, he gathered data for just over a month (using good sampling methods, of course!) and plotted the data in time order on a run chart similar to the ones seen in Chapter 13. Figure 18.1 shows his first chart.
Based on the tests Mel had learned earlier to detect special causes on a run chart, he didn’t notice any patterns that would require action. But then an Master Black Belt showed Mel how to determine the expected amount of variation in the claims process, and to plot the resulting “control limits” on the chart (see Figure 18.2).
When looking at this new control chart, Mel saw that early in his data collection effort, one data point was beyond the upper control limit—that means it could not be explained by common cause variation. With this extra information, he knew the claims process wasn’t quite as “in control” as everyone hoped—there was still unpredictable variation appearing.
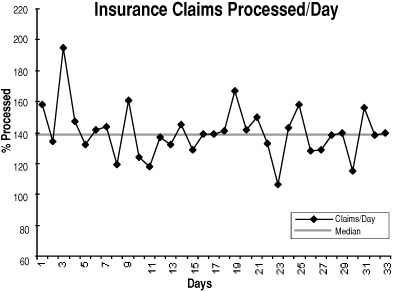
Figure 18-1. Run chart of insurance claims
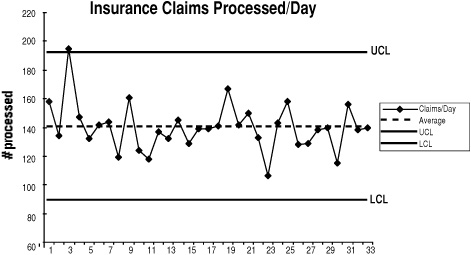
Figure 18-2. Control chart of insurance claims
As Mel discovered, control charts are even more powerful than run charts in detecting special cause variation. The control limits the Master Black Belt helped him calculate—approximately three standard deviations on either side of the average—provide the basis for judging more quickly when certain types of special causes have appeared. You can apply all the same rules that you apply to run charts (see Chapter 13, Table 13-2; remember to skip the points on the median) ...
♦ Nine points in a row on one side of the average line.
♦ Six points in a row increasing or decreasing.
♦ Fourteen points in a row that alternate up and down.
... Plus several more that are based on dividing the control chart into “zones” of standard deviations (see Figure 18-3). If the data is normally distributed (as it should be in most “in control” processes), a bit more than 34% of the data points will fall in each Zone C (within one standard deviation of the average), about 14% in each Zone B (between one and two standard deviations), and a little over 2% in each Zone A (between two and three standard deviations). When a process is out of control, points can fall outside the control limits (the most familiar of the control chart tests), bunch together in Zones B or A, bounce back and forth across several zones, or even “hug the centerline” (that is, cluster in Zone C). The specific rules and their interpretation are given in Chapter 19.
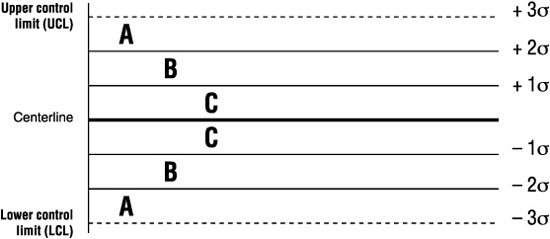
Figure 18-3. Control chart zones
Finding any of these patterns or signals in your data means something unusual is affecting the process and should be investigated. Once the cause is discovered and removed, the process should return to normal variation within the control limits.
Customer Requirements and Control Limits
Beware! Many people think that if process data stays within the control limits, the process is producing good outputs for its customers. Wrong! Control limits are calculated from the process data. Customer requirements or specifications come from the customer and have nothing to do with statistics. In other words, control limits simply show the natural variation of the process as it now exists, which could be very different from what the customers require.
For example, an auto repair shop could use a control chart on its oil change process and find that it is in control (no signs of abnormal influences), but takes an average of 49 minutes to do an oil change when customers have been promised their cars back in 30 minutes!
The goal of the Six Sigma team, then, is to maintain a process that is “in control” and predictable, and meeting or exceeding customer requirements.
Putting Control Charts into Action
Choosing the right control chart is not difficult; most guidebooks to Statistical Process Control (SPC) can guide the Six Sigma team to the right one. The trick with control charts is to use them to trigger improvements if something unusual is happening to the process. Too many businesses, sadly, construct control charts and then file them away, without taking action when needed.
One other warning: control charts are only as good as the data going into them. From time to time, whoever is managing the process needs to test the validity, reliability, and repeatability of the data collection methods being used to collect data. (These issues were discussed in Chapters 5 and 9.)
See Control chart descriptions in Chapter 19, pp. 354-361.
Part 4. Going the Next Step: Building a Process Management Plan
Having monitoring and measures in place is just a prelude to actually using process performance data in an ongoing management effort. A key element in that management activity is a process management plan (a portion of which is shown in Figure 18-4). Even a good process may have its problems. Having a warning and response plan to use if problems occur is part of the overall Six Sigma “Be Prepared for Problems” proactive stance. The process management plan covers the following:
♦ Current process map. The manager of the improved process needs to see at a glance the flow of activities and decisions in the process. A concise process map provides this visual aid.
♦ Action alarms. Develop a process response plan that clearly marks the points in the process where measures can take the pulse of inputs, process operation, and outputs. With thresholds indicating when the quality of any of these is degrading, the process response plan lets the process manager know when to take action. For example, the failure to complete three customer orders on time could signal the need to go to a contingency plan for deliveries.
♦ Emergency fixes. Once an action alarm goes off, it’s important to have emergency fixes or back-up plans already spelled out so that employees don’t have to improvise them. Contrary to the old saying, very few people work well under pressure.
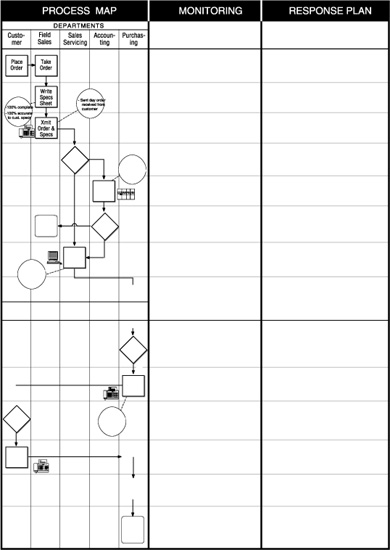
Figure 18-4. Portion of a Process Management Plan
See the Process Management Chart on p. 362 and the Response Plan Worksheet on p. 363.
♦ Plans for continuous improvement. By tracking the occurrence of problems in the process, the process response plan also gives a basis for deciding on the need to have a Six Sigma team overhaul weak parts of the process. Once enough process response plans are in place, and information from them is collected and analyzed, managers will have an extensive pool of projects to be attacked by future Six Sigma teams.
Another tool that aids in process management is called a process dashboard. You may be familiar with dashboards used at executive levels of management, where they serve to summarize a number of indicators of organizational health. The principle is the same here: you identify a handful of indicators that relate to the most important operational aspects of your process. Often, they include an output measure (such as customer satisfaction), an indicator related to speed or efficiency (such as cycle time), and some measure of process quality (perhaps defect levels).
See the Process Dashboards on pp. 364-365
Ending the Project
As tired as team members get of the project, sometimes it’s hard to bring everything to a close. After all, by this time most teams have a high level of camaraderie and are likely working very well as a unit. Still, even good things must come to an end. In this case, that means:
1. Completing your storyboard.
2. Preparing for the final tollgate review.
3. Celebrating the end!
Completing Your Storyboard
The final stage, Control, usually contains an updated process map and some of the control or other charts that will be used to make sure the improved process doesn’t degrade to its original state once the team has finished the project. The latest sigma calculation can appear here. The name of the “owner” or manager of the improved process is also displayed here.
Preparing for the Tollgate Review
Often times, an organization may invite people to the final review who have not attended previous reviews and therefore may not know much about the project. You’ll need to find out if this is the case in your organization so you know whether to include a overall project summary in your presentation.
In addition to describing the result of your Control work, make time in the presentation for two other key items:
♦ Lessons learned: about the project; the process, product, or service; the company’s customers; working on a Six Sigma team, etc.
♦ Opportunities not addressed in the project: For Six Sigma teams who find that …
– they can’t resolve all the causes that contribute to the problem identified in their charter (some causes may have been beyond the authority of the team) or
– they learned things during the project that exposed additional opportunities for improvement.
Be sure to summarize these opportunities for management.
The Final Celebration
The last team celebration can be a private affair within the team, or your team can use it as a way to acknowledge the support they received from people who were not official team members. (The latter strategy will help build goodwill and support for Six Sigma projects within the organization!) Either way, don’t let the project drag on unnecessarily.