
Chapter 19
Power Tools
for “Control”
Keeping Things on Track

AS NOTED IN CHAPTER 18, there are four elements of Control:
1. Discipline.
2. Documenting the Process.
3. Ongoing Process Measures.
4. Completion Checklists.
There’s no tool that can help you with discipline—that depends largely on how committed your organization is to continuously doing a better job of meeting customer needs. In contrast, there are very specific tools for the other three elements of Control. All of them build on concepts covered earlier in this book, such as…
♦ Using process maps (flowcharts) to document procedures.
♦ Using data to monitor performance.
♦ Being proactive in planning for potential problems.
♦ Assigning specific responsibilities for performing the work.
While these principles have been present in quality improvement efforts for decades, what makes the difference here is that they are captured in practical tools your team and coworkers can use on the job to make sure the ideas are acted on.
Tip: Some of these methods will seem cumbersome at first because this level of devotion to process efficiency and effectiveness isn’t present in many organizations. Just be aware that you might encounter some resistance or reluctance to use the tools described here—in fact, you yourself may not be convinced that this detailed attention to process performance is worth it! But keep at it, and you’ll see that the results are worthwhile; your organization will keep getting better and better at maintaining the gains achieved by projects like yours, and may even see continuous improvements.
Documenting the Process
Process Documentation Checklist
Purpose: To increase the chances that process documentation will be both useful and used.
Application:
♦ Use in Control to ensure that improvements are maintained.
♦ Use whenever a process lacks documentation, or the process changes.
Instructions:
Review the checklist shown in Figure 19-1 as you create and use your process documentation.
Ongoing Process Measures
Control Charts
Purpose: To monitor a process for quick detection of abnormal variation (see Figure 19-2 for an example).
Application:
♦ Use in the Control phase of DMAIC to establish an ongoing method for monitoring process performance.
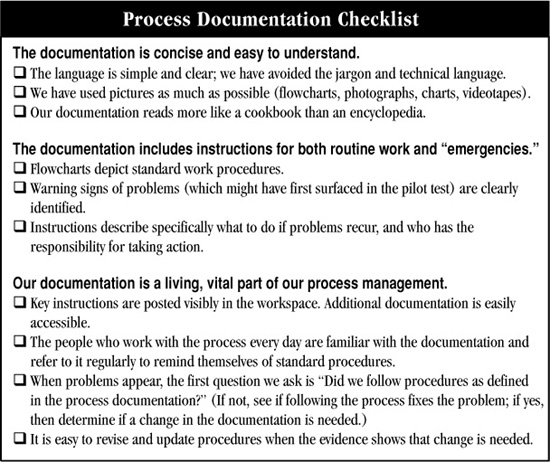
Figure 19-1. Process Documentation Checklist
Control Chart Basics
♦ The term “control chart” refers to any of a half-dozen or more types of charts that display the following features (see Figure 19-3):
a. Data points plotted in time order. These data points can be either continuous or discrete (attribute) data. Each data point can represent either an “individual” measurement (such as plotting the completion time for each contract) or a calculation based on multiple data points (such as plotting the average completion time per week or the percentage of defective products per batch).
b. A centerline (CL), which is usually the average. (Run charts, in contrast, often have the median plotted, not the average.)
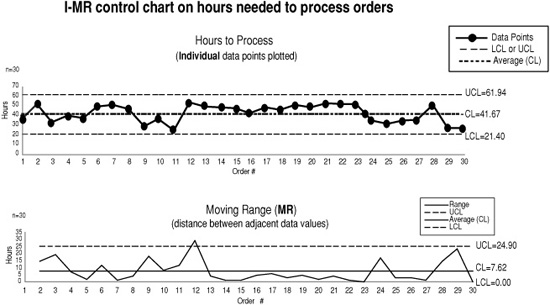
Figure 19-2. Sample Control Chart
This is an I-MR chart, charting of “individual” data (single measurements on individual items) and moving ranges (the differences between adjacent data points).
c. Control limits (UCL and LCL) that represent the amount of expected variation in the data. By statistical convention, they are plotted at approximately three standard deviations from the average. The control limits reflect the process capability: how well the process will perform, day in and day out, given the way it is currently structured and implemented (providing, of course, that there are no special causes of variation present).
♦ There are different ways to calculate the control limits depending on the type of data you have.
♦ The purpose of using control charts is similar to the reasons for using run charts: there are patterns you can look for that will tell you when the process is “out of control” (that is, exhibiting special cause variation).
♦ In many cases, you’ll be using a statistical program (such as Minitab) to create a control chart for you. However, if you haven’t used control charts before, consider doing a simple one by hand to help you become familiar with its features and underlying statistical principles. You should also keep hand-drawn charts by workstations where it is helpful to plot each data point as it is generated. That way, employees can just pencil in the next point, then get back to their other work.
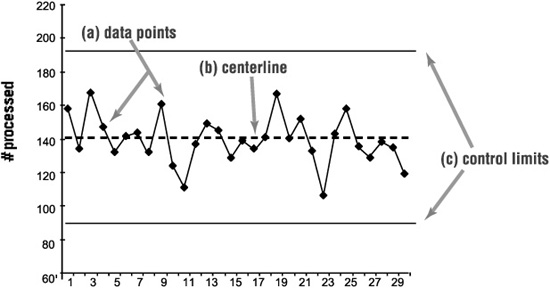
Figure 19-3. Features of a Control Chart
♦ What will be important is for you to understand how to collect the data used for the control chart.
Instructions: Providing detailed instructions for creating all the various types of control charts is beyond the scope of this book. Here is a quick overview of the basic procedure.
1. Determine what kind of data is most relevant to your project, then review Figure 19-4 and Table 19-1 to determine what type of control chart is appropriate for that data.
2. Collect the data.
♦ Use information from Chapters 9 and 10 to develop useful data collection sheets. This is necessary even if the control chart will be created by a computer program.
3. Plot the data in time order just as you would for a run chart.
♦ If using a computer program, make sure you review how the spreadsheet will interpret the data so you enter it correctly.
♦ If working by hand, aim for a chart that is approximately 2 to 3 inches tall and as wide as necessary to accommodate all your data. You can use either regular graphing paper or special SPC (statistical process control) worksheets.
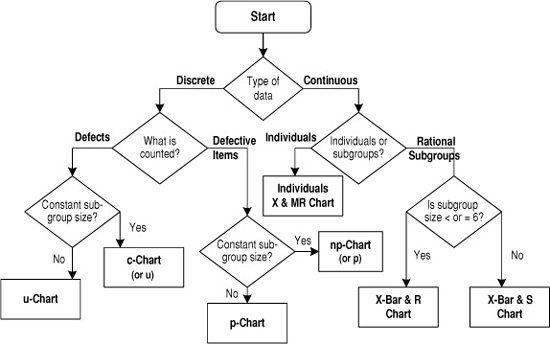
Figure 19-4. Control Charts Selection Tree
4. Calculate and plot the centerline and control limits on the chart.
♦ The calculations and plotting will be done automatically if you are using a statistical software program.
♦ If you are doing this by hand, ask a Black Belt or Master Black Belt for help in determining the appropriate calculations for your type of data.
5. Apply the special cause tests to monitor process performance and determine if and when special causes appear (see Tables 19-2a and 19-2b).
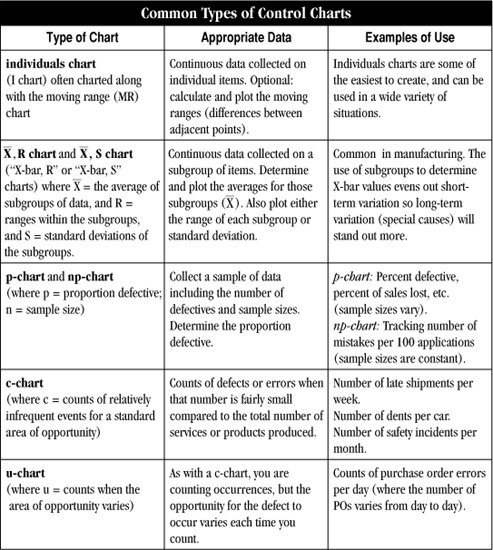
Table 19-1. Overview of common types of control charts
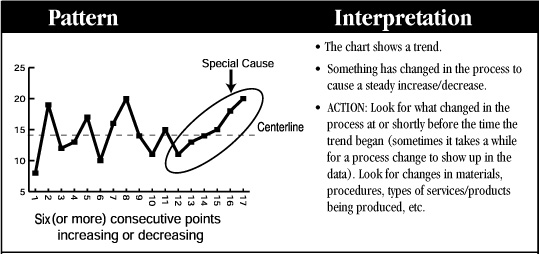
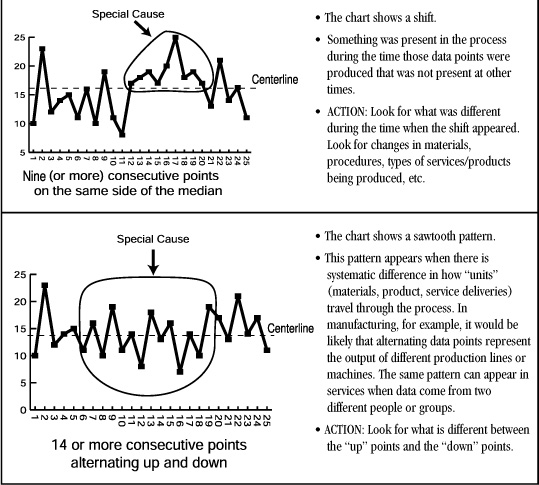
Table 19-2a. The tests for special causes used for run charts can also be used on control charts. (This table is similar to that seen in Analyze Chapter 13.)
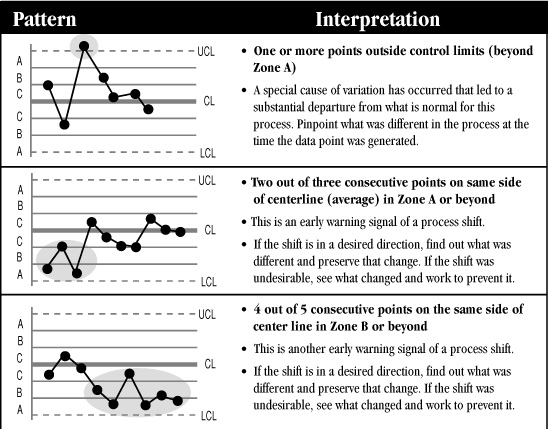
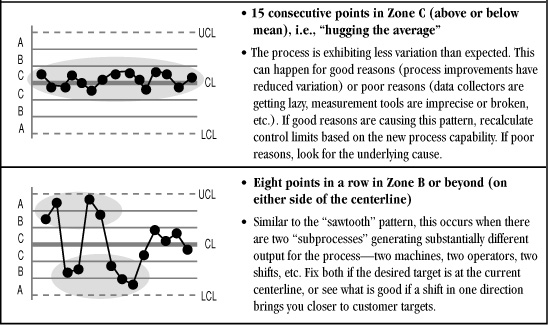
Table 19-2b. Additional special cause tests for control charts (See Chapter 18 for an explanation of “zones.”)
Process Management Chart
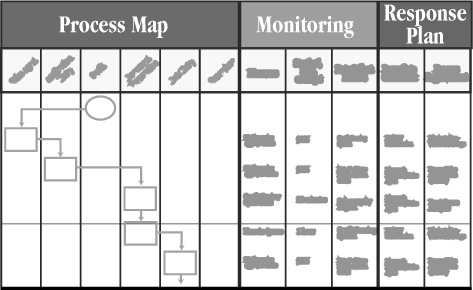
Figure 19-5. Format for a Process Management Chart
Purpose: Maintain a smoothly operating process.
Application: Use to monitor any key process in your organization.
Instructions (see Figure 19-5):
1. Create a process map for the process to be controlled. (You may have already done this as part of your Improve work.)
♦ Use either a detailed flowchart or a deployment (cross-functional) flowchart (see pp. 262-264). A cross-functional chart will help you track what person or group is responsible for various process steps.
2. For each critical step in the process, describe a monitoring plan. How could someone tell whether or not it was done correctly? Decide …
♦ What data or observations should be tracked.
♦ Who will collect the data/information and how.
♦ How it will be charted and who will chart it.
♦ How the information/data will be used.
3. Develop a response plan for each monitoring action. Identify how people should respond if they discover problems.
♦ What should people do if they find a problem?
♦ Use the Response Plan Worksheet (Figure 19-6). If the descriptions of the responses are complex, keep the complete response plan as a separate document and just cross-reference appropriate sections on the Process Management Chart.
Response Plan Worksheet
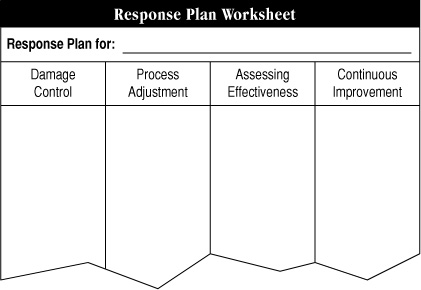
Figure 19-6. Format for a Response Plan Worksheet
Purpose: To minimize the harm from unanticipated problems by providing for immediate responses.
Application: Use as part of a complete process management process.
Instructions (see Figure 19-6):
1. Clarify what problem or set of problems is covered by this response plan.
2. Focusing on that specific problem, identify…
♦ Damage control measures: What should people do first when they notice a problem in order to prevent it from affecting customers?
♦ Process adjustments: What can be done to adjust the process to counteract the problem?
♦ Assess effectiveness: How you will be able to tell if the process adjustments are effective. What will appear or disappear in the data charts, for example?
♦ Continuous improvement: How what you learn about this problem can be captured and incorporated into permanent process changes so it won’t appear again.
3. Assign responsibilities for acting on each of these response measures.
Process Dashboards
Purpose: Monitor the most important indicators of quality, cost, and effectiveness associated with a key process, product, or service.
Application:
♦ Linking together the key measures that allow for monitoring of all aspects of a process (inputs, process steps, and outputs).
Instructions (see Figure 19-7):
1. Identify the most important monitoring points in your process.
Hint: Use the SIPOC map developed in the Define stage. Identify what you could measure on inputs, process steps, and outputs.
2. For each monitoring point, identify appropriate measures and develop data collection plans. Decide how the data will be charted.
3. Identify acceptable performance levels or improvement targets.
♦ Think about the gauges on a car dashboard. If your car is operating well, there are acceptable limits for temperature, oil pressure, engine speed, gas consumption, etc.
♦ If your purpose is to drive further improvement, identify a measurable improvement target (e.g., a certain level of defects, desired cycle time, etc.).
4. Develop methods for creating and maintaining the dashboard.
♦ Imagine you have the data in hand. Who will update the chart? How often?
♦ Where will the dashboard be posted?
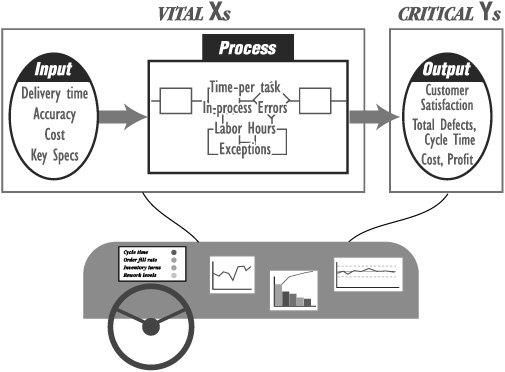
Figure 19-7. Process Dashboard
5. Discuss and confirm how the dashboard will help you manage the process.
♦ How will the dashboard be used (e.g., reviewed at a monthly group meeting)?
♦ What will happen as a result of having the dashboard?
Completion Checklists
Control Checklist
Purpose: To bring a formal end to the Control stage of a team’s project.
Applications:
♦ Use during the Control work to track progress.
♦ Use at the end of the Control stage to make sure all essential tasks have been completed.
Instructions (see Figure 19-8):
1. Walk through this checklist item by item at a team meeting.
2. Mark a “yes” only if everyone on the team agrees the task has been completed. If anyone says no, ask him or her to state why they think the task is incomplete.
3. Reach agreement as a team on each answer before it is marked on the checklist.
4. If there is unfinished work, ask for volunteers, assign responsibilities, and set deadlines for completion of those tasks.
Control Tollgate Preparation Worksheet
Purpose: To help a team prepare a presentation for the Tollgate Review at the end of the Control stage.
Applications:
♦ Use at the end of the Control stage to help the team prepare its presentation.
Instructions (see Figure 19-9): Follow the general tollgate guidelines given for the Define review (pp. 118-120) to identify the priority message to include in your presentation. In addition:
1. Document any commitments or promises the team made to the Sponsor/Champion, Ladership Council, etc., during the Improve Tollgate Review.
2. Compile information to document progress on meeting those commitments.
3. Develop graphics or other visual aids that summarize measures you have put in place that will ensure ongoing monitoring and feedback from the process, as well as what response plans exist for dealing with problems.
4. Have your team summarize the lessons they’ve learned from the project as a whole.
♦ What they learned about this process, product, or service that represents new knowledge to the organization.
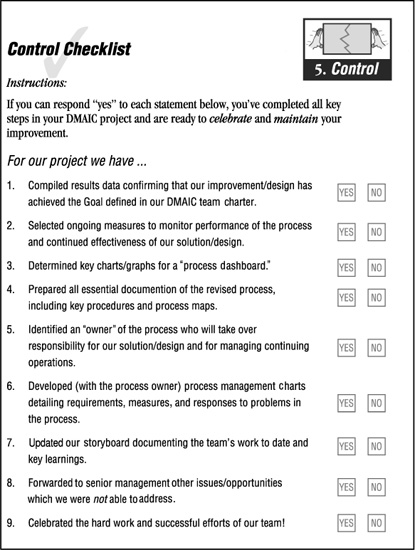
Figure 19-8. Control Completion Checklist
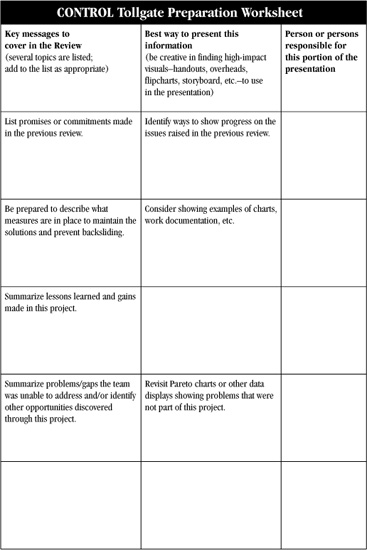
Figure 19-9. Control Tollgate Preparation Worksheet
♦ What they know about your organization’s customers that they didn’t know before.
♦ What they learned about participating in a Six Sigma project, and advice they’d have for others in a similar situation.
♦ What they learned that they will be able to apply in their daily work.
5. Identify any opportunities for improvement that were not addressed in the project.
6. Complete the rest of the worksheet and prepare an agenda as you have for other tollgates.