Chapter 6
Business Model Evaluation
Some businesses simply have better business models than others. If you want examples of companies having solid business models, the Forbes 400 list of richest Americans is a good place to start. The businesses behind the Forbes 400 list have historically possessed some of the finest models going. Not only do their V-Formula variables work in concert to deliver high equity rates of return, but the businesses are universally highly scalable. More than just scalable, they often have high levels of operating leverage, which means they can grow their impressive businesses with minimal amounts of added business investment. Finally, they can also use their scalability to address extremely large market opportunities, offering high levels of corporate growth potential. For many of them, the business investment was low to begin with and the equity investment even lower, which meant that it was easier for the founding team to keep much of the equity in the businesses that they created. Companies having the best business models generally have the potential to deliver high current equity rates of return, and can do a lot of whatever it is that they do with a great deal of business investment efficiency.
Of course, getting on the Forbes 400 list of richest Americans is hardly the only measurement of financial success. For that, the bar is substantially lower. There's “rich” and then there's “insanely rich.” While successful restaurant operators, as in our case study, can become very wealthy, they cannot ordinarily expect to make it to the Forbes 400 list of the insanely rich.
A significant drawback of restaurant business models is that operations tend to have scale limitations, with little in the way of operating leverage. However, the returns can still be attractive, and there is the potential to create material amounts of shareholder wealth. As a result, there are plenty of restaurant professionals within the top 1% of American earnings and wealth.
STORE Capital
I have been fortunate to take public and help guide three New York Stock Exchange listed real estate investment trusts, most recently STORE Capital, where I was the founding chief executive officer for a decade following our 2011 inception. Real estate investment trusts (REITs) are simply companies that invest in real estate or real estate mortgages and pay no corporate income tax. Instead, the income we produce is taxable at our shareholder level, which is more efficient than most public companies who both pay corporate taxes and then have the dividends they pay subject to further individual taxation. The price we pay for this efficiency is that we need to follow several rules, the biggest of which is that we are required to pay out 90% of our taxable income in the form of shareholder dividends. At the end of 2019, we owned close to $10 billion in real estate, which was leased on a long-term basis to profit center tenants nationwide. During 2019, our corporate ratio of sales to business investment approximated .08, or 8% (this was our lease yield from our tenants). Our OPM amounted to about 40% of business investment, our maintenance capex was minimal, and our interest rate on the cost of borrowings (our sole source of OPM) was around 4.3%. While none of these variables stand out as that exciting, net lease companies have some of the highest operating profit margins around. Our 2019 operating profit margin was about 93%. String that all together in the V-Formula and our current rate of return on equity at cost is about 10% as follows:
Our total rate of return was slightly better than 10% because our contractual annual tenant rent increases came in at close to 2% annually. If I use the Gordon Growth formula and add the 2% contractual growth to the initial 8% yield, the total ROE rises to over 13%.
There are three other adjustments that can be made.
First, companies like STORE can expect to have losses arising from tenant nonperformance, which will be a drag to returns.
Second, in most years STORE was typically able to raise ROE growth by selling some of our real estate to investors happy with lower yields, and then reinvesting the money at higher current rates of return.
Third, good net-lease companies historically trade for values in excess of their underlying real estate value. I tend to view this as akin to good bank stocks, which tend to trade at values in excess of their equity at cost (this is often called “book equity”). Because STORE tended to trade at a premium to its cost, the company had the ability make an added return for its existing shareholders who participated in the spread arising from new share issuance and borrowings that had a current lower cost to STORE than the yields on the assets purchased with the money. This type of growth is referred to as “external growth,” because it is enabled by newly issued equity.
For STORE and other REITs to materially grow, they need to issue new equity, since the REIT dividend requirements limit their ability to retain, reinvest, and compound corporate cash flows. During my tenure at STORE, the net expected investor return from all our activity typically amounted to around 12.5% or better annually. Assuming investors would be happy with an annual return of 9% (this approximated the 20-year annual rate of return for the FTSE NAREIT All Equity REITs Index through 2020), our EMVA from the new investments would amount to about 39% on the equity we annually deployed (12.5% ÷ 9% – 1). That equity is comprised of newly issued shares, the free cash we retained, and the recycled equity from property sales. With EMVA creation potential of nearly 40% on newly deployed equity, STORE's business model has historically been potent, while having a solid margin for error to cushion from EMVA loss.
The table that follows illustrates STORE's EMVA performance between the company's 2014 initial public offering and the end of 2019. Over that five-year period, EMVA averaged better than 40% of STORE's equity at cost. When analyzing annual EMVA growth relative to annual equity growth at cost, the median EMVA contribution was just over 30%. For the first four years, STORE's stock price relative to its reported adjusted funds from operations remained relatively stable and in the middle of our peer group, meaning that the EMVA contribution was driven by a strong business model. In 2019, STORE benefited from an elevated share valuation which served to increase EMVA. For investors, an important question to ask is to what degree is EMVA creation owed to a compelling business model, versus business valuation multiples reflecting optimistic future business model aspirations.
Looking at compound annual EMVA growth is less useful for a relatively young company like STORE. For more seasoned companies, leadership will tend to look to stability in this metric. Over time, both these important metrics should tend to be reflective equity return performance delivered by a company's potent business model fundamentals.
| STORE Capital EMVA Creation Performance | ||||||
|---|---|---|---|---|---|---|
| ($000’s) | ||||||
| Year | Equity at Cost | 2019 Weighting | Equity Market Capitalization | EMVA Created | EMVA % of Equity at Cost | Compound EMVA Growth |
| 2011 | $ 256,968 | 9 | ||||
| 2012 | $ 673,252 | 8 | ||||
| 2013 | $ 794,523 | 7 | ||||
| 2014 | $ 1,697,879 | 6 | $ 2,489,743 | $ 791,864 | 46.6% | 23.0% |
| 2015 | $ 2,290,096 | 5 | $ 3,267,923 | $ 977,827 | 42.7% | 18.4% |
| 2016 | $ 2,851,293 | 4 | $ 3,937,340 | $ 1,086,047 | 38.1% | 14.4% |
| 2017 | $ 3,700,316 | 3 | $ 5,045,689 | $ 1,345,373 | 36.4% | 12.3% |
| 2018 | $ 4,602,013 | 2 | $ 6,258,544 | $ 1,656,531 | 36.0% | 11.0% |
| 2019 | $ 5,402,340 | 1 | $ 8,931,005 | $ 3,528,665 | 65.3% | 16.8% |
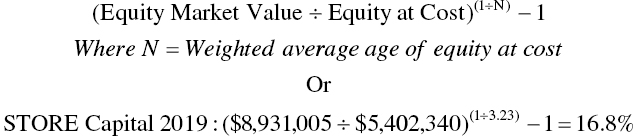
The formula for determining compound EMVA growth is shown below and requires that you compute the weighted age of the company's equity, which will tend to be less than its chronological age. In the case of the STORE table above, you simply multiply the company's equity at cost in each year by its weighting, which is the amount of years that equity has been imbedded in overall company equity at cost. Then, for 2019, you sum up the resulting nine products and divide that amount by the sum of the nine year-end company equity balances at cost to arrive at a weighted average equity age. In the case of STORE, rapid company growth and equity issuance caused the average equity age at the end of 2019 to be just 3.23 years old, or far younger than the company's actual nine-year age.
Compound EMVA Growth Formula
There were a few REIT founders in the 2021 Forbes 400 list of wealthiest Americans, but none whose fortunes were centered in that activity. STORE had an incredibly solid business model capable of creating copious EMVA, but it was simply not good enough to propel any of our founders to the illustrious Forbes list. The returns are too low (well below that of our restaurant case study), the company has little operating leverage (the delivered cash flow growth per share is aided by constantly raising new equity, diluting shareholders to make new investments), there is scant scalability (how do you improve on a 93% operating profit margin?), there are constraints on the ability to use a high portion of OPM (our OPM mix was limited by credit rating constraints to approximately 40%).
(Contrast STORE with Microsoft, which went public in 1986 with revenues below $200 million. By the end of 2019, revenues had grown to over $125 billion, and the company had not issued a single added share to the public to get there.)
Finally, STORE's business investment requirement was simply too high. The real estate the company owns and leases to its tenants is expensive. This meant that to start STORE, we needed to raise a lot of money from institutional investors. Having had to trade away so much of our company to the founding institutional investors who made our business possible resulted in the founders having a very low share of personal ownership. At the end of 2019, I owned well less than 1% of our stock.
Fortunately, STORE addresses a very large market, which enabled us to materially grow the company to become a large enterprise. So, while STORE's business model had wealth creation limitations for its founders, our solid business model, coupled with the size of the company, allowed our leadership to be well within the top 1% of all Americans in terms of income and wealth. We are financial success stories.
The FAANGs
By now, you are probably forming an idea of the characteristics of a solid business model. And it should be crystal clear to you that EMVA, which lies at the root of meaningful wealth creation, can be created from many different business models. Here is my take on what makes the best business models:
- Capital stack. The best business models generate the highest current rates of equity return with the least use of OPM. If you are looking at a group of companies, create V-Formulas for all of them and then set OPM to zero and equity to 100%. Using OPM adds risk to the equity investors of a business because OPM has a payment priority over equity investors. Setting OPM to zero forms the most conservative capital stack, which now is 100% equity. Setting OPM to zero also allows you to compare raw business models without the benefit of OPM in their capital stacks.
- Equity efficiency. The best business models have the highest ratio of operating profitability to business investment, which means that they are the most efficient users of equity. The more equity efficient a company, the less its founders will lose to others when seeking added equity to fund growth. Members of the Forbes 400 tend to own high percentages of the companies that lie at the root of their wealth.
- Growth with a proven business model. The best business models tend to have the highest growth potential. For a value investor like me, growth represents risk, so it helps to have growth with a business model that is already proven to be potent. Growing into a potent business model is a strategy that many businesses follow, but which is subject to elevated risk. From the dot-com boom and bust of the late 1990s to technology companies 20 years later, any number of public companies, having no income, have issued vast quantities of stock. Buyer beware! There is indeed risk associated with making investments in companies having limited earnings and unknown business models.
In 2013, Jim Cramer, host of the nationally televised CNBC show Mad Money, coined the acronym FAANG to refer to five high-growth companies that had been collectively responsible for a disproportionate share of stock market returns. By the end of 2019, those companies—Facebook, Apple, Amazon, Netflix, and Google—had collective market valuations totaling $3.9 trillion, or better than 11% of the value of all publicly listed US equities.1 To place this amount into context, were FAANG a country, it would have been the world's tenth largest economy, situated just behind Canada.2
Two years after Cramer coined the FAANG acronym, Google changed its corporate name to Alphabet, which happened in concert with its transition into a technology conglomerate. The name change did not matter. The FAANG moniker stuck, and the stocks performed. In fact, over the 10-year period between 2009 and 2018, when looking at the broad market of all US publicly listed companies, the FAANGs, which delivered a better than 30% yearly return over the decade, accounted for just over 6% of total investor rates of return across the thousands of publicly traded companies.3
While impressive, this is actually not unusual. Over a longer 25-year period ending in 2018, just 10% of companies delivered approximately 60% of total investor returns.4 This fact illustrates why most investors cannot beat the market and tend to be better off investing in broad index funds; they inevitably miss out on most or all the 10%. This fact also illustrates how impressive are the track records of investors like Warren Buffett, who have shown that they can beat the market over a long period of time.
Here is what the 2019 V-Formula looks like when applied to the FAANG stocks:
| Apple | Amazon | Netflix | |||
|---|---|---|---|---|---|
| Sales/Business Investment | 0.57 | 0.93 | 1.35 | 0.77 | 0.57 |
| Operating Profit Margin | 50.9% | 32.9% | 17.1% | 16.9% | 70.8% |
| % OPM | 8.5% | 46.5% | 40.6% | 69.9% | 15.4% |
| OPM Interest Rate | 6.0% | 1.0% | 6.2% | 4.6% | 5.4% |
| CapEx/Business Investment | 9.8% | 4.3% | 6.2% | 0.7% | 7.0% |
| 2019 Pre-Tax ROE | 20.8% | 48.5% | 24.0% | 30.2% | 38.2% |
| After-Tax ROE (Using Reported Tax Rate) | 15.5% | 40.8% | 19.9% | 27.3% | 36.0% |
When you are wading through the public financial information of very large companies, the exercise will be imperfect, but will not be that far off. You may be thinking, for instance, that these companies can generally borrow at cheaper interest rates than I've shown, and you would be right. However, they also lease real estate, in some cases a lot. I ignore non-cash assets and liabilities, such as “the right to use,” and concoct my own estimate. Here, I divided the annual lease expenses by my estimate of a lease rate (I used 6%) in order to approximate the value of the employed real estate that they lease but could have potentially owned. The rate I selected is based on long-run reported net lease transaction averages. For capex, I averaged the companies' annual capex over the past three years, which was derived from their respective statement of cash flows. The amount I used is probably excessive, since much of the capex they report enables them to grow and is not simply maintenance capex. In determining cash operating profit margins, I backed out the non-cash stock-based compensation. But if you look at the statements of shareholder equity, you can figure out that the equity dilution from employee stock awards tends to range from roughly .5% to 1.5% annually, which you can simply strike from the current pre-tax equity rates of return.
Finally, the reported income tax rates of the five companies varied from a low of 6% for Google to a high of about 25% for Facebook. These are excluded from the V-Formula and would lower the current equity returns of these tax-paying companies illustrated in the above table.
The impressiveness of the FAANG group is partly evident in the sheer amount of cash on their balance sheets. Elevated cash balances are a two-edged sword; they give investors comfort but depress returns because they inflate the business investment V-Formula variable. At the end of 2019, Netflix was sitting on just over $5 billion, which was the lowest cash balance of the five. Apple reported over $200 billion in cash, Google over $100 billion, and Facebook and Amazon over $50 billion each. If you were thinking about how many days of sales their cash represents, the answer would be:
| # Days Sales in Cash | |
|---|---|
| 12-31-2019 | |
| Apple – 288 | Netflix – 91 |
| Facebook – 283 | Amazon – 71 |
| Google – 270 | |
If I were to make all the FAANGs have Amazon's 71 days of sales in cash, the revised V-Formula would suggest the following current pre-tax equity returns.
| Adjusted for 71 Days Sales in Cash | Apple | Amazon | Netflix | ||
|---|---|---|---|---|---|
| Sales/Business Investment | 0.86 | 2.11 | 1.35 | 0.80 | 0.82 |
| Operating Profit Margin | 50.9% | 32.9% | 17.1% | 16.9% | 70.8% |
| % OPM | 12.8% | 105.0% | 40.7% | 72.9% | 22.3% |
| OPM Interest Rate | 6.0% | 1.0% | 6.2% | 4.6% | 5.4% |
| CapEx/Business Investment | 14.6% | 9.7% | 6.3% | 0.7% | 10.1% |
| 2019 Pre-Tax ROE | 32.7% | ∞ | 24.0% | 35.0% | 60.2% |
With the reduced business investment arising from lower cash balances, the FAANGs (excepting Amazon) all post better ratios of sales to business investment.
Also helpful in the elevated current ROE computations is keeping the use of OPM constant. We're doing this exercise for illustrative purposes, and such an elevation in the use of OPM may not be realistic because corporate access to borrowings and the corporate cost of borrowings may be facilitated by having large cash balances. In fact, the reduction in Apple's cash balances is so material it causes OPM to actually exceed total business investment, allowing the company to realize Mort's Model! The one drag from reducing cash balances is in the form of capex, which stays constant and is therefore higher as a percentage of the reduced business investment.
Each of these companies is impressive, producing high levels of current equity rates of return, together with the historic growth and return compounding typically delivered by scalable business models. Large amounts of cash on the balance sheets of Apple, Google, and Facebook served to materially elevate their business investments and depress returns. The cash also poses an investor risk to the extent that it is deployed into future business expansions having inferior returns to those delivered by these companies from their historic operations.
Now, how do these five companies look if we set their OPM variable to zero?
| Adjusted OPM Set to Zero | Apple | Amazon | Netflix | ||
|---|---|---|---|---|---|
| Sales/Business Investment | 0.57 | 0.93 | 1.35 | 0.77 | 0.57 |
| Operating Profit Margin | 50.9% | 32.9% | 17.1% | 16.9% | 70.8% |
| % OPM | 0.0% | 0.0% | 0.0% | 0.0% | 0.0% |
| OPM Interest Rate | 6.0% | 1.0% | 6.2% | 4.6% | 5.4% |
| CapEx/Business Investment | 9.8% | 4.3% | 6.2% | 0.7% | 7.0% |
| 2019 Pre-Tax ROE | 19.5% | 26.4% | 16.8% | 12.3% | 33.2% |
Eliminating OPM lowers current equity rates of return. As the user of the most OPM, Netflix's returns fall by almost two-thirds, from 30.2% to 12.3%. Apple and Amazon are next, falling by approximately 45% and 30%, respectively. Google and Facebook employ comparatively little in the way of OPM, and their returns are not largely impacted. Interestingly, Facebook, Apple, and Google made so little use of OPM and maintained so much cash that eliminating borrowings would not lessen their current corporate size. The same could not be said of Amazon or Netflix, which would have to lessen their business investments by approximately 15% and 50%, respectively.
Based on this analysis and the prior adjusted cash balance analysis, Apple and Google have financial business models that stand out in a collectively impressive group.
The above exercises are interesting. There are just Six Variables, but you can see how diverse corporate business models can be. The FAANGs may be grouped together, but their business models vary.
You may be wondering how the FAANG V-Formula analysis might apply to your personal decision to invest in these companies. Well, the model is a start, but has two drawbacks as an investment tool.
The first of these is that the model is completely quantitative. Any investment decision must also be qualitative.
Second, and importantly, the V-Formula illustrates the corporate returns on each company's equity investment at cost. While the founders of these five companies were able to buy in at cost, that opportunity is lost to you. At the end of 2019, each of the FAANGs traded at substantial premiums to their cost to create, which meant that the current equity rates of return for new shareholders would have been substantially less.
I estimate that the cost of Apple's equity at the end of its 2019 fiscal year was $149 billion. Embedded in that large number is a small one: the original investment cobbled together by co-founders Steve Jobs and Steve Wozniak and the subsequent venture capital investment in their company that followed after they invented the Apple II computer in 1976, which made them millionaires. In December 1980, Apple was taken public on the fledgling NASDAQ market, selling under 10% of its corporate shares for over $100 million in the largest IPO since Ford Motor Company in 1956. Between then and the end of 2019, Apple did not issue additional shares, but split its shares four times. (A split is when a company gives its shareholders added shares of stock while lowering the price of each share to maintain the immediate collective share value.) As a result, had you purchased 10 shares of Apple stock in 1980 at a price of $22 per share, you would own approximately 560 shares at the end of 2019 valued at almost $165,000, for an 18.5% compound rate of return, excluding dividends.
As good as you would have done owning Apple shares since 1980, the founders and early private investors did far better, retaining over 90% of the shares at a far lower investment price per share in the company that they helped start. At the end of 2019, the company's equity was valued at an amount almost 10 times greater than its cost, catapulting Apple to be the first technology company ever to have an equity valuation greater than $1 trillion. About $900 billion of that equity valuation represented EMVA.

Steve Jobs, Apple Co-Founder, in front of the garage of his childhood home in Los Altos, CA where Apple was conceived. The house is now designated as a historic site.
Credit: Diane Cook and Len Jenshel / Getty Images
From a V-Formula perspective as illustrated earlier, Apple at the end of 2019 was impressive. However, the company's current pre-tax equity rate of return would have been unavailable to you, since to buy shares in each company you would have to pay a multiple of approximately 10 times the original equity cost.
In paying such a high premium over the cost to create a company, can the V-Formula still help you understand if the investment is attractive? The answer is yes.
Notes
- 1. Y-Charts and World Bank, World Federation of Exchanges Database.
- 2. Gary Fox, “FAANG—These Tech Giants = 10th Largest Economy in the World,” May 4, 2020, https://www.garyfox.co/faang-stocks/.
- 3. “How Markets Work and the FAANG Mentality,” Dimensional fund advisors using data from CRSP, November 1, 2019, https://www.dimensional.com/us-en/insights/how-markets-work-and-the-faang-mentality.
- 4. “How Markets Work and the FAANG Mentality,” Dimensional fund advisors using data from Bloomberg LP, November 1, 2019, https://www.dimensional.com/us-en/insights/how-markets-work-and-the-faang-mentality.