Chapter 1
Separating leaders from laggards
Abstract
This chapter sets the tone for the book by examining the current era of disruption, transformation, and reinvention happening across industries today, and the key characteristics of customer- and data-centric companies with an emphasis on the need to adopt a visual culture of data discovery.
Keywords
business transformation
data-driven
disruption
reinvention
visual culture
“The world is being re-shaped by the convergence of social, mobile, cloud, big data, community and other powerful forces. The combination of these technologies unlocks an incredible opportunity to connect everything together in a new way and is dramatically transforming the way we live and work.”
—Marc Benioff
Before we get too far ahead into data discovery and the beautiful science of data visualization—and how together these two concepts are reinventing today’s approach to BI and emphasizing the need for organizations to create a visual culture of data discovery—it is worthwhile to frame the context for this book with a bit of a story about data. Specifically, about big data.
Once upon a time, several years ago, in a wee little Editor’s Note I wrote for RediscoveringBI magazine, I managed to make the seemingly nonsensical leap of analogizing big data against my son’s second favorite Avenger, the Hulk. Though that Note was written in the early months of 2013, my message still holds true today, perhaps even more so than it did before. Then—and now—“big data” is routinely being paired with proportionally “big” descriptions, like “innovative,” “revolutionary,” and (in my opinion, the mother of all big descriptors): “transformative.” With the never-ending churn of cyber-journalism, industry events, and a growing body of analyst and academic literature on the subject, big data has spent the last couple of years firmly affixed atop buzzy headlines. Likewise, it has earned itself quite the reputation within the data community, replete with a stalwart following of pundits, early adopters, and those still eager to get their heads wrapped around how to use big data in their organizations. In fact, some might say that the whole “big data thing” has mutated into a sort of larger-than-life caricature of promise and possibility—and, lest we forget it, power.
So, at this point you can probably see where I am going with this Hulk analogy, but let us face it: big data is the Incredible Hulk of BI. It is gargantuan, brilliant, and—yes—sometimes even a bit hyper-aggressive. For many the mild-mannered, Bruce Banner-esque analyst out there, big data is—for better or worse—the remarkably regenerative albeit impulsive alter ego of the industry, eager to show with brute force just how much we can really do with our data—or, the tangible extent of all that big data power, so to speak. Yet, as with the inaugural debut of Stan Lee’s destructive antihero in The Incredible Hulk #1 in 1962, in 2016, we are only just now beginning to catch the first glimpses of what big data can really do.
While this is not a book about big data, it is almost impossible to write about data these days without talking about big data at some point, even if it is just a nod to the fact that not only big data is here, but it is here to stay—and it is going to keep getting bigger. More important, big data has ushered in an era of new opportunities to learn from and work with all this new and diverse information in new ways—and by a broader, more enabled group of people than ever before. Alongside the early mainstream adoption of big data, the data industry has also seen the emergence of data discovery as a complementary—if sometimes contradictory—component of traditional BI. Likewise, data visualization—along with visual data discovery and the growing concept of visual analytics—has leap-frogged from its resting place of those common, tried-and-true bar charts and pie graphs of old to a shiny new continuum of advanced data visualizations and a rekindled focus on the art of storytelling. With the Internet of Things quickly coming to fruition, it is no longer just a clever analogy—big data is the Hulk of BI and it is smashing apart the way we have been using data for decades.
This tidal wave of data is ultimately changing the way people experience data, and it is the catalyst that is spurring a period of rapid disruption, transformation, and reinvention that is fueling innovation in almost every industry today. In a nutshell, that is the focus of the first part of this book. We will begin with a look at how this era of disruption, transformation, and reinvention is mutating companies into visual, data-driven organizations, what the shift from BI to include discovery looks like, and how tools, technologies, and discovery-oriented cultures are expanding self-service into the realm of self-sufficiency for modern business analysts. And, because all of this change inevitably brings to light new concerns for the guidance of governance, privacy, and security in an increasingly data-dependent world, we will also touch on the emerging ethical quagmires and how to prepare incoming IT leaders and knowledge workers to navigate the data democracy, as well as how to gage the appropriate level of concern for big data ethical issues today.
1.1. An era of disruption, transformation, and reinvention
Thanks to the digital business transformation, the world around us is changing—and quickly—to a very consumer- and data-centric economy, where companies must transform to remain competitive and survive.
Yes, it is a bold statement, but it is also very true. For companies today, it is a full-on Darwinian experience of survival of the fittest. Never mind the mass influx of new and diverse data flooding in from every direction—we all know that is happening. What we may not realize, however, is how much influence the Internet, mobile, and the toy box of highly interconnected social platforms have on the reinvention of industries all around us. From auto insurance to media and entertainment, today’s most data-driven companies are proving, time and time again, that the entire body of industry is undergoing a period of explosive disruption that we simply cannot ignore. We see this in the way business models are changing, in how organizations are interacting directly with their customers, or even simply in the new breeds of companies that are springing up and changing the nature of their industries. To the latter, one top-of-mind example is Uber, a company that is—at least according to its website—“evolving the way the world moves.” Unlike taxi services of the past, Uber connects riders to drivers through an app. In one tap, Uber uses your phone’s GPS to detect your location and connect you with the nearest driver via a mapping and pricing algorithm that is often cheaper than metered taxis (unless you hit a surge pricing moment, like at rush hour or on a holiday) and generally always in a much cleaner vehicle. While Uber is changing the game for commuters needing a quick ride, it is also reshaping the taxi economy from the inside out, too. For example, cities like New York City sell a limited number of “medallions” that give car owners the right to operate taxies. These limited-supply medallions have been known to go for more than $1 million each. In the traditional model, taxi companies recoup their investments by renting their vehicles to drivers, gouging meter prices for riders, and giving as little monies back to their drivers as possible. Uber, instead, simply requires drivers to have a late model car and a clean driving record, and passes on a cut of each fare—no million dollar medallion needed. They give their drivers flexibility too: drivers can choose when they want to drive by simply switching their app on or off (Edwards, 2014). This is data-driven disruption, transformation, and reinvention, plain and simple.
If we boil it down to its simplest form, we could proclaim that companies looking to upsurge their disruptive fitness need to follow three steps: understand business disruption, build capabilities by design, and deliver a platform of speed. But first—and arguably more important—we need to approach the conversation by taking off the rose colored glasses of analytic possibility and thinking about how companies need to work in today’s marketplace. This is the part of the conversation that should precede any decisions about action—the part about change and vision. We can talk all day about BI or big data or analytics, but the reality is that the business itself needs new capabilities in order to be competitive with those leading-edge companies that are paving the way of reinvention. This reinvention is not a by-product of technology either. Technologies—like Hadoop, the cloud (public, private, or otherwise)—is just that: technology. There are no silver bullet solutions to become suddenly a better data-centric company, and there are solutions lurking around the corner looking to sell you a magic bean for a problem that does not yet need solving. Instead, once you understand your business’ disruption model, then you can design the most appropriate data architecture and bring in the technology you need to enable it as a platform.
It is the old wisdom of not putting the cart before the horse. To understand change, you must first understand why you need to change, and then how to make that change happen. Data and reinvention aside, this is the premise of change leadership, and reminds me of one of my favorite quotes from Simon Sanek’s Start With Why, a book I encourage all of my graduate students studying leadership to read early on in their studies. In the introduction to his book, Sanek says “there are leaders, and there are those who lead” (Sanek, 2011, p. 5). Today’s most disruptive consumer- and data-centric companies are not those who are merely seeking to be leaders in their respective industries. They are the ones who are looking to lead their industries.
With that in mind, let us talk about the power of disruption.
1.1.1. Understand disruption
To understand the power of disruption, we first need to understand what a digital life looks like now, compared to what it looked like before. Most of us are connected to our devices (yes, plural devices) and sharing and generating much more data than we realize—and that data is being used. I would wager to bet that those of you reading right this second have at least one device on you, maybe more. Smart phones, fit bits or other wearables, tablets…? What about those of you readers who have chosen the e-book format of this text over the paperback? On top of that, how many readers are multitasking and juggling reading with some kind of social activity (if you are, please tweet “@lindy_ryan’s new #dataviz book is G8”—just for fun)? This is not an idle guess: a 2012 Pew survey of 2,254 people found that 52% of all cell phone owners said that they multitasked on their mobile devices while watching TV. This is known as “media multitasking,” and involves using the TV, web, radio, telephone, or any other media in conjunction with another in simultaneous use (Reardon, 2012). (It is not necessarily a good thing, either, with a growing body of research on cognitive distraction in multitasking springing up since 2009.)
Likewise, we have to understand the new generation of “connected consumers”—the digital natives and the millennials, who are staking a bigger claim in the influencer pool of innovation just as much as the surprisingly tech-savvy older generations. (I can say that because, before she passed away my 70-year old grandmother somehow had a larger Facebook following than I do. I tease about this number often, when giving data presentations at data events, and it never fails to get at least a few surprised looks from the audience.)
Of course, in theory this paradigm shift is not unlike those that have happened before. Consider back when getting an email address was all the rage. I remember staying up many late nights listening to the sound of dialup logging into AOL, just so I could troll chat rooms. It is a little traumatizing to realize that the first major commercial Internet Service Providers (ISPs) hit the scene in the early 1990s; 1995 was the year of AOL, Prodigy, and CompuServe, and webmail services (like Hotmail) starting coming around in 1996–97. By late 1996, about one in ten Americans were on the Internet (Manjoo, 2009)—and that was already twenty—yes, twenty—years ago. Today, one email address still is not the norm—but for a completely different reason. For example, between work, personal, university, and other various social email addresses I have something like half a dozen different digital contact methods (not including phone, SMS or MMS messaging, or social media handles). On the other end of the spectrum, some digital natives do not even bother with email addresses because there are so many “other” ways to connect with someone online: you can text, tweet, Facebook Message, Skype, Snapchat, etc. Who would have thought, in 1997, that email would be the old-timers digital communication method? Kids these days!
The point is, simply: today’s digital natives are even more digital than we could have anticipated them to be before (and, often times also more digitally naïve about the risk of data and sharing too much information—the dark side of the Internet). Thus, we will need to learn how to experiment and move fast to meet those digitally demanding needs. Here, we can all take a lesson from learning to think like a startup—something that is counterintuitive to many of us. But, we often hear about big companies that recognize how big they are, so they find a separate building down the street, rent it, and staff it with their creative thinkers. It is a haven for innovation—the “stay hungry for new ideas” model versus the “protect what we have” model. Think about it, big guys: your competitors are moving fast, and you do not have choice. As industry after industry is getting shaken out in the wake of change, you have to innovate before you can optimize. It is the time to move fast, find a market, hone a product, take advantage of lean product development, and worry about optimizing later. This is not the age of the tortoise and the hare, where the lovable, sluggish tortoise wins the race with diligence and determination. In the digital culture, speed—a necessary prerequisite for disruption—wins over perfection. It is an era of creative destruction: capture the market base with first mover advantage, move in and own it while your competitors try to catch up, and then create enough upheaval that when you leave—before anyone can show up second—you have made your success almost impossible to duplicate. That is the core premise of disruption: an unreproducible innovation that creates a new market or value network, eventually disrupting an existing market and displacing what came before.
Netflix, the subject of my graduate thesis on creative destruction, is the poster-child for this disruptive innovation—or, as Hurst (2002) calls it, ethical anarchy, wherein disruptors become pioneers and then owners of a market. In later examples of data-driven companies, Netflix will be at the top of our discussions. Of course, Netflix is not alone on the list of disruptive companies that have become impressively consumer- and data-centric and are now thriving in the very digital culture that they have created for themselves. There are so many familiar stories we could talk about that it is almost hard to choose a reasonable few. But, later in this chapter, we will talk about four—Netflix, Facebook, Starbucks, and Amazon—and I will share the data on why these companies are, arguably, the Fantastic Four of disruption.
1.1.2. Build capabilities by design
In chapter: The Importance of Visual Design, we will discuss—in great detail—how today’s data-centric companies are leveraging tools and technologies to capitalize on their data and earn a place as a disruptor by building data capabilities by design. Within that conversation, I will detail how these companies are balancing user intuition and self-service with high-performance for actionable insights; how they are facilitating increased time to data insight with tools that provide speed, agility, and self-sufficiency; and, how they are powering that discovery process with visualization, collaboration, and mobility. But, in this chapter the point I want to make is this: that building capabilities is—like the header suggests—by design. Transforming into customer- and data-centric organization does not happen by accident.
Disruptors are discovery-oriented. While we still need traditional data models and BI, discovery is that fail-fast, iterative, and agile process that takes us from information to insight in a more proactive, real-time, actionable way. And, it is experimental—a process of continuous learning and improvement.
One of the most data-driven, discovery-oriented companies out there is Google—the data giant with the search engine front-end that has ruined us forever with the expectation of typing in a search prompt and receiving 11 million records in less than one second. Do not believe it? Here is proof (Figure 1.1).
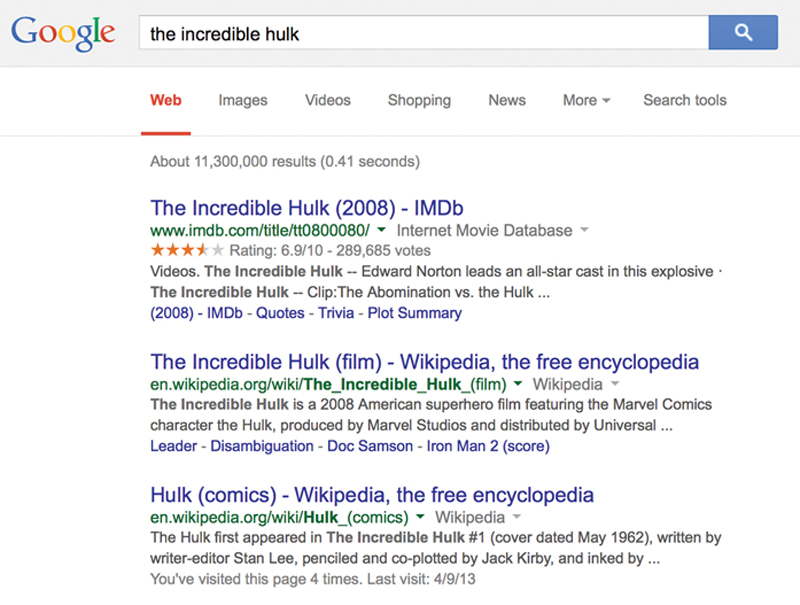
Figure 1.1 Google Search Results
A search prompt of “The Incredible Hulk” returned about 11,300,000 results in 0.41 s
A search prompt of “The Incredible Hulk” returned about 11,300,000 results in 0.41 s
Here is what Google, in its technology overview, has to say for itself: “The software behind our search technology conducts a series of simultaneous calculations requiring only a fraction of a second. Traditional search engines rely heavily on how often a page appears on a web page. We use more than 200 signals, including our patented PageRank algorithm, to examine the entire link structure of the web and determine which pages are most important. We then conduct hypertext-matching analysis to determine which pages are relevant to the specific search being conducted. By combining overall importance and query-specific relevance, we are able to put the most reliable and relevant results first.”
The even crazier thing is that we are happy with what Google gives us—even if it is wrong! And, with every click on that back button and refinement of our search criteria, we are effectively helping Google, and its monster of a machine-learning algorithm, to learn.
Can you take this same psychological principle and apply it to BI? Or to discovery? The wrong answer is okay, when you can be iterative quickly enough to fail fast and try again. Failure is not typically a word that conjures up positive feelings, but in the discovery-oriented culture required for disruption, there is a change in mindset that needs to happen. In discovery, failure is okay—so long as there is learning and, therefore, increased value, involved. Google’s search engine learns and improves its value with each “failed” search result that a human corrects the next time around. Google Translate—which is arguably better than other translation software that have had the benefit of decades of work and millions of dollars invested—follows this same approach: humans correct translation errors and Google learns at big data speed with human parallelism. This is that “not by accident” attitude—data-centric companies must be ready and willing to be exploratory and to play with new ideas and new paths. It is kind of like scouring the web via Google—half the time I put a prompt in with no idea what exactly I am looking for, but I know it when I see it. In many ways, data discovery is the same.
When we talk about building capabilities by design, there are a set of four core capabilities that you should keep in mind:
• Designed for self-sufficiency: Enable an environment where the business user is capable of acquiring, blending, presenting, and visualizing their data discoveries. IT needs to move away from being command and control to being an information broker in a new kind of business-IT partnership that removes barriers, so that users have more options, more empowerment, and greater autonomy.
• Designed for collaboration: Have tools and platforms that allow people to share and work together on different ideas for review and contribution. This further closes that business-IT gap, establishes transparency, and fosters a collective learning culture.
• Designed for visualization: Data visualizations have been elevated to a whole new form of communication that leverages cognitive hardwiring, enriches visual discovery, and helps tell a story about data to move from understanding to insight.
• Designed for mobility: It is not enough to be just able to consume information on mobile devices, instead users must be able to work and play with data “on the go” and make discovery a portable, personalized experience.
Ultimately, building capabilities by design is a mechanism with the purpose of increasing value generation not just from data, but also from the people working and interacting with the data. While there will be always be a population of people within your organization that just want to consume data, expand the potential of those who do want to strap on their fedoras of exploration and be insight discoverers. Of course, as Spiderman’s Uncle Ben famously said (and that is my last superhero reference, I promise) “with great power comes great responsibility,” and questions of governance are inevitably going to come into play. This is not only the governance of people, roles, and responsibilities, but also governance of insights themselves, and—in my opinion—governance of data visualizations as unique information assets. But for now, let us put a pin in the governance conversation and save it for Part III.
1.1.3. Enable a platform of speed
Lastly, as a criterion for disruption, let us again revisit speed, which is a recurring theme throughout the entirety of this book.
Alongside the awareness of the digital culture, and the capabilities needed to be a disruptor, today’s customer- and data-centric companies keep three truths close to the heart. These are:
1. They collect data from everywhere. And, they start with the business goal, then work backwards to imagine the data needed to reach that goal.
2. They focus their analytics culture around four key areas: customer insights, product insights, optimization, and—obviously—innovation.
3. They act on analytics as a source of both continuous improvement and action.
So, what platform are you going to put this on? With Hadoop, an ever-increasing amount of As-A-Service models, and the expected differences in every IT culture—what do we do? Where do we even start? I mentioned before that technology is just technology, and that there will always be shiny new technologies available to play with to meet analytical goals. But, consider that speed is the most important element when evaluating technology decisions and drafting that architectural roadmap. Remember, speed does not just equal fast. Whatever the technologies chosen, a platform of speed must be (1) built to change, (2) should utilize the polyglot persistence approach (or, use the right database for its strengths), and (3) should put a premium on data unification to give users one “go to” place to navigate, understand, and access information. While there is not one platform to rule them all, there should be one cohesive platform of speed within your organization—or, as we call it: a true Modern Data Platform.
Think about it this way: we do not search the Internet for information. The Internet, while made up of millions of computers, from a platform perspective is a single (and proper) noun. This is how organizations need to think—not as silos of information, but as a Platform—with a capital P.
1.2. Characteristics of data-centric companies
In the section before we talked about the era of transformation and reinvention, about building capabilities for disruption, and about keeping the premise of speed at the top of the priority list. Much of this is not a simple recipe for change that, with a detailed ingredient list, we can stop off at the local market to scoop up. Instead, it hinges upon putting the right chef in the kitchen to make that vision a reality and change the way we think about our business, and our data. For example, Gordon Ramsey is not going to be the guy you get to run your hotdog and pretzel concession stand at the local ballpark. He is the master chef, who is going to have the skills, aptitudes, and mindset to launch that successful new five-star restaurant in Beverly Hills that all the A-listers flock to. For data-centric companies to earn the competitive advantage they need to survive in the era of disruption and innovation, a mindset change to thinking like a data-centric company is just as important as any tool or technology adopted to make it happen.
The mainstream adoption of Hulky big data is starting. Now, it is time to figure out what to do with all this data—and how to exploit it for competitive advantage.
Ultimately, companies use data—big or not—to solve business problems. The customer-oriented, data-centric company, however, does not just treat data as an asset—it treats data as gold—and they are willing to pay for it, too. Many data-centric companies do not even look like data-centric companies at first glance. Like Google’s search engine or Amazon’s online retail platform, which masquerade as “service providers” first, though what they are really doing is providing free services with the end goal of collecting data. Amazon pioneered this strategy of collecting and exploiting data by layering user data on top of open ISBN data to create new value—they do not own ISBN numbers, but they created the metadata to go on top and developed one of the best recommendation algorithms out there, killing off Borders (who outsourced its e-commerce model) in the meantime.
Other companies design loyalty programs to drive data collection. These are those customer rewards programs at grocery stores or gas stations, or at casinos or popular chain restaurants that are forever giving away free appetizers or desserts. By offering discounts on seemingly random products or by providing immediate 3-cent savings at the pump, they are literally paying their customers to provide data by enrolling in their user loyalty programs. Every time you swipe that card or stick it in a slot machine, you are telling that company where you are, how much you are spending, and what you like. (Conversely, you could look at opting-out—or, not signing up for the saver card—as incurring a privacy tax: you are paying full price to keep your data to yourself).
It might seem a stretched statement to say that data-centric equates to competitive advantage. However, there are competitive advantages earned by data-centric companies that are truly revolutionizing their respective industries. Here is how they do it:
1.2.1. They are data harvesters
Data-centric companies collect and harvest data from everywhere. One of the “old ways” of thinking in BI was to ask what data was already available, and how to integrate the data to define metrics or map it to an already pre-defined metric. Data-centric companies tackle that question another way—instead of figuring out how to use what data is already available to answer metrics, they begin with first addressing the business problem that needs to be solved, then imagine the data needed—and then go out and find it or create it through new apps (like mobile) or collection agents. For these companies, data is not merely an asset. It is not even gold—it is (as my colleague John O’Brien often calls it) oxygen.
Data-centric companies are willing to do whatever it takes (ideally within ethical reason—more in chapter: Navigating Ethics in the Big Data Democracy) to get data. They leverage external public and purchased data, big data, …—whatever data through whatever means necessary, including internal sources, mobile apps, wearables, sensors, and so on.
They will buy data—they will even give away services for free, like Google’s search engine or free downloadable apps for your mobile device that collect data every time you crush a piece of candy or check a movie show time in your neighborhood. Even a weather app can bring in untapped value. Being a data harvester is simply the willingness to collect every piece of data about your customers and people, any way you can, in order to gain insights about existing customers and relate that to future customers.
1.2.2. They live an analytic culture
Data-centric companies create (and live and breathe, that oxygen metaphor from above) within an analytic culture—and they make it look easy, too. This analytic culture can be broken down into three categories.
Insight: Mining, clustering, and using segmentation to understand customers, their networks, and—more important—their influence, as well as product insights (for competing products too).
Optimization: Of business functions, processes, products, and models through the use of analytics.
Innovation: To discover new and disruptive business models that stay true to company brand but provide pathways to foster the evolution and growth of customer base throughout the entire customer lifecycle.
One of the mainstays of the data-centric culture is to drop biases. Look for the data, and derive correlations from there. Or, ask not what you can do for your data, but what your data can do for you. This is the reason that Best Buy is still here today while Circuit City is not: Best Buy embraced analytics to understand what their customer buy patterns were and recognized that an overwhelming majority of revenue was coming in from a relatively small segment of its customer demographic. Therefore, they started stocking the products that their customer demographic wanted to buy (like appliances), rather than what the store had previously been designed to sell (like CDs).
Two of my favorite examples of living an analytic culture come from the wearables community. Recently, Disney introduced its MagicBand, a bracelet-like device that provides an all-in-one room key, credit card, and FastPass (to skip those pesky waiting lines) for its wearers. They come in various colors (mine is orange, my son’s is blue) and you can even have your name inscribed on them or accessorize them with little buttons of Disney characters. They provide value to the consumer, yes, but a considerably larger value to the parks. These MagicBands are a data-generating instrument system about everyone in the park for Disney to collect data and learn from. They can see where people are in the park, what they are buying, how long they are waiting in line—all kinds of handy information that Disney can use to improve the park experience and earn more revenue while nudging out their competition. Another example is what Apple is doing for scientific research with its devices, including the new Apple Watch. In March 2015, Apple introduced open-source software ResearchKit, which gives developers a platform for apps that collect health data by accessing the millions of bits of health data on users’ iPhones (like the accelerometer) or the Watch (which can measure heart rate changes). In the press release, Jeff Williams, Apple’s senior vice president of Operations was quoted as saying “ResearchKit gives the scientific community access to a diverse, global population and more ways to collect data than ever before” (Apple, 2015). The ultimate story point here: companies collect human behavior data to support analytics—and perhaps, as in the case of Facebook, to debunk so many psychology theories with the comment “who knows why people do what they do, we simply have the data to prove it.”
1.2.3. They think long term
Data-centric companies find ways to perpetuate lifetime value through the acquisition of new, multi-generational customers. Remember: the data you have now only shows a snapshot of your current environment. Thinking data-centric is thinking long-term. It is looking for patterns in the data to see where your company is, sure, but more important to look at where it is going, and then developing a plan to work toward getting there.
To data-centric companies, thinking long-term means thinking about multigenerational customer engagement. These companies maintain a high brand-to-customer focus, where the brand itself is largely defined by the customer’s sentiment and influence. For the customer, the relationship to the brand is a connection assembled through experience. Eventually brand loyalty becomes customer loyalty. Customer analytics should be used to identify and nurture potential valuable customers that can be engaged as lifelong customers. Further, data-centric companies should not expect customers to be loyal to the brand, but should instead focus on being loyal to their customers.
One industry in particular that is spending a lot of time thinking long-term about its lifetime customers is the casino and gaming industry. Think about all the different kinds of people you see in a casino: young and old, different ethnicities, cultures, income brackets. Each one of those people falls into a different customer segmentation, and yet each one is still having a great time and handing over their data to the casino. And, with customer analytics, the casino is able to keep all of those customer segments engaged through targeted offers, floor layout, game options, and so on. It is like that quote from A Field of Dreams: if you built it, they will come. With long-term thinking and a focus on lifetime customer engagement, data-centric companies can extend that to: if you build it, they will come—and if you build it right, they will keep coming back.
I am not much of a gambler, but this same type of long term customer loyalty from my brands is why I buy books from Amazon, though I spend weekends at Barnes and Noble perusing book shelves, flipping through titles, sipping coffee—and inevitably walking out the door with something in a green and white bag. I buy books on Amazon because I can trust that they will offer me the best price on the same book, but I still shop at Barnes and Noble because they are going to give me a great bookstore experience. They sell books, yes, but they are thinking long term about their customers by bringing in cafes, better Wi-Fi, in-store eBook kiosks, etc. and making sure to keep showing loyalty to customers through that more traditional in-store experience.
1.2.4. They take action
Finally, data-centric companies act on analytics. Data without action holds no value on its own: it is the action that drives the business value. Acting on analytics is not a one-time thing either, but instead a continuous process of experimentation and improvement. Improving analytic models is important as the data underneath is continually changing, too.
For a quick example, refer back to my earlier comment on the untapped value of the weather app. At a recent client event in Reno, Nevada, we asked attendees how many weather apps they had on their smartphones. Many—at least a quarter of the room—noted they had more than one. I have four, and I use them all—one for quick reference, one for detail, one to figure out what I should wear, and the other to evaluate whether I should be carrying an umbrella or not. Recently, I noticed that my quick-reference app started adding in more hour-by-hour data, and my what-to-wear app started adding accessories. Therein lies the rub: having multiple analytic engines drives competition, and competition drives improvement.
1.2.5. And, they stay connected
Becoming a data-centric company requires an inevitable cultural change to achieve competitive advantage. Through competing on analytic abilities, companies can build deeper understandings of customers and relationships. Think about the data you collect today—and then realize that the activity you capture today (probably) is not enough. Being data-centric means going the extra mile in the way you interact with your data.
And, last of all, data-centric companies stay connected to their customers. This is another tick mark in the pro-mobile column. The more mobile you can be, the more opportunity for data—the more access you have to a hyperconnected generation. Mobility is a way to instrument customers, too. Today, through mobile apps, customer’s “public personas” are available through APIs. And, mobile is a “me”-phenomenon: it is a direct line to a customer’s most selfish desires—what they like, what they hate, what they want, and what they are willing to say about it all. This social and behavioral data tells us about customer interests and actions, and thus the best ways to make them happy. Mobility provides a plethora of opportunities to influence and engage customers—by pushing advertisements, and offers, connecting in real-time on social media, or by being a part of their sharing experiences in hashtags and photos, or engaging directly online. One example is how true[X] Media (previously SocialVibe) is reimagining low-performing ads in a shorter, more interactive paradigm to engage directly with customers through digital ads. Through engagement advertising, true[X] delivers ad units that are self-selected by the viewer in exchange for unlocking online content (ie, music, videos, articles, etc.). Taking over the browser for approximately 30 seconds, the ad requires human participation (eg, a survey, like, share, or so forth) for completion. This quick and interactive mode was not only more preferred by the audience, but it also gave advertisers more ability to learn from the engagement data gathered by the online ad—and reduce fraud, a big problem in the digital ad industry (Kantrowitz, 2014).
Today’s hyperconnected customers are always on the go, and they love to capture their experiences—this is why apps like Twitter, Snapchat, Instagram, etc. are so prolific. If you need any further convincing about the connected power of mobile, consider what happened to HBO and Showtime at the 2015 Floyd Mayweather and Manny Pacquiao fight. As the year’s biggest fight, viewers could pay to watch the show for $100 on cable, or they could use Twitter’s streaming business Periscope to broadcast unauthorized live feeds of the event for free. Naturally, this was not what Periscope was intended to be used for, but nevertheless, in a Costolo tweet, Periscope was pronounced the fight’s winner (Shaw, 2015). (This was not the first time Periscoped usurped an event either: in April of 2015, Game of Thrones fans streamed the show on Periscope and Meerkat, too).
1.3. Examples of data-driven companies
All this talk about customer- and data-centric companies might be for naught, if we did not take time to review how those Fantastic Four companies I identified earlier—Netflix, Facebook, Starbucks, and Amazon—are putting those principles into practice.
The next section of this chapter will take a deeper look into how each of these companies are capitalizing on creative destruction, market transformation, and customer-centric focuses to reinvent their respective industries. Many of these are familiar stories, but there may be some details you have not thought of before that lend a fresh perspective.
1.3.1. Netflix
Having spent a good six months of my life writing, editing, and polishing my graduate thesis on Netflix for publication, the on-demand streaming video service is one near and dear to my heart. And, there are so many interesting things about Netflix, and the way it is reinventing the media experience to talk about—starting with the fact that it was originally named Kibble.com (yes, like the dog food), as a reminder that “no matter how good the advertising, it’s not a success if the dogs don’t eat the dog food” (Randolph, 2011). To a 2015 study by the University of Texas that suggested a connection between binge watching streaming media, like Netflix, with behaviors associated with depression (though the survey only included a sample size of 316 people and “binge watching” was considered a measly two or more episodes (Rutsch, 2015)).
The entertainment industry is one that is not only rapidly reshaping, but is getting completely overhauled. From yesterday’s broadcast, to cable, to online video and video on-demand, companies like Netflix, Hulu, and Amazon Prime have repioneered the way we watch television and movies. The first of these, Netflix disrupted its industry in a big way. In my thesis written in 2012, I wrote: “From humble beginnings as a dot.com startup in 1997, Netflix has redefined the video-rental market and become a giant-toppling industry leader with 24 million subscribers (Ryan, 2013, p. 429).” In January 2015—just a few years after the creative destruction of the “Qwikster disaster” that seemed like it would destroy Netflix’s stronghold with an almost immediate stock landslide topping 57% (Ryan, 2013)—subscriber numbers have almost doubled, bringing the total number of Netflix subscribers to 57.4 million worldwide (Gensler, 2015).
Now that Netflix has reshaped how we watch media, it is reinventing what media we watch—or, orchestrating the full circle of the customer experience “from the moment they [customers] sign up, for the whole time they are with us [Netflix] across TV, phone and laptop” (Sweney, 2014, para. 3). With microsegmentation, Netflix is creating shows scientifically formulated to meet customer demands. Case and point for this is House of Cards—which Netflix reportedly sunk $100 million into production without even seeing a pilot (Sweney, 2014). It is not just Kevin Spacey that makes House of Cards such a win either: it is the data behind it—a meticulous analysis on subscriber data that basically guarantees its success.
One New York Times columnist called the show a Venn diagram of the director (David Fincher), the actor (Kevin Spacey), and the British version of the same show; another called it a data-driven holy grail for a hit TV show. Whatever you call it, on its release, House of Cards was the most streamed piece of content in the United States and 40 other countries (Carr, 2013).
1.3.2. Facebook
If Benjamin Franklin might have been around in today’s era of digital-dependency to coin that iconic phrase “there are only two things certain in life: death and taxes” he might have rephrased it to be “death, taxes, and social media.” Like home computers and email addresses in the past, social media platforms—like Twitter, Instagram, Pinterest, and Facebook—are so ubiquitous in our every day lives that the absence of them in our social repertoires is almost counterculture to the highly inter-connected and social ways of communication today.
It is not a big secret that Facebook is a stealthy data giant that has, in the decade since its inception, reinvented (or, perhaps more accurately, actively defined) what social networks are. The ability to connect with people we know—or once knew—meet new people, share pictures and details about our lives, stay updated on social news headlines, and so on tickles the very fancy of our intrinsically gregarious and attention-loving nature. It has become so engrained in our behaviors that we almost do not know how to live without social media and Facebook anymore (see Box 1.1 The Social Media Addiction). However, while Facebook’s purpose is to help everyone connect, stay in touch, and meet new people within their ever-growing peer networks, it relies on data and algorithms—like the famous EdgeRank—to highlight and offer connections that may be most aligned with each individual’s interests, and to publish ads that monetize the social media machine. With the overwhelming amount of data it has collected on its millions of users, Facebook has become one of the largest repositories of personal data. Let me put “largest repositories” into a bit more context. Facebook has its own modified version of Hadoop with geographically distributed clusters that store upward of 300 PB of Hive data, with an incoming rate of about 600 TB per day. In the last year alone, the warehouse has seen a 3× growth in the amount of data stored (Facebook, 2014).
Box 1.1 The social media addiction
When graphic designer and self-proclaimed “casual Facebook user” Chelsea Carlson decided to quit Facebook, the results she got were not the ones she was expecting.
Curious if the size of a data set was less important than the question she was asking of it, Carlson first got the idea to deactivate her personal Facebook account when she thought she had stopped using it for social reasons—arguably the purpose of the platform to begin with—and was, instead, simply engaging out of habit and passively taking in information rather than participating in the social experiment. She wanted to collect a small, personal data set by hand and look for ways to improve or understand her decisions by tracking and visualizing various areas of her daily social habits. By collecting data on how she was really using Facebook, Carlson hoped she could apply the study on a tiny scale for personal impact and become more cognizant of her social interactions online.
The experiment was simple: Carlson deactivated her account—a bit of a hassle as Facebook does everything it can, from using pictures of friends to beg you to stay to putting you through the hoops of a deactivation questionnaire to convince you to stay—replaced her 3rd party social logins, and started to record every day and time she “needed” to log in, as well as the reason she was visiting the site (Figure 1.2).
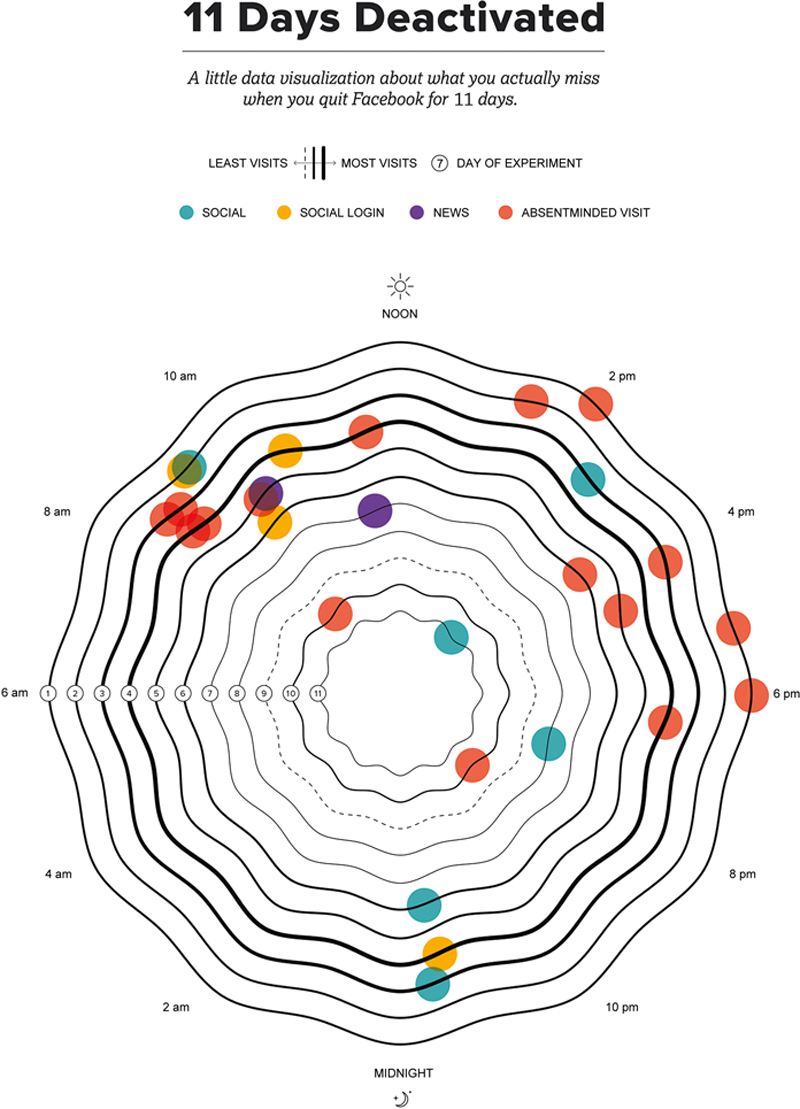
Figure 1.2 Carlson’s Visualization Shows the Frequency of her Visits as Well as her Intended Reasons for Visiting the Social Media Site her 11 Days of Social Media Deactivation (Source: With permission from Umbel, 2015).
The results of the experiment were interesting. When she began sifting through the data, Carlson found that it fit neatly within four core categories: absentminded visits, social visits, 3rd party logins, and missed news event. When she put her data into form, she chose to visualize her experiment as an outlet to present the personal data in a way that she found personally interesting—and that told a story about her experience. Thus, she chose a clock-type graph to display the rings of day and time to quantify the passing of time over her eleven days offline. By exploring the rings of her clock, it is easy to notice that the number one reason Carlson visited Facebook was simply out of habit.
While the data itself was interesting, the emotional journey through the experiment proved just as compelling. First, was Facebook’s emotional plea to keep users online, which sparks the curious question of how many people abandon deactivation (perhaps an idea for another study?). Next, was the empowerment Carlson felt when she replaced all of her social logins to avoid sharing all that extra data with 3rd party sources. Freedom!
Of course, the short-term benefit for Carlson was that she effectively broke her absent-auto habit of logging into Facebook. The long-term benefit was that she is more aware of how she uses the social media platform, and it has provided her with personal guardrails to gage her social interactions.
More on Carlson’s Facebook experience can be found online at: https://www.umbel.com/blog/data-visualization/11-days-deactivated/
Facebook has so much personal data, in fact, that a recent blog headline on (Newman, 2015) came with the title of Big Data: Why Facebook Knows Us Better Than Our Therapist. This was on the heels of an early 2015 social psychology study out of the University of Cambridge and Stanford University that concluded that Facebook could more accurately predict our personality than could a bevy of close friends, family, and even possibility our therapist(s)—all because of the power of intelligent insight into the data. This level of potentially invasive personal insight, however, is not too far from realizing those longstanding worries over Big Brother-esque privacy concerns, and the reason why things like Facebook’s recent high-profile study on users’ emotions sparked some heavy duty soul-searching and calls for better ethical guidelines and user privacy in an increasingly public online world (more on privacy and ethics in chapter: Navigating Ethics in the Big Data Democracy). Of course, remember again that we are actively—and willingly—giving Facebook that personal data through our click interactions: every time we like a page, make a post, or take one (or seventeen) of those addictive online quizzes.
1.3.3. Starbucks
Like most good American millennials and businesspeople, I love my coffee. Hot, cold, or blended, chances are most of us like coffee in one form or another. Or we like tea, whether it is mixed with milk or steeped in boiling water. If not coffee or tea, then we like pastries, or acoustic tunes, or working remotely in a relaxing atmosphere. Luckily for us all, one of the nation’s largest coffee chains—Starbucks—is also an innovative, data-centric company that knows how to connect with its customers. And, while Starbucks may not take the “best coffee” blue ribbon from coffee snobs everywhere, what it may lack in flavor it makes up for in a coffeehouse experience. In fact, Starbucks is giving that experience to customers in over 20,000 places: a quick search online shows that Starbucks had 21,366 Starbucks stores around the world as of 2014.
From its newest products (like the mini Frappuccino, which is both cute and delicious), to its desirable Starbucks Gold Card, to scouting locations for its next retail stores, Starbucks is using data to dominate its market: the coffeehouse experience. Starbucks leadership has long considered their coffeehouse as the “third place” (Michelli, 2014, p. 158)—an environment positioned directly following its customer’s first place—home—and their second place, work. Today, that third place view has been widened to engage customers in their first and second places (think homebrew and kiosk stores in high-traffic work zones, like hospitals and book stores), as well as via their mobile devices.
At the core of Starbucks’ digital strategy are several interrelated areas: commerce; company-owned web and mobile channels, loyalty/customer relationship management and targeted databases; social media; and paid digital marketing (Michelli, 2014). But, the anchor of Starbucks’ current mobile strategy is its loyalty program—the Starbucks Card—which itself represents a multibillion-dollar business as both a gift card and prepayment mechanism.
As of Q1 2013, Starbucks had a total of 6 million registered loyalty program customers profiled, with approximately 80,000 new members joining each week (Bashin, 2013). More important: a quarter of all transactions at Starbucks were made with loyalty cards, giving Starbucks more data than it knew what to do with but a whole lot of room to grow into. Joe LaCugna, director of analytics and business intelligence at Starbucks was quoted as saying, “We [Starbucks] know who you are. We know how you’re different from others.” And how is Starbucks using this data? Well, not in the way you might expect. Rather than targeting offers at its best customers, Starbucks has been doing the opposite: targeting customers—using a combination of data gathering, analysis, and modeling approaches—whose purchasing habits show they might not be returning anytime soon, and sending them offers (Bashin, 2013). Looking ahead, Starbucks plans to use this same approach to personalize the look and feel of the company’s website and mobile app based on their knowledge of the individual customer (Michelli, 2014).
Another interesting element Starbucks is bringing to its mobile customer loyalty program is gamification—engendered through multiple reward levels and a progression tracker that visually gives loyal coffee lovers incentive to engage with the brand as they watch virtual gold stars fall into a cup to show their progress to the next member hierarchy. (As another non-Starbucks example of beverage gamification, think about the new Coke dispensing machines in restaurants that allow customers to customize their drinks at the touch of a button on-screen. This is fun and exciting for customers, while Coca-Cola uses this data to analyze new product development and recommend “other favorite creations” on its menu.)
1.3.4. Amazon
There are buckets of stories in the media about Amazon’s rise to greatness, and for good reason. As one of the world’s largest booksellers, Amazon commands the largest slice of the book-selling pie—65% in mid 2014—for both print and digital units (Milliot, 2014). Through Kindle, they have an even larger percentage of the eBook market. Traditional booksellers, like Barnes and Noble, have had to reshape the book buying experience (and e-commerce models) to keep pace with Amazon’s market position and discounted book prices. But the most innovative way that Amazon is using data is not just for its prowess as an online book retailer—in fact, buying books online is relatively minor in the scope of what Amazon is doing with data today.
First, Amazon has an unrivalled bank of data on online consumer purchasing behavior—data that we, as consumers, have given to Amazon through our activities while we browse their site. This is the horsepower behind Amazon’s recommendation engine that suggests products to shoppers using data mined from its 150+ million customer accounts. Earlier in 2003, Amazon used item-item similarity methods from collaborative filtering to build this engine; today it is complemented with customer click-stream data and historical purchase data to give its users customized results on customized web pages. Amazon then monitors, tracks, and secures the 1.5 billion items in its retail store in a product catalogue data warehouse in Amazon S3. This catalog receives more than 50 million updates a week and every 30 minutes all data received is crunched and reported back to the different warehouses and the website. Then, there is Amazon Web Services (AWS), which—besides being used by large companies like Dropbox, Netflix, and Yelp—also hosts public big data sets. Some big data sets, including the data from mapping the Humane Genome Project, are even available for free public use in AWS cloud-based solutions.
Of course, Amazon has been criticized for some of its more ruthless business tactics, like introducing the price check app, which lets users scan barcodes from anywhere and instantly compare the in-store price to what is listed on Amazon. While its consumers are receiving the value of getting more information instantly, they are also contributing to Amazon’s competitive intelligence model and providing the retailer with exact details on what their competitors are doing, too. And, because of what they are doing with big data (and how they are monetizing it), Amazon’s top competitors—Google and Facebook—may not be the companies you expect.
1.4. From the data to the dashboard
If you want to distill the previous yarn about disruption, transformation, and reinvention in the wake of big data into a single bite-sized takeaway, you can easily say that big data is reshaping how we do business today—and, at least on one level, that is true enough. But, when it comes to customer- and data-centric organizations like those Fantastic Four above, data itself—big or otherwise—is not the only thing that is propelling these companies to greatness. Beyond being just data-centric, or more analytically minded, or even more daring and ready to boldly go where no company (or industry) has gone before, the most data-driven companies are also those that embrace an ethos of data discovery and data visualization. They focus on empowering everyone (or, as many people as possible) within the organization to take part in their data-driven success by establishing a democratic culture of data discovery and cultivating a competency on data visualization as core information assets.
To add a bit of color to this conversation, think of discovery in the larger landscape of data. With the continued democratization of data today, information is increasingly becoming available to everyone who wants to reach out and grab it—and without having to dig deep into budget pockets or employ robust IT departments (the previous Big Iron of Big Data). This is especially big for small businesses, where the democratization of data is helping them catch up to some of the bigger and more data savvy players. With bigger data now being more approachable, smaller companies are empowered to easily and affordably—and regardless of technical prowess—access, collect, and analyze data to create new opportunities to earn insights about their markets and customers. Data democratization, through the emergence of web-based data collection and analysis services, new technologies, and savvy social marketing, is giving fast access to actionable insights to companies big and small.
Now, let us distill that larger data democracy down in a way that can be rearticulated within the confines of one organization. Rather than an open data buffet for companies big and small, think instead of departments large and small. Of users from power users to business analysts. Of data scientists to data consumers. This data availability is a key element of data discovery, which requires the ability to get up close and personal with data to explore, play, dig through, and uncover new relationships and insights. It requires flexibility and agility, but most important, it requires more people hands on in the discovery process to realize its full potential. Discovery is a numbers game at heart. It may take 99 iterations through the data to find one meaningful insight. And, that type of “fail fast” mentality requires a new breed of self-service that gives as many people as possible—and along the full spectrum of data users—the ability to have the tools, environment, and access to the data that they need to create and consume on the fly without being hindered by IT handcuffs or avoidable friction-causing activities. This is part of IT’s new role—enablement technology—and part of a larger shift we are going to continue to watch in the industry. And, it is part of building a true data democracy within the organization.
Beyond that culture of democratic data discovery is also needed a cultivated competency on data visualization—which is the collective group of graphicacy techniques that are the petri dish for visual discovery and insight and a critical part in a visual culture for data discovery. By all means, I am not going to try to convince you that data visualization is new. It is not. In his paper “Data Visualization for Human Perception,” Stephen Few pointedly wrote, “We have been arranging data into tables (columns and rows) at least since the second century C.E. However, the idea of representing quantitative information graphically didn’t arise until the seventeenth century” (Few, 2014). Some of today’s most “historical” data visualizations—like Florence Nightingale’s Coxcomb Plot or John Snow’s London Cholera Map—are so impactful because they illustrate how data visualization is a timeless method to being able to see and understand data more clearly.
Data visualization is a key part of how we can earn insights into our data. On that note, I want to take the opportunity to sidestep the bubble-like kludge of definitions that seems to plague the BI industry and offer a clear, level-set understanding of what I mean when I say “data visualization within a visual culture of data discovery.” Data visualization is the practice of presenting data in visual—and in increasingly interactive, engaging, and mobile-optimized—ways—via charts, graphs, and other analytical formats. But when I talk about creating a visual culture of data discovery, the core of this is extended to include a balance of art (read: design), science (read: information), and organizational culture with a focus on earning insights, discoveries, and being able to visually communicate and tell stories with our data. The visual dimension of culture is becoming increasingly dominant—the definition of visual imperative—and this is a force that is driving the need to create a visual culture of data discovery. Data visualization then is a tool—a mechanism, if you will—to enable visual data discovery.
1.5. Navigating this book
In his book, The Visual Organization, my friend and fellow author Phil Simon (2014) writes: “unleashing the power of dataviz and Big Data requires that organization do much more than pay lip service to these topics.” Though he and I articulate it differently, both Phil and I are beating the same drum. To be a truly data-centric organization requires action, rather than reaction. With advanced visualization capabilities and the ability to harness, integrate, and interact with massive amounts of disparate data for discovery, discovery tools must balance user intuition with high-performance capabilities for real-time insights—coupled with a premium on IT-independent user self-sufficiency for the masses. However, the competent data-driven organization must recognize the influence of visual communication, and the importance of architecting for visual discovery in people, processes, and technologies.
This book is not intended to be a guide to data visualization. There are many who have contributed amazing work in the holistic body of data discovery and visualization, including people like Edward Tufte, Stephen Few, and Nathan Yau, who have all written extensively on the mechanics of data visualization. There are others too, who have contributed stellar material in the academic study and scientific research of data visualization, visual analytics, and the related fields of visual design and cognitive science that I can only offer superficial discussions of. Still more have written highly technical masterpieces on data architectures, big data technologies, and data governance methodologies. This book, however, is not intended to be an exhaustive guide on any of those. Instead, in the following pages, I want to take you on a journey through the revolution of data discovery and visualization, and explore how these practices are fundamentally transforming the capabilities of the data-driven organization.
The book is organized into four parts, designed to take you, the reader, logically through the compounding topics to provide a guided journey through the people, processes, and technologies of visual discovery.
Part I focuses on how data is the driving force behind the disruption, transformation, and reinvention impacting every industry today. This affects how companies benefit from improved agility and faster time to insight in visual discovery—and why data visualization is key to working with and understanding bigger and more diverse and dynamic data.
Part II begins with a brief history on visual communication and the reinvigorated role of data visualization as an analysis and storytelling mechanism. Key design principles and data visualization best practices will be reviewed. This section will also explore the data visualization continuum, with emphasis on exploratory and explanatory graphics, as well as the power of pictures in infographics and iconography.
Part III dives into the technical and organizational aspects of building the foundation for data discovery through people, processes, and technologies focused on enabling a culture of visual data discovery.
Finally, Part IV concludes by setting our sights on the future and exploring the approaching Internet of Things. It will highlight the need for data visualization in advanced technologies, including streaming and animated data, human-centered design in mobile strategies, the interconnected web of wearable devices and personal analytics, and peek into gameplay and playful data visualization fueled by machine learning and affective computing technologies.
..................Content has been hidden....................
You can't read the all page of ebook, please click here login for view all page.